


Services on Demand
Article
 English (pdf)
 Article in xml format
 Article references
Indicators

Related links
-
 Cited by Google
 -
 Similars in Google
Share

 Permalink
Journal of the Southern African Institute of Mining and Metallurgy
On-line version ISSN 2411-9717
Print version ISSN 2225-6253
J. S. Afr. Inst. Min. Metall. vol.117 n.2 Johannesburg Feb. 2017
http://dx.doi.org/10.17159/2411-9717/2017/v117n2a5
WITS SPECIAL EDITION - VOLUME II
Geostatistical techniques for improved management of brickmaking clays
M.H.M. von WiellighI, II; R.C.A. MinnittII
INational Ceramic Industries South Africa (Pty) Ltd, Aquarella Investment 389 (Pty) Ltd, Vereeniging
IISchool of Mining Engineering, University of the Witwatersrand, South Africa
SYNOPSIS
Brick manufacturers supply a variety of uniquely coloured facebricks to the building industry, which requires a high level of colour consistency in the products. Colour variation in bricks is influenced by the composition and consistency of the white clay raw material. By blending varieties of naturally occurring white clay the manufacturers produce a unique range of facebrick products. Homogeneity of the white clay raw materials mined at Lenasia is crucial for producing bricks of consistent colour. Geostatistical investigations of the major element distributions (SiO2, Al2O3, Fe2O3, and K2O) and loss on ignition (Lol) were conducted. An analysis of the spatial continuity of these variables followed by ordinary kriging indicated that the upper white clay layer at Lenasia is richer in K2O and Fe2O3 than the lower layer. Consistency in the colour of facebricks depends critically on careful management of the variability in the K2O and Fe2O3 content of the clays. The geostatistical approach to understanding the distribution of elements in the clay allows miners to construct clay stockpiles of consistent quality for feeding the brick-making process. Geostatistical investigation of the chemical contents in other clay domains within the deposit is recommended, and could be extended to all facebrick manufacturers to assist in improving the colour consistency of their products.
Keywords: geostatistics, facebrick clay, chemical composition, colour consistency.
Introduction
Most clay in South Africa is used in the manufacturing of tiles, pipes, bricks, whiteware, refractories, and pottery. Bricks are manufactured from a wide variety of clay types, the behaviour of which during firing depends critically on the the clay mineralogy and chemical composition, but this relationship not well understood (Stein, 1982). The variety among clay deposits is related to the different processes of formation (Deer, Howie, and Zussman, 1992). The geochemical composition of the clay can vary between layers and within the same layer in an individual deposit (Lurie, 1984). The properties of clay minerals are determined by their structures and the different combinations of silicate layers, cations, and hydroxyl ions (Kingery, Bowen, and Uhlmann, 1976). South African clays can be classified as either kaolinite or montmorillonite and are seldom found in a pure form (Lurie, 1984). Different clay minerals affect the drying, forming, firing behaviour, colour, and quality of the brick product in different ways. Laboratory tests (full physical analysis) can indicate the suitability of a clay for the manufacture of ceramic products. The minerals most essential for the manufacturing of clay brick products are kaolinite, illite, and quartz (Stein, 1982).
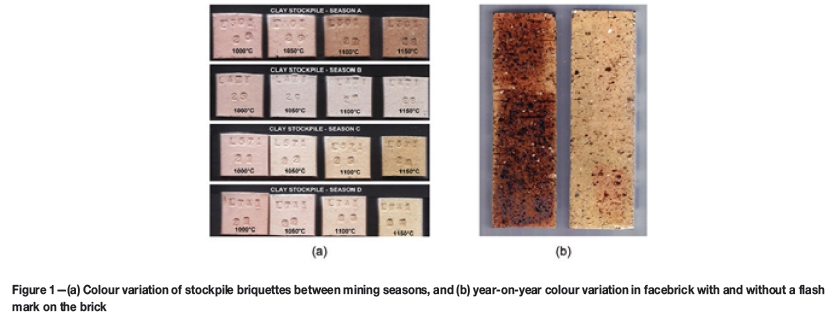
South Africa's manufacturers of clay facebricks supply a range of uniquely coloured bricks to the market by blending a variety of clay materials during the manufacturing process. Management of the raw material is a key factor in ensuring that consumer demands for a consistent product are met. The homogeneity of the raw materials mined from year to year is crucial for a reliable supply of bricks with a consistent colour. Selective mining of the different clay types from an opencast operation provides the colour variation in the products that arises from variability in the composition of the raw materials. These colour variations are managed by adjusting either the mix formulation or the process parameters. The colour variation of laboratory-fired briquettes for one of the white clay stockpiles over a period of four seasons is shown in Figure 1a. The briquettes show distinct colour differences, especially for firing temperatures between 1050°C and 1150°C. Figure 1b illustrates the effect of these variables on the colour of the brick. The colour of the facebrick is controlled by the contents of the K2O fluxing agent and Fe2O3, which are strong colourants. These variables are sensitive the firing temperature in the kiln, which is strictly controlled to maintain year-on-year consistency of the colour of the bricks.
The clay beds are sampled firstly when diamond drill core is logged and sampled for full silicate major element analysis, and secondly during the non-systematic grab sampling of stockpiles to check the geochemical variability of the clays. The full silicate analyses of white clay from the borehole core are used in the geostatistical estimation and resource modelling.
This study is aimed at improving the quality and consistency of clay that is mined and then stockpiled through geostatistical analysis of the variables that affect the facebrick product colour using ordinary kriging. The improved management of the clay stockpile would be evident through improved year-on-year quality and colour consistency of the final product. Over the years, geochemical analysis of clays reclaimed from the stockpiles revealed noticeable fluctuations of the major element oxides. The difference in the major element oxide contents in the stockpile (combined upper and lower white clay layer) and the individual upper and lower clays is shown in Table I.
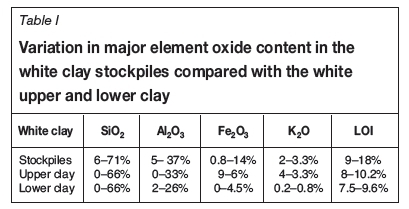
The upper and lower white clay units were treated separately in the geostatistical evaluation. As well as the differences between the upper and lower clays (Table I), contamination with other clay types contributes to the geochemical variability of the stockpiles. The different clay types are geochemically complex, and it is difficult to visually distinguish between the clay types in the pit.
Geology of the Lenasia clay beds
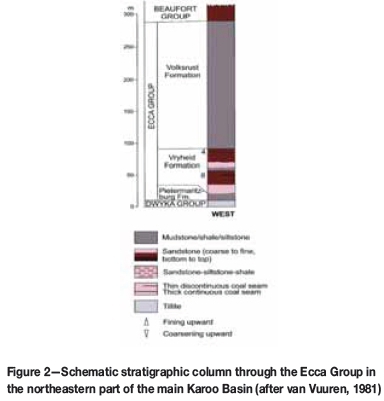
Clay deposits occurring near Lenasia, Soweto are believed to belong to the Ecca Group and stratigraphically equivalent to the coal-bearing formation of the Karoo Basin (Figure 2). Clays accumulated in clean-scoured depressions and in deep dolomite valleys in the Chuniespoort Group of the Transvaal Supergroup, carved out by glacial activity. As the glaciers withdrew at the onset of Karroo deposition, tillite and diamictite accumulated in these depressions on the pre-Karoo surface in the Lenasia area, with remnants of the Karoo Supergroup forming a belt of clay outlier sediments (Jones, 1984). These outliers appear to be separate from the main basins of the Karoo Supergroup.
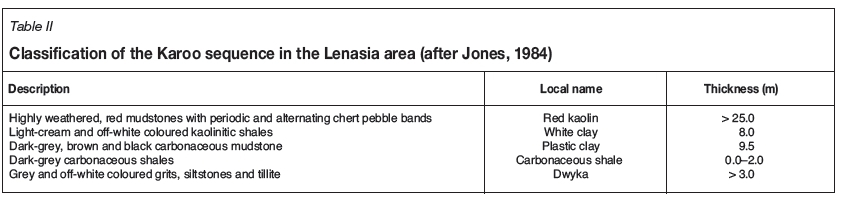
At a local scale the clay bed outliers of the Ecca Group at Lenasia consists of 15 m of red mudstone overlying 8 m of pale cream and off-white shale and some 2 m of carbonaceous clay. The stratigraphy of the Karroo beds at Lenasia is described by Jones (1984) and is shown in Table II.
Statistical evaluation of data
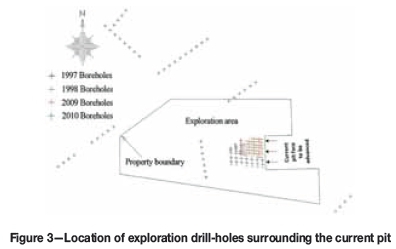
The chemical composition, and by implication the mineralogical composition, is the most important factor in determining the suitability of a clay for brickmaking. The content of silica (SiO2), alumina (Al2O3), iron (Fe2O3), potassium (K2O), and loss on ignition (LoI) were used in the geostatistical analysis. The geochemical analyses were performed on clay samples gathered from 60 boreholes that were drilled into the clay beds in the open pit area (Figure 3).
While it is possible to determine the geochemical distribution of elements in the clay using simple contouring techniques, the more appropriate ordinary kriging technique was applied. The aim of this exercise was to estimate the distribution of elements in the clay beds to assist future quarry development and planning. Furthermore, this information could provide a means of ensuring that geochemically similar clays are extracted and stockpiled, thereby improving the mineralogical consistency of the raw materials from which the brickmaking clays are drawn. Planning the extraction of the clay to minimize chemical variability will enable value-added decision-making and improve product quality and consistency.
The location of exploration boreholes relative to the operating quarry is shown in Figure 3, and is enlarged to show the stratigraphy of clay types in Figure 4. The core was logged according to lithology and analysed for chemical composition of some major elements using X-ray diffraction and wet-chemical techniques. The position of boreholes drilled in the 2009/2010 period are shown as red and green crosses (Figure 3), and are shown on a 50 m x 40 m grid in Figure 4.
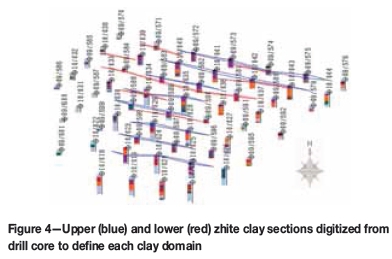
The geological modelling and domaining was based on the geology revealed in the borehole logs, while geochemical analyses were used for geostatistical data analysis, variography, modelling, and estimation. The areal extent of the upper white clay domain is larger than that of the lower white clay domain.
Descriptive statistics
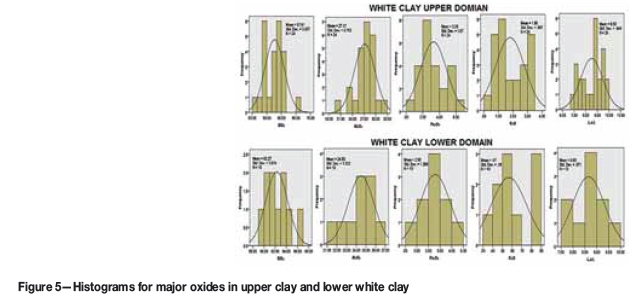
Descriptive statistics for the upper and lower white clay domains are given in Table III, with histograms for the major oxides shown in Figure 5.
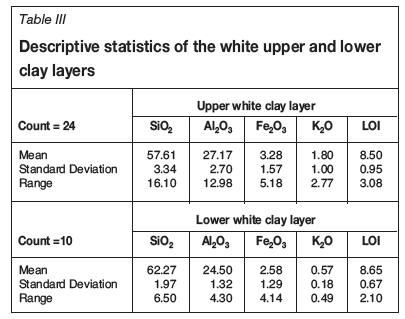
The variability of all major oxides in the upper clay beds is consistently higher than in the lower clay beds, with the upper beds having a higher clay content (lower SiO2/Al2O3 ratio) and higher flux content (Fe2O3 and K2O), as reflected in the ratios of these oxides. Owing to the paucity of data, definitive statements about the nature of the distributions are somewhat tenuous, except for the observation that they appear to be normally distributed.
The lower SiO2/Al2O3 ratio in the white upper clay, at 2.14 compared to 2.57 in the lower clay, indicates a greater clay content. This promotes increased shrinkage during drying and firing, with the fired brick being less water-absorbent. The difference in the K2O and Fe2O3 contents of the upper and lower clay beds is significant. The higher K2O (3.30%) and Fe2O3 (2.08%) content in the upper clay means that bricks manufactured from this clay develop a more intense colour than those from clay from the lower beds (K2O 0.57% and Fe2O3 2.41%). In the presence of K2O, Fe2O3 is likely to develop a dark colour at lower temperatures, and in its absence, a lighter colour (assuming all other properties remain constant). The low K2O content in the lower white clay should contribute little to the development of the colour intensity in the brick if the Fe2O3 content is low (< 1%); however, the opposite was found for the upper white clay.
Potassium oxide is a strong flux that promotes the formation of a liquid phase from illites and mica minerals at high temperatures. Data analysis revealed a strong positive correlation between K2O and mica content. Iron oxide is a strong colorant that causes an intense red colour in bricks. A very strong positive correlation was found between Fe2O3 and the interstratified illite/smectite mineral.
Geostatistical analysis of data
Variography
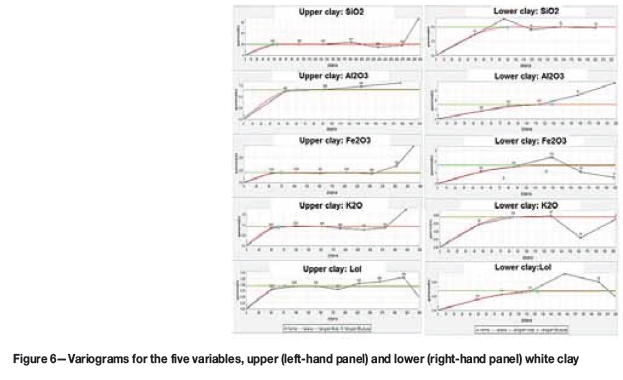
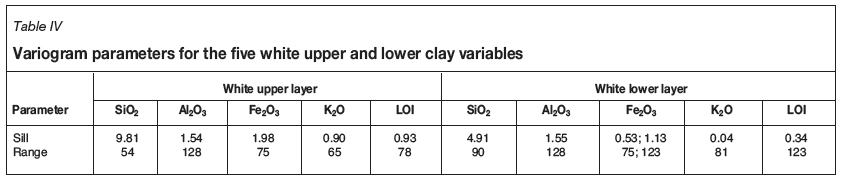
Omnidirectional experimental and model variograms for the five major elements in both the upper and lower white clay units were constructed and are shown in Figure 6. Except for Fe2O3 in the lower clay unit, which has two structures, the variograms are single structure, spherical with an extremely small nugget effect for both the upper and lower clay beds. The geochemical dispersion was naturally found to be more continuous along the elongated direction of greatest drilling density, but this did not reflect underlying anisotropy nor warrant the use of directional variograms to model the deposit.
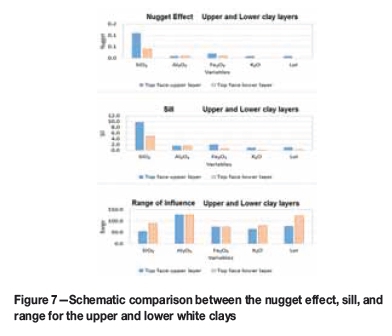
Parameters for the variogram models of elements in the upper and lower clay beds, as shown in Figure 6. are listed in Table IV.
Variogram parameters listed in Table IV are summarized and compared in Figure 7. The nugget effect and the sill for both the upper and the lower white clays are low, with the nugget effect and the sill for SiO2 in the upper and lower clay beds being the highest amongst the variables. The longest range is for Al2O3 in the upper and lower clay beds.
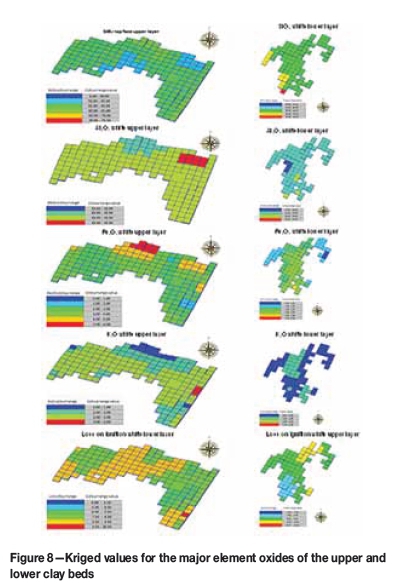
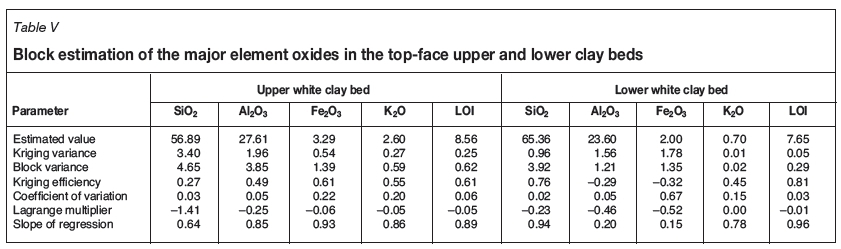
The results of ordinary kriging of the major element oxides are tabulated in Table V, and are shown graphically for the upper and lower clay beds in Figure 8. The apparent geochemical continuity in the east-west direction of the deposit is due to the greater density of drilling in this direction rather than a true reflection of geochemical anisotropy of the clay units. Additional drilling is required before preferential directions of clay deposition can be positively identified.
The kriging variance and kriging efficiency are shown in Table V. Kriging variance is independent of the data values used to calculate the estimate. It is a function only of the spatial configuration of the data variables, and indirectly reflects the reliability of the estimate; the closer the data, the lower the kriging variance, and hence the assumption that it reflects a better estimate (Coombes, 2008). The kriging variance is highest for the variables in the upper white clay unit, except for Fe2O3, which is higher for the lower white clay.
Kriging efficiency measures how accurately the kriging estimate predicts the block grade, i.e. the expected percentage overlap between the estimated block histogram and that of the true block grades. The kriging efficiency is positive for all the major oxides in the upper clay, but negative for Al2O3 and Fe2O3 in the lower clay. Negative kriging efficiency means the kriging variance is greater than the true block variance, and hence the arithmetic mean is likely to give a better estimate than the kriged value (Coombes, 2008).
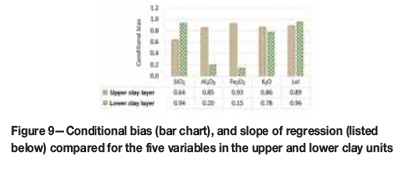
A comparison between the conditional bias (vertical bar chart) for the five variables in the upper and lower clays is shown in Figure 9. The slope of regression (SoR) for the five variables is listed below the bar chart in the figure. Conditional bias indicates the over- and under-estimation of grades, with an estimated value of unity being a perfect predictor (Coombes, 2008). The conditional bias for all the major oxides in the upper clay was above 0.8, except for SiO2 (0.64), suggesting that in general the variables in the upper clay were better predicted than those in the lower clay. Apart from the very low SoR values for Al2O3 and Fe2O3 in the lower clay (0.2 and 0.15, respectively), the SoR suggests that variable grades were well predicted. Further investigation into the nature of the populations was limited by the paucity of data for the lower clay unit.
Conclusions
The results of the geochemical and geostatistical investigations demonstrate that the upper and lower clay beds are significantly different in composition. The average values of the elemental oxides in the upper and lower clay beds are significantly different from the mean of the poorly blended clays reclaimed from the stockpile. The assumption that the material in the stockpile is geochemically homogeneous is therefore incorrect. Although the upper and lower clay beds could be blended on a stockpile and fired to produce bricks of a similar colour, blending inefficiency has led to uncontrolled variability in the brick products.
The elongated direction of greatest drilling density matches the naturally more continuous geochemical dispersion, but this does not reflect an underlying anisotropy in the deposit. Contour maps indicate a higher major element oxide variability in the upper clay than in the lower clay units, making the former a less consistent feed to the kilns. The upper to lower clay volume ratio was 3:1, indicating that three times more white clay is recovered from the upper unit than from the lower unit.
The aim of this study was to provide guidelines for improving the consistency of blended of raw materials that are reclaimed from the stockpiles to avoid unnecessary adjustments in the firing process. Regular sampling of individual stockpiles to determine the geochemistry of each clay type allows for better control of raw material feed and will prevent contamination between the stockpiles. Provided the process is controlled, knowledge of the stockpile geochemistry may be used to minimize variations in product quality and colour. Kriging estimates of elemental variables provide valuable information about the quality of the clay deposits and offer insight for improved mine planning and consistent product quality.
The apparent geochemical continuity in the east-west direction orientation of the deposit is due to the greater density of drilling in this direction rather than a true reflection of geochemical anisotropy of the clay units. Any recommendation to change the mining direction of the current pit face would be premature. However, any change in mining method that will allow the clay beds to be mined individually in order to minimize cross-contamination and reduce geochemical variability in the clay stockpiles should be implemented. Current practice is that clay from the upper and lower units is stockpiled together, making it impossible to discriminate between the clay types at reclamation. Separate stockpiling would allow selective reclaiming of the clay types, enabling the product colour and quality to be controlled and improved. The capital cost of changing mining methods or directions must be offset against improved product yields and sales margins.
The value of the geochemical analyses in terms of accuracy and precision depends strongly on the quality of the samples collected during core logging. The chemical composition, and hence the quality, of the clay reclaimed from the upper and lower stockpiles can be estimated from samples taken from boreholes in the upper and the lower clay beds. With this knowledge, the required volume and ratio of upper and lower clay could be blended to meet predetermined product specifications. Infill drilling on the lower white clay would provide more detail regarding Al2O3 and Fe2O3 geochemistry and thereby improve the estimation and delineation of the clay beds.
Inconsistency in the product mix could be reduced by blending the upper clay (3.30% Fe2O3 and 2.08% K2O) with clay from a separate lower clay stockpile with a lower Fe2O3 (2.41%) and K2O (0.57%) content. Additionally, the proportions of upper and lower white clays are dissimilar and blending them in the current proportions being mined will deplete the lower clay before the upper clay. Using the lower clay as a diluting agent should improve the quality consistency of the raw material and would extend the longevity of the lower clay domain. The practice of blending these two clays on one stockpile, because they seem similar, exacerbates the quality inconsistency of the raw material. The reason for this is that the ratio of these two clays mined from the deposit is not consistent from one mining season to the next.
References
Bohling, G. 2005. Kriging. Kansas Geological Survey. http://people.ku.edu/~gbohling/cpe940/Kriging.pdf [accessed 10 September 2015] [ Links ]
Coombes, J. 2008. The Art and Science of Resource Estimation. Coombes Capability, Perth, Western Australia. [ Links ]
Deer, W.A., Howie, R.A., and Zussman, J. 1992. An Introduction to the Rock Forming Minerals. Longman, Harlow, UK. [ Links ]
Dohm, C.E. 2012. Introduction to geostatistical methods in mineral resource evaluation. Course notes for MINN 7006, May 2012, University of the Witwatersrand, Johannesburg. [ Links ]
Jones, D.H. 1984. Unstable ground conditions associated with Karoo outliers in the dolomitic environment of the Far West Rand. PhD thesis, University of Pretoria. [ Links ]
Johnson, M.R., van Vuuren, C.J., Visser, J.N.J., Cole, D.I., Wickens, H. de V., Christie, A.D.M., and Roberts, D.L. 1997. The foreland Karoo Basin, South Africa. Sedimentary Basins of Africa. Selly, R.C. (ed.). Elsevier, Amsterdam. pp. 269-317. [ Links ]
Kingery, W.D., Bowen, H.K., and Uhlmann, D.R. 1976. Introduction to Ceramics. 2nd edn. Wiley, New York. [ Links ]
Lurie, J. 1984. South African Geology for Mining, Metallurgical, Hydrological and Civil Engeneering. 4th edn. McGraw-Hill, Johannesburg. [ Links ]
Stein, V. 1982. The raw materials for brick and tile making. Brick and Tile Making. Procedures and Operating Practice in the Heavy Clay Industries. Beider, W. and Handle, F. (eds.). Bauverlag GmbH, Berlin. [ Links ]
Van Vuuren, C.J. 1981. Depositional models for the Vryheid Formation in the north-eastern part of the Karoo Basin - a review. Annals of the Geological Survey of South Africa, vol. 15, pp. 1-11. [ Links ]
Velde, Β. 2010. Origin and Mineralogy of Clays. Springer-Verlag, Berlin, Heidelberg. [ Links ]
Paper received Mar. 2016
Revised paper received May 2016

