


Services on Demand
Article
 English (pdf)
 Article in xml format
 Article references
Indicators

Related links
-
 Cited by Google
 -
 Similars in Google
Share

 Permalink
Journal of the Southern African Institute of Mining and Metallurgy
On-line version ISSN 2411-9717
Print version ISSN 2225-6253
J. S. Afr. Inst. Min. Metall. vol.117 n.1 Johannesburg Jan. 2017
http://dx.doi.org/10.17159/2411-9717/2017/v117n1a11
GENERAL PAPERS
Performance optimization of an industrial ball mill for chromite processing
S.K. TripathyI; Y.R. MurthyI; V. SinghI; A. SrinivasuluII; A. RanjanII; P.K. SatijaII
IResearch and Development Department, Tata Steel Ltd. Jamshedpur, India
IIFerro Alloys Minerals Division, Tata Steel Ltd. Sukinda, India
SYNOPSIS
In this investigation, we optimize the grinding circuit of a typical chromite beneficiation plant in India. The run-of-mine ore is reduced to a particle size of less than 1 mm in the comminution circuit and concentrated using gravity separation. The comminution circuit comprises two-stage crushing and single-stage grinding in a ball mill in closed-circuit with a high-frequency screen. A detailed circuit audit was undertaken at the plant to understand and evaluate the performance of the grinding circuit. The audit revealed abnormalities in the process and design parameters which caused high energy consumption, lower throughput, and loss of ultrafine chromite. Laboratory studies indicated the differences in the grinding properties (work index, breakage rate, etc.) and liberation sizes of these ores. Studies also revealed that grinding media size, particle retention time, and pulp density are crucial in coarse grinding. Based on the laboratory grinding and characterization studies; simulation studies were performed to optimize the operating parameters of the grinding circuit.
Keywords: coarse grinding circuit, ball mill, process optimization, chromite benefi-ciation, ultrafine reduction.
Introduction
Comminution is a critical process in mineral processing which strongly influences the economics of production. In mineral processing, particles containing valuable minerals must be disintegrated at a sufficiently fine size to liberate valuable minerals from waste constituents, so that they can be easily separated by an appropriate beneficiation method. The Sukinda chrome ore beneficiation plant utilizes different types of run-of-mine (ROM) ore with different physical properties (viz. grindability characteristics, work index, mineral composition, liberation, chemical composition, etc. for the production of chrome concentrate. In the feed preparation circuit, the ROM ore is crushed and ground to below 1 mm. Grinding in the chromite beneficiation plant is a critical unit operation to achieve the desired product size of below 1 mm and to control the generation of the ultrafine particles. Furthermore, about 40% of total power consumption in the beneficiation plant is accounted for by the grinding of the ore. This implies that any improvement of the circuit performance will lead to an overall increase in productivity.
The product of the existing grinding circuit at the Sukinda chromite ore beneficiation (COB) plant contains about 30-40% ultrafine particle (<45 μm). The generation of ultrafines adversely affects the efficiency (higher specific power consumption, losses of ultrafine chromite in the tailing, etc.) of the beneficiation circuit. The ROM ore properties (size distribution, grindability, liberation, physical properties, etc.) vary significantly between the different ore layers (northern band and mid band). So it is necessary to revisit and optimize the existing grinding circuit based on the ore characteristics. Grinding is an inefficient process, and many factors can affect the grinding performance. The grinding mill performance is assessed based on the load behaviour, mill power, and the rate of production of fines. Grinding performance, regarding material breakage and power consumption, has been studied and reported in the literature with a broad range of operating parameters, such as mill speed, charge filling, ball size, and lifter type (Austin, Klimel, and Luckie, 1984; Powell and Smit, 2001; Cleary, 2001; Dong and Moys, 2003; Tripathy, Murthy, and Singh, 2013). It is, however, crucial to explore other available avenues that can lead to an understanding and improvement in the process.
With this objective, a detailed study was carried out at the plant as well as at laboratory scale to optimize the grinding process in order to minimize the generation of ultrafine material and improve the productivity. By reducing the production of ultrafines in the grinding mill, the energy consumption will improve. Furthermore, the downstream gravity separation will also improve, since the particle separation is better at coarser size fractions.
Experimental methodology
Sukinda COB plant receives feed from two mines and stores it at four different lots based on the chemical analysis. The various ores are blended and supplied to the beneficiation plant in order to achieve a target feed grade of approximately 35% Cr2O3. Seven different ore ratios were provided to the beneficiation plant during the sampling campaign. The initial phase of the study was carried out both in the laboratory and on the full-scale plant. The second phase focused on optimizing variables that were identified as critical in achieving target production. This work was divided into three stages: (i) performance study of the grinding circuit, (ii) characterization studies of different chromite ores, and (iii) optimization of the grinding circuit.
Grinding circuit of COB plant, Sukinda
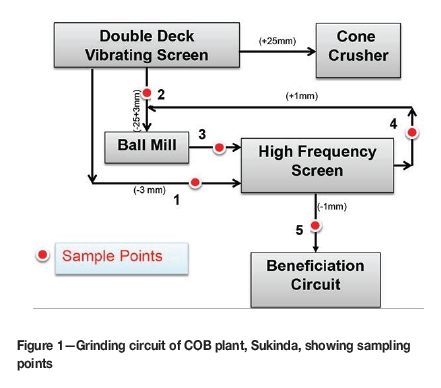
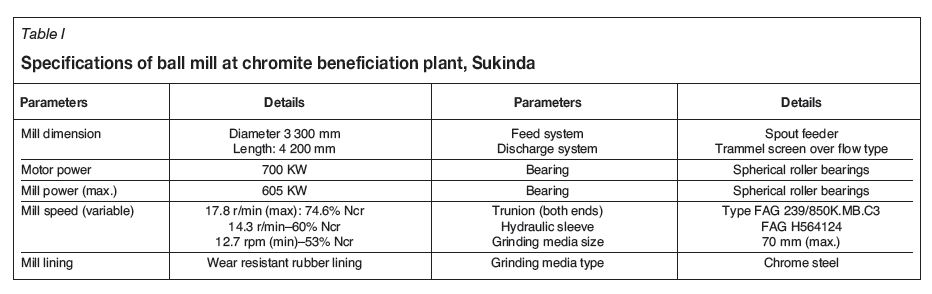
The schematic process flow sheet of the COB plant grinding circuit is shown in Figure 1. The ball mill is in closed circuit with a high-frequency screen, which has an aperture of 1 mm. The specifications of the ball mill are given in Table I. Different sampling points were identified in the circuit for collecting the representative sample, as shown in Figure 1. The sampling campaign was carried out for two months. Representative samples were collected on a two-hourly interval basis for each shift. The composite sample was mixed, dried, and weighed for further analysis.
Characterization studies ofchromite ore
About 200 kg each of three different samples were collected from two separate mines, namely the northern band and middle band at Sukinda. The samples were crushed to 6 mm in a jaw crusher and mixed thoroughly to ensure homogeneity. Standard methods (riffling and splitting) were used to prepare representative samples for characterization studies. Chemical analyses of these three chromite ores are given in Table II. The characterization studies included size distribution and liberation analysis using an automated mineral analyser (QEMSCAN). Different grinding characterization studies such as Bond Work Index (BWI), Hardgrove Grindability Index (HGI), friability, grindability, and breakage rate were also carried out.
Optimization studies
Optimization studies were carried out by using the real-time data analysis of the circuit, as well as by simulating the parameters with different developed empirical equations for the optimum process and design parameters of the ball mill. The details of these are discussed in the next section.
Results and discussion
Performance of grinding circuit at COB plant
Performance studies of the circuit at full plant scale were initiated by considering the type of ore to be fed as well as the blending ratio. The main process parameters examined during the sampling campaigns were feed rate, feed pulp density, ball mill speed and grinding media consumption rate, water spray rate on the high-frequency screen, and feed pulp density to the screen. The performance of the ball mill varied with the ore properties. The effect of process parameters on ultrafines generation and power consumption in the ball mill is explained further.
Quantity of ultrafines in feed and grinding product
During mining and crushing (before the grinding circuit), a significant amount of fines (less than 1 mm) is generated (Figure 2a). The data-set in the figure indicates the number of shifts considered and represented statistically. The depicted quantity of the ore is not fed to the ball mill. It is observed from Figure 2a that the fines content of the feed varied from 82% to 17%, and the histogram indicates a negatively skewed distribution. Skewness in the histogram indicates distribution of the data towards either negative or positive values. Most data values are between 50% and 70%. The mean value of the data-set is 57.8%.
Ultrafines generation in grinding circuit
Ultrafines generation in the ball mill has many demerits such as lower throughput, energy loss, and inadequate capture of ultrafine chromite particles in the beneficiation process. It is therefore always advantageous to minimize the generation of ultrafines. The ultrafines content of the ball mill product was monitored for two months, and the production of each shift is presented in Figure 2b. The percentage of ultrafines (<45 μm) in the ball mill product varied from 6% to 60%, with an average of about 28%. 40% of the samples taken over this period contained more than 30% ultrafine material.
Power consumption of the grinding mill
The power consumption of the grinding mill is a critical parameter in the economics of the chromite beneficiation process. The ball mill consumes about 25-30% of the total energy in the beneficiation plant, and hence any improvement will improve the overall economics of the plant. The power consumption of the ball mill was monitored for two months, and the data is shown in the histogram in Figure 2c. It can be seen that the power consumption for each shift varied between 250 and 350 kWh. The data-set is negatively skewed, and the average power consumption for each shift during this period was 294 kWh.
Process audit data for grinding circuit
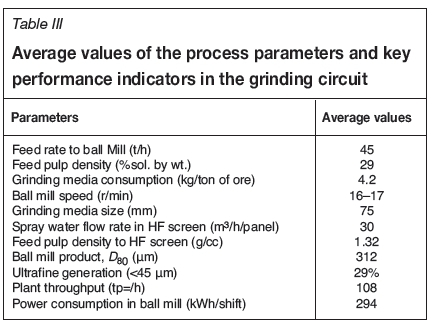
In addition to the ultrafines generation and energy consumption, the average values for each of the process parameters, along with all key performance indicators, are given in Table III. The values of these parameters vary widely. This may be due to adverse changes in the physical properties of the ores. There are also a few correlations which were derived from the plant analysis data.
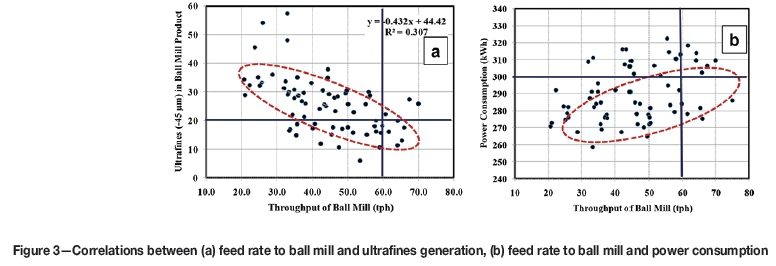
The effect of ultrafines generation in the ball mill on power consumption for each shift is shown in Figure 3. It is found that the power consumption can be reduced to below 280 kWh for a shift at a feed rate higher than 40 t/h. It is also observed that with an increase in the feed rate, ultrafines generation in the ball mill decreases. The correlation is depicted in Figure 3a, from which it can be seen that the production of the ultrafines can be kept below 20% by maintaining the feed rate higher than 60 t/h. The relationship between the mill throughput and power consumption is shown in Figure 3b. It can be observed that with an increase in feed rate, there is an increase in power consumption. However, the overall production cost per ton will decrease at higher throughput, due to the increase in production rate for the same level of energy consumption.
Characterization studies of chromite ores
Size and chemical analysis
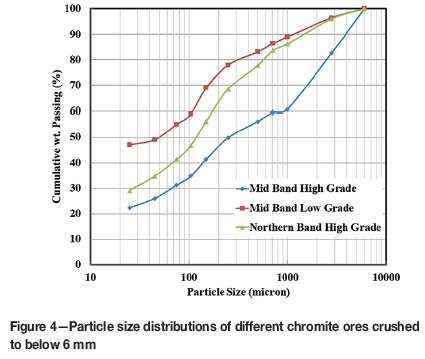
Particle size distribution measurement was carried out by using a vibratory laboratory sieve shaker (Analysette3, Fritsch, Germany). The size distributions of the three samples are given in Figure 4. It is clear that these ores produce huge quantity of fines during crushing and handling of the sample, as the generation of <45 μm particles varied from 26% to 49%, compared to the target of <20%. It is also found that mid band low-grade chromite ore is softer and more friable than the mid band and northern band high-grade chromite.
Mineralogical analysis using QEMSCAN
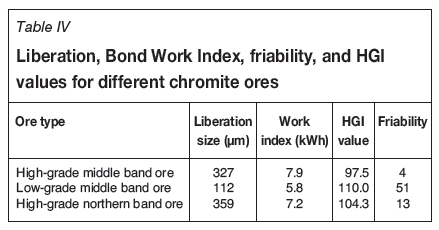
QEMSCAN is an extremely versatile SEM-based automated mineralogical analysis system which gives the quantitative modal mineralogical data to trace mineral levels, calculated chemistry, mineral association and liberation data, and elemental deportment with a mineralogical map of the sample (Tripathy, Murthy, and Singh, 2013). The analyses of the head samples of size <6 mm are depicted in Figure 5. It can be observed (Figure 5a) that the low-grade mid band ore contains about 50% by weight chromite, with goethite and Fe-silicates being the major gangue minerals. In the high-grade northern band ore, about 85% by weight of the sample is chromite. In the case of the high-grade middle band ore, the main gangue minerals present are Fe-silicates, goethite, haematite, and gibbsite. Liberation analysis results of the head samples (crushed at 6 mm) are shown in Figure 5b. It is observed that in the northern band ores, the liberation is high and almost 75% of the chromite is liberated at >50%. In the case of the middle band low-grade ores, only 20% is liberated at >50%. These ores will require more grinding than the high-grade ores to improve the liberation. The head sample of the low-grade middle band ores contains 40% chromite in the form of 40-50% liberated. This means that half of the particles are half-locked. In the northern band ores, 32% chromite by weight is in the particles that are 70-80% liberated. This means that a significant amount will be liberated at a minimum grinding time. Furthermore, the liberation of chromite grains is determined by grinding the ore to different sizes, and these results are tabulated in Table IV. It is observed that the northern band high-grade ore liberates at a coarser size (359 μm) than the others. It is also noted that chromite particles in the low-grade middle band ore are liberated at finer size, i.e. 112 μm. For the different combination of ore blends, the liberation size will be the intermediate size of the respective blended ores. The order of liberation is as follows:
Low-grade middle band ore (112 μm) < High-grade middle band ore (327 μm) < High-grade northern band ore (359 μm)
Laboratory grinding studies
BWI, HGI, and friability
Representative samples were prepared separately by stagewise crushing to less than 2.8 mm. The BWI tests were carried out as per the standard procedure (Bond, 1961). The BWI for these three types of chromite ore is given in Table IV. Similarly, HGI was determined as per the standard procedure (Edwards et al., 1980) and the results are also shown in Table IV. The BWI of these ores is found to range from 5.8 to 7.9 KWh/t, which indicates that the chromite ore of this region is friable and soft compared to the ferrous minerals such as haematite and magnetite. The low-grade middle band ore is softer that the high-grade middle band. The sequence of the BWI for different chromite ores is as follows:
Low-grade middle band ore > High-grade northern band ore > High-grade middle band ore
A similar trend is observed for the HGI values. It is noted that higher the HGI, the softer the ore. The brittleness tests can determine friability of ores. The test apparatus used by Ozkahraman (2005) to check the friability of limestone was used for determining the friability of the three different chromite ores. The test parameters were kept constant for the three ore types. The particle size of the sample was below 6 mm, and the quantity was 500 g. The drop weight is was 14 kg, and the number of drops maintained during the test was 200. The details of the test procedure are explained in Ozkahraman (2005). The friability of the chromite sample was determined by calculating the amount of ultrafines (below 45 μm) produced by comparing before and after the test and expressed as:
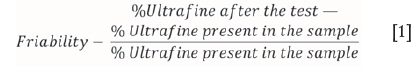
Friability value varies from 0 to 100, with higher values indicating increased friability. The results obtained from the test work are given in Table IV. It is evident that the low-grade middle band chromite ore produces less ultrafines (<45 μm) than the other two types.
Estimation of breakage rate
The experimental methodology is known as the 'one-size fraction method'. Special feed charges are prepared to correspond to the different size fractions of interest. The size fraction of interest is made the topmost size interval, i.e., the feed charge contains no material coarser than this size interval. Each feed charge has more than 90% material in the respective topmost size interval. The remaining material is mostly in the next finest size interval. Depending on the expected grinding rate of the topmost size fraction, the ball mill is run for a short time, t, (30 seconds to 1 minute or so) such that not more than 25-30% material is lost from the topmost size interval. The specific breakage rate kifor the ith size class, which happens to be the topmost size class for the experiment under consideration, can be calculated from the following expression (Narayanan, 1987; Narayanan, Hess, and Burns, 1987):
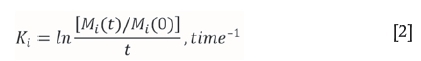
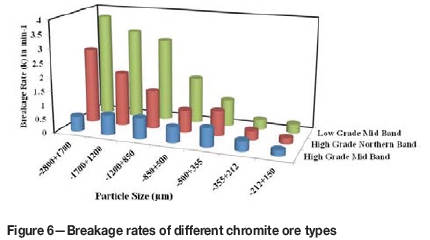
Results obtained on the breakage rate parameter values (Figure 6) show that above 500 μm size, high-grade mid band ore particles break at a much slower rate than particles of the same size of the other two samples. Particles below 500 μm break at nearly the same rate for all three samples. Although the top three size fractions of high-grade northern band and low-grade mid band break at a much higher rate than same size particles of high-grade mid band ore, the difference in BWI values is relatively small. This is because the recycled fraction of the particulate charge (71% of total charge weight) in the Bond test contains only a very small amount of these coarse particles and the fresh feed constitutes only about 29% of the total particulate charge of the feed in each cycle.
Optimization studies
Based on the characterization, laboratory grinding studies, and plant audit of the circuit, an optimization strategy was formulated. For better understanding, the parameters are classified into two types; i.e. design and process parameters. From the results of the plant audit, it was found that the capacity of the ball mill was underrated against the designed capacity of 75 t/h. The ball mill was operating at 45 t/h during the audit period. Conventionally, a ball mill is preferred for fine grinding, whereas a rod mill is for coarser grinding (Napier-Munn et al., 1996). The top particle size in the feed to the ball mill was 25 mm, which is very high for this type of mill. In other words, the retention time inside the mill was not sufficient to discharge particles of size 3 mm (the aperture size of the discharge trommel). The coarser particles were therefore discharged from the ball mill (i.e. reported without grinding as the oversize particles in the trammel). Based on the design criteria, the top particle size of the feed to this type of mill should not exceed 15 mm (Narayanan, 1987; Napier-Munn et al., 1996). Also, the grinding media size plays an important role in particle breakage and kinetics. The top make-up size of the balls for the grinding mill can be computed as:
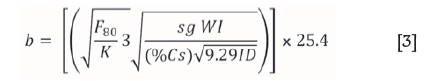
where b is the diameter of the make-up ball (mm), F80is the feed size in micrometres (80% passing), sg is the specific gravity of the ore feed, WI is the work index of feed, D is the diameter inside the shell liners (metres), %Cs is the percentage critical speed. K is the constant in Equation [3] which depends on mill type (i.e. 350 for wet overflow mills). Based on Equation [3], the top size of the media should be 90-100 mm for the coarse grinding operation in this mill. Further, the pulp density inside the mill was found to be very low, which is an indication of poor performance. Ultrafines generation will decrease with increasing grinding media size (Mainza et al., 2012). At a lower solid concentration of the feed pulp to the mill, the impact energy of the grinding media is dissipated in the slurry rather than impacting on a particle.
An increase in the solids concentration will therefore help to improve the performance, but it should be optimum because at high solid concentration, there is a chance of overgrinding resulting in excessive generation of ultrafines (Shi and Napier-Munn, 2002). As mentioned in Table III, the feed pulp density to the mill was 29% solids by weight, which is very low. An increase in the pulp density to 40% solids by weight was targeted. For tumbling mills, the speed of the mill is expressed as the fraction (%) of the speed at which the charge at the liner surface would centrifuge, i.e. centrifugal force matches gravity. The critical speed (Cs) in revolutions per minute is given by (Napier-Munn et al., 1996):
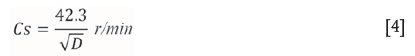
where D is the mill diameter in metres. Larger ball mills are often operated more slowly. However, even for large mills, maximum grinding usually occurs at about 80% of Cs. In this case, the speed of the mill was maintained between 15 to 17 r/min initially, which was 60-75% Cs. It was therefore decided to keep the ball mill speed at optimum between 1617 r/min. The energy consumption in the ball mill was found to be 6.5 kWh/t of ore with a targeted product size below 1 mm. The BWI of the ores varied from 5.8 to 7.8 kWh/t to reduce the particle size below 100 μm, but in real time, the energy consumption is very high compared with the reported value of 6.5 kWh/t. This may be due to the overgrinding of the material inside the mill. Feed rate and power consumption are correlated with each other, along with the ultrafines generation. Feed rate was another critical parameter which has to increase, which in turn decreases the retention time of the particle inside the mill and reduces ultrafines generation. This will also automatically reduce the specific power consumption per ton of ore. With this background, a plant trial was carried out at different optimized process parameters, which resulted in increasing mill throughput and minimizing the generation of ultrafines in the grinding mill. With these optimized values, further plant trials were conducted for two months, and the findings are given in Table V. It is evident that with these particular changes, there is a significant improvement regarding ultrafines generation, power consumption, etc.
Summary and conclusions
An optimization study of the grinding circuit of the COB plant, Sukinda was undertaken, and the generation of ultrafines (particle size below 45 μm) was reduced from 29% to 22% by conducting a detailed characterization of different chromite ores along with an in-plant circuit audit. The major conclusions are as follows.
► Three different ore deposits (which are the feed source for COB plant) from the middle band and northern band orebodies of Sukinda chromite mines were investigated for detailed characterization and laboratory grinding studies. High-grade northern band ore analyses 45.9% Cr2O3, whereas high-grade and low-grade middle band ores contain 34.02% and 30.5% Cr2O3 respectively
► Liberation analysis on the different ores showed that the chromite in the high-grade northern band ore is liberated at a coarser size (359 μm) compared to the others. The order of chromite liberation from different ores is as follows:
Low-grade middle band ore (112 μm) < high-grade middle band (327 μm) < high-grade northern band (359 μm)
► Grindability studies concluded that the BWI is highest for the high-grade middle band ore (7.9 kWh/t). The BWIs for the high-grade northern band and the low-grade middle band ore are 7.2 and 5.8 kWh/t respectively
► The grinding circuit is designed as a close circuit with high-frequency screen to produce particle of size below 1 mm. The particle size (D80) of the ball mill discharge increased from 312 μm to 455 μm after circuit optimization. The recirculating load of the grinding circuit was not improved due to the rejection of >3 mm particles during feeding of hard ore (high-grade middle band ore). There should be a suitable handling system for particles up to 8 mm (maximum) in order to obtain a coarser size distribution
► On optimizing the process parameters, the energy consumption of the grinding mill was reduced from 6.5 to 3.6 KWh/t
► The average feed rate to the ball mill during the trial was increased to 82 t/h compared with the previous feed rate of 45 t/h. COB plant throughput was improved to an average of 132 t/h from the regular 108 t/h by proper optimization and control of the ball mill during the trials. Also, smooth operation of the ball mill was observed during the optimizing period.
Acknowledgements
The authors would like to thank Tata Steel management for permission and approval to publish this work. We also acknowledge the boundless support and assistance rendered by COB Plant personnel and NRD division of Sukinda. Authors would like to acknowledge Dr. V. K. Gupta for carrying out the grindability studies of the ores. The support and services provided by R&D and SS division staff are also duly acknowledged.
References
Austin, L.G., Klimpel, R.R., and Luckie, P.T. 1984. Process Engineering of Size Reduction: Ball Milling. AIME-SME, New York, USA. [ Links ]
Bond, F. 1961. Crushing and grinding calculations. British Chemical Engineering, vol. 6. pp. 543-548. [ Links ]
Cleary, P.W. 2001. Charge behavior and power consumption in ball mills: sensitivity to mill operating conditions, liner geometry and charge composition. International Journal of Mineral Processing,, vol. 63. pp. 79-114. [ Links ]
Dong, H. and Moys, M.H. 2003. Load behavior and mill power. International Journal of Mineral Processing,, vol. 69. pp. 11-28. [ Links ]
Edwards, G.R., Evans, T.M., Robertson, S.D., and Summers, C.W. 1980. Assessment of the standard method of test for the grindability of coal by the Hardgrove machine. Fuel, vol. 59, no. 12, pp. 826-830. [ Links ]
Mainza, A.N., Claremontde, B., Haas, B., Keshav, P., Crafford, D., and Plint, T. 2012. Optimisation of the ball mill circuit using a simulator in conjunction with measurements from a non-intrusive sensor. Proceedings of the XXVI International Mineral Processing Congress (IMPC) 2012, New Delhi, India, 24-28 September. pp. 3098-3106. [ Links ]
Narayanan, S.S. 1987. Modeling the performance of industrial ball mills using single particle breakage rate. International Journal of Mineral Processing, vol. 20. pp. 211-228. [ Links ]
Narayanan, S.S., Hess, F.W., and Burns, R.S. 1987. Optimisation of comminution stages at Bougainville Copper Ltd. Proceedings of Copper- 87: Mineral Processing and Process Control. Mular and Gonzalez (eds.). Facultad de Ciencias Fisicas y Matematicas, Universidad de Chile. pp. 43-57. [ Links ]
Napier-Munn, T.J., Morrell, S., Morrison, R.D., and Kojovic, T. 1996. Mineral comminution circuits: their operation and optimisation. JKMRC, University of Queensland, Brisbane. [ Links ]
Ozkahraman, H.T. 2005. A meaningful expression between Bond work index, grindability index and friability value. Minerals Engineering, vol. 18. pp. 1057-1095. [ Links ]
Powell, M.S. and Smit, I. 2001. Startling effect of ball scats removal on SAG mill performance. International Autogenous and Semi-Autogenous Grinding Technology, vol. 4, no. 4. pp. 124-137. [ Links ]
Shi, F.N. and Napier-Munn, T.J. 2002. Effects of slurry rheology on industrial grinding performance. International Journal of Mineral Processing, vol. 65. pp.125-140. [ Links ]
Tripathy, S.K., Murthy, Y.R., and Singh, V. 2013. Characterisation and separation studies of Indian chromite beneficiation plant tailing. International Journal of Mineral Processing, vol. 122. pp. 47-53. [ Links ]
Paper received Sep. 2014
Revised paper Received Jun. 2016

