


Services on Demand
Article
 English (pdf)
 Article in xml format
 Article references
Indicators

Related links
-
 Cited by Google
 -
 Similars in Google
Share

 Permalink
Journal of the Southern African Institute of Mining and Metallurgy
On-line version ISSN 2411-9717
Print version ISSN 2225-6253
J. S. Afr. Inst. Min. Metall. vol.117 n.1 Johannesburg Jan. 2017
http://dx.doi.org/10.17159/2411-9717/2017/v117n1a3
MINING, ENVIRONMENT AND SOCIETY CONFERENCE
Calculating ecological footprints for mining companies - an introduction to the methodology and an assessment of the benefits
D. LimpitlawI; A. AlsumII; D. NealeIII
IUniversity of the Witwatersrand, South Africa
IIRiyadh, Saudi Arabia
IIISynergy Global Consulting, Oxford, United Kingdom
SYNOPSIS
Ecological footprint analysis (EFA) was first described in 1996 as a measure of carrying capacity appropriated by human activities. EFA is a resource and emissions accounting tool designed to track the demand on the biosphere's regenerative capacity. Ecological footprints are increasingly used as indicators of organizational and corporate environmental performance and product sustainability. There is a compelling argument to develop an EFA tool for mining companies.
To determine the size of a mine's ecological footprint, land requirements for all categories of consumption and waste discharge must be summed. This land is only made up of the ecologically productive land and water in various classes (cropland, pasture, forests etc.) required on an ongoing basis to provide all energy and material resources consumed and absorb wastes.
A challenge in conducting an EFA for a mine is the shortage of accessible data. Undertaking an EFA for a corporation or individual site entails compiling consumption and emissions data (which can be used for other reporting applications). The footprint results themselves highlight the most critical aspects of an organization's impact on the environment and provide a platform for focusing actions and for educating the workforce to improve their contribution to best-practice operations. This paper discusses the benefits and challenges of undertaking an EFA for a mining company, and provides examples of the various components of ecological footprints associated with mines, as well as showing how an EFA can be used to understand and communicate some of the impacts associated with mining activities.
Keywords: environmental performance, sustainability, ecological footprint.
Introduction
Fundamental biophysical and economic limits are now being experienced in many countries around the world. Herman Daly, a former World Bank economist, described this scenario as 'uneconomic growth', where the costs of growth exceed the benefits (Daly, 2005). This occurs when the economy's expansion encroaches excessively on the surrounding ecosystem, sacrificing natural capital. Under such conditions the sacrificed natural capital is more valuable that the resulting economic growth. Consequently, the world faces large-scale threats to sustainability and especially to the viability and continued existence of the ecosystems that support human settlements (El Zein et al., 2014). In recognition of this sustainability imperative, mining companies are increasingly concerned with their ecological footprint (EF).
A number of tools are available for assessing the sustainability of an operation. While this paper does not present a comparative review of these tools (see Fang et al., 2013 for a comparison of footprint approaches), they can be briefly described as follows.
► The water footprint-first introduced by Hoekstra in 2002 (Hoekstra et al., 2011). This is a tool for assessing water use along supply chains and is a comprehensive indicator of the appropriation of freshwater resources
► Carbon footprinting-a method of assessing the magnitude of the emissions from activities based on methodology outlined in the Greenhouse Gas Protocol (WRI and WBCSD, 2004). Emissions to the atmosphere are converted to carbon dioxide equivalents (CO2e) to assess the total impact of the organization's activities. A clear description of the methodology is provided by Lotz and Brent (2014)
► Biodiversity footprint-this is a modified form of the ecological footprint that takes specific biodiversity impacts of direct land use and combines them with the specific biodiversity impact of CO2 emissions. A description of the methodology is presented by Hanafiah et al. (2012)
► Life-cycle assessment (LCA)-a tool for assessing environmental aspects and potential impacts associated with a product by compiling an inventory of inputs and outputs throughout a product's life cycle and evaluating the possible resulting impacts. ISO 14040 provides more detail on the approach
► Materials flow analysis (MFA)-a quantitative tool forassessing the flow of materials and energy through an economy. MFA assesses whether the flow of materials is sustainable in terms of the environmental impacts that result from it (see Xue et al., 2007).
Comprehensive national accounts based on the EF have been produced for several years (see WWF, 2014, for example). These accounts show how far from long-term sustainability a country is in a particular year. They are based on the EF and on the water footprint. Applying an ecological footprint assessment (EFA) is the first step in providing mining companies with a means of comparing their resource use efficiency with that of their host country - this is increasingly required in some countries, such as those of the Gulf Co-operation Council (GCC). Calculating a water footprint would be the second step. This paper discusses the EF of mining companies. EF is used as the primary indicator of sustainability, as it encompasses most of the materials and energy flows associated with mines (toxic pollutants being a notable exception) without requiring highly complex calculations that diminish the communication value of the resulting indicator. The EF is an easily understood metric as it is expressed in equivalent hectares of global average productivity.
Ecological Footprint Analysis (EFA) is a resource and emissions accounting tool designed to track the demand placed on the biosphere's regenerative capacity by a defined entity. An EFA contrasts the biologically productive area appropriated by the company with the capacity of the planet to provide ecosystem services (Galli et al., 2012). Originally developed as an indicator of environmental impacts of nations, individuals, or human populations, EFA is increasingly used as an indicator of organizational and corporate environmental performance and as an indicator of sustainability of products (Weidmann and Barrett, 2010). EFAs have been undertaken to produce a baseline of consumption and emissions for mining companies, assess possible measures to reduce the companies' footprint areas, and determine steps required to implement such measures.
Other benefits that can be derived from EFA include:
► Analysis of potential scenarios and determination of targets, as well as prediction of possible footprint reductions
► Assisting with corporate sustainable development (SD) and environmental strategy formulation
► Providing a snapshot in time to inform local community strategies
► Compilation of a baseline data-set from which future analyses can be performed
► Providing useful information for public awareness and education campaigns
► Inclusion of the company's EF into the performance management system as a key performance indicator (KPI).
SD challenges and mining companies
A challenge for all industrial entities (such as mines) is that footprint analysis is heavily influenced by materials and energy input and is therefore data-intensive. While a significant amount of data is available on publicly accessible databases, many companies may not have adequate physical accounting systems to provide the input required for an EFA. Typical site data inputs include water, fuel, and other forms of energy (e.g. grid electricity), reagents, materials, and human resources. Outputs include effluents, emissions, solid wastes, waste energy, product, economic benefits, and development.
The EF metric is not commonly reported by mining companies. This is partly due to the onerous data requirements and the subsequent disclosure of impacts. Because of the dominance of energy-related impacts in mining and processing, companies have tended to focus more on carbon footprinting. These observations notwithstanding, EFAs for mines can deliver the following benefits:
► A first-order measure of the operation's impacts on its environment
► An indication of how sites compare with each other
► Data for comparing a company's impact with other multi-commodity companies and other large companies operating in in the same or similar geographies.
The first step in an EFA is the compilation of baseline consumption and emissions data for a site. Once this has been done it is possible to assess improvement measures to reduce the footprint and to determine steps required to implement these measures.
EFA
To determine the area of the EF for a given entity, land requirements for all categories of consumption and waste discharge must be summed. This land is made up of only the ecologically productive land and water in various classes (cropland, pasture, forests etc.) that would be required on an ongoing basis to provide all energy and material resources consumed and absorb the wastes discharged. This land is used exclusively by the given population and is not available for use by others. A complete analysis must include the direct land requirements and the indirect effects on the economy (consumption). Non-renewable energy is accounted for as processing energy and use-related pollution effects (Wackernagel and Rees, 1996).
Wackernagel and Rees (1996) originally divided the demand into several categories of consumption:
► Energy land (fossil energy consumption)
► Consumed land (the built environment)
► Farm land (food producing land)
► Forest land (forest products).
A marine/freshwater category has subsequently been added to include the appropriation of biological production from oceans and freshwater bodies.
The abstraction of water for human use compromises other possible uses of this water (such as ecological processes). Additionally, appropriation of land surface may reduce water volume and quality by degrading the land required to collect water for fluvial systems. Footprinting was first applied in Europe and North America, where water scarcity is not as critical as in Africa or the Middle East. Consequently, footprinting dealt only with water abstraction and consumption by considering the energy required to pump and treat the water. In this paper the concept of the 'shadow footprint' of water (Chambers et al., 2004) has been included to provide a weighting of water consumption more appropriate to hyper-arid environments such as those found in North Africa and the Middle East. It is acknowledged that a water footprint, using the water footprinting method (Hoekstra et al., 2011), should be calculated as a subsequent step in the sustainability assessment of a mine. The shadow footprint is used as a first-order indicator in this assessment and reflects the reality of limited time and resources available for mining assessments in today's economic climate.
To assess an EF, the biologically productive area appropriated by an entity is contrasted with the capacity of the planet to provide ecosystem services (Galli et al., 2012). The biocapacity of the land in question is a key concept in EFA. It is 'a measure of the amount of biologically productive land and sea area available to provide the ecosystem services that humanity consumes This is nature's regenerative capacity (Borucke et al., 2013, p. 4). Footprinting assumes that the regenerative capacity of the planet is a key limiting factor to the human economy under current development trajectories.
A crucial difference between EFA and other ways of assessing overall impact is that the footprint and related biocapacity are resource flow measures expressed in units of area required to support the demand of the activities assessed. As biological productivity varies between land types and uses in different countries, footprint and biocapacity values are expressed in units of world average bioproductive area: global hectares1 (gha) (Galli et al., 2012). Two scaling factors - equivalence factors and yield factors -are required to convert results to facilitate comparison between areas.
► The EOF (equivalence factor) is measured in gha/ha. Equivalence factors represent the average potential productivity of any given bioproductive area relative the world average potential productivity of all productive areas (RPA, 2005). EOF captures the productivity differences between different land use categories. EOFs are constant for all countries for a given year (Monfreda et al., 2004)
► The yield factor (YF) is measured in t/ha/a (for fisheries, pastures, and crops) and in m3/ha/a for timber. Yield factors capture the difference between local and global average productivity within a given land use category. YFs are specific for each country and year (Monfreda et al., 2004).
Using the factors above, the following relationship can be established between physical hectares and global hectares (gha):
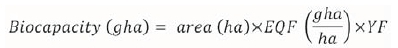
Biocapacity is therefore a function of the area of crop land, grazing land, fishing grounds, and forest located within a defined area and the associated productivity of that land/water (WWF, 2002). It gives the entire productive area exclusive to a nation, or organization, and shows the maximum theoretical rate of resource supply that can be sustained assuming current technology and management practices (Monfreda et al., 2004). Use of global hectares allows for the summing of the EF and biocapacity values across different land use types into a single measure of consumption-focused applications within a global context (Borucke et al., 2013). This measure furthermore allows benchmarking of performance between individuals, companies, or nations.
There are two fundamental approaches to footprinting: the compound approach and the component approach. The former is commonly used in assessing national footprint accounts and the latter is used to assess sub-national populations, such as cities and regions. The compound approach is a bottom-up approach that constructs a footprint from site-specific consumption data rather than national-level trade data. Consequently, the compound approach is appropriate for the assessment of an industrial site. This said, it is important to be able to contextualize the footprint of a site or a company within the larger footprint of a nation or regional grouping of countries. Using the EFA as a business strategy in isolation from a country strategy and global context (using the same methodology and measuring unit - gha) will provide very little motivation for adoption by business leaders.
Land types
Energy land
In the original footprinting concept, energy land was the area of land required to sequester the CO2 emitted from burning fossil fuel and did not include other greenhouse gas (GHG) emissions. Average-age forests accumulate 1.8 t of carbon per hectare per annum - i.e. one hectare of average forest can annually sequester 1.8 t of carbon. As this is equivalent to the CO2 emissions generated by 100 GJ of global average fossil fuel combustion (Wackernagel and Rees, 1996), one hectare of forest is required per 100 GJ of installed power generation capacity per annum (1 ha/100 GJ/a). This is the land to energy ratio for fossil fuel that has been applied in historical EFAs. In the approach advocated here, all gases considered to have greenhouse warming potential (GWP) under the Kyoto Protocol are included as carbon dioxide equivalents (CO2e). The land required to assimilate the total CO2e mass emitted is therefore used in the calculation of carbon land areas - carbon land being a refinement of the original energy land concept. Gases emitted by industrial processes additional to the generation of energy are also included (e.g. blasting emissions and refrigerants). This departure from the original EFA approach was required as energy land is the largest component of most ecological footprint assessments undertaken for mines and other large industrial complexes.
As CO2 is absorbed by the oceans, the final energy land area calculated must be factored by an absorption value. The sequestration rate is calculated by subtracting one-third of anthropogenic emissions (absorbed by the oceans) from total anthropogenic emissions (Monfreda et al., 2004):

Built or consumed land
This land class includes all land that is excavated, paved over, built upon, badly eroded, or degraded, and is considered 'consumed'. Here, this is the land area that is physically occupied by mine infrastructure and that occupied by roads and other transport infrastructure directly linked to the company. To keep calculations simple, roads leading directly to the site can been assigned in their entirety to the site's footprint. The usual approach is to undertake a traffic assessment and to allocate the entire footprint of the transport network to the site according to the proportion of total traffic arising from the site. This process is dataintensive.
Once the site infrastructure areas and the allocated transport corridor area have been summed, the total is multiplied by the YF for productive land in the country in question.
Food land
Production of food is dependent on substantial resources and thus has large environmental impacts (Collins and Fairchild, 2007). The surface area required to produce the food consumed on a mine site is composed of crop land, grazing land, and 'fisheries area'. These areas are determined by applying global average areas required for the production of a unit mass of each identified food type and then summing the results. Food land is not commonly considered in analyses of mining impacts. This is despite the significant impact of agricultural production due to its expansion at the expense of forests, grasslands, and ecozones: over the last 300 years, global crop land has increased by four orders of magnitude and pasture land by five (Khan and Hanjira, 2009). While food land areas are likely to be negligible at a site level, they become significant at national level and have important implications for sustainability.
Forest land
Paper use at a mine site is estimated and converted into equivalent wood volumes using a ratio of 1.8 t wood per ton of paper (Wackernagel and Rees, 1996). Average forest productivity is set at 2.3 m3 of useable wood fibre per hectare per annum (Wackernagel and Rees, 1996). Mine sites commonly track paper consumption closely, but are less able to quantify consumption of timber used in packing crates and other non-mining support related uses.
Water land
To calculate a 'shadow footprint' of water for a site, the internal, annually renewable water resources (in km3) of the country in question are divided by the surface area of the country. This generates a value in hectares per unit volume per year (Chambers et al., 2004). Applying this area factor to the volume of total water (groundwater, surface water, utility water, and bottled water) produces a shadow water footprint in hectares. As these are the local hectares required to generate a standard volume of water, they have been corrected for local conditions and can therefore be added to the global hectares calculated for other footprint components.
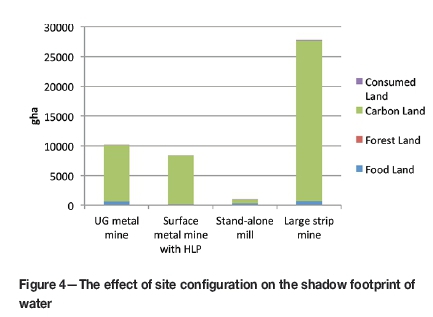
Typical results from mines and plants
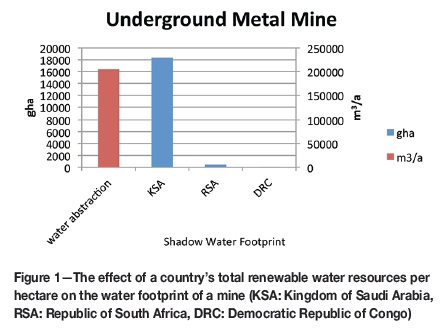
The ecological footprint associated with a specific operation is dependent on the commodity produced, the mining and processing methods employed, and the ecological setting of the mine. For example, a mechanized underground metal mine with an onsite processing plant (mill) and mine village for 300 people, powered by a mix of grid electricity and diesel power, processing around 200 000 t of ore annually and located in a hyper-arid zone such as the Namib Desert could have footprint components as follows:
► Food land: 2-2.2% of footprint
► Forest land: 0.1-0.2%
► Carbon land: 33-44% (more if grid power is sourced from fossil fuels, less if diesel gensets are used)
► Consumed land: 0.05%
► Shadow footprint of water: 50-65% in an arid climate.
For a mine consuming 200 000 m3 of water annually, the shadow footprint of water could be between 10 000 and 20 000 ha in an arid desert environment (like Namibia or the Kingdom of Saudi Arabia), around 300-500 ha in a dry temperate country like South Africa, and less than 20-50 ha in a high-rainfall equatorial country like the Democratic Republic of Congo (DRC) (country areas from World Bank, 2015; total renewable water yield from CIA World Fact Book, 2015). Figure 1 shows how sensitive the indicator is to the environmental capacity of the local setting.
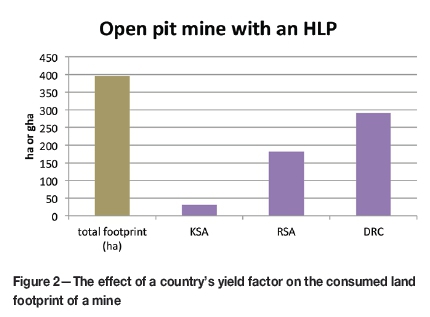
Similarly, the consumed land footprint is sensitive to the average productivity of the setting. For example, consider an open pit mine with a heap leach pad, a disturbed site area of around 300 ha, and a transport infrastructure area of 90 ha. The breakdown of the EF could look something like this:
► Food land: 0.3% of footprint
► Forest land: 0.003%
► Carbon land: 16% (gensets used)
► Consumed land: 0.07%
► Shadow footprint of water: 84% in an arid climate.
In a desert setting with a yield factor (YF) of 0.0796, the total loss of globally equivalent productive land associated with this mine would be around 32 gha. If the same mine was located in South Africa with a YF of 0.4598, the mine would consume the equivalent of 182 gha. In the DRC, where the YF is 0.7359, the mine would consume 291 gha. This is shown in Figure 2.
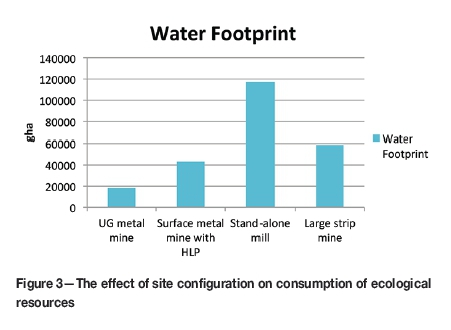
Different types of operations in the same environmental setting will consume ecological resources in different ratios. A standalone gold mill could have a footprint as follows:
► Food land: 0.81%
► Forest land: 0.00% (only paper considered)
► Carbon land: 1.27% (grid power with diesel for mobile plant)
► Consumed land: 0.04%
► Shadow footprint of water: 97.87% in an arid climate (<100 mm mean annual precipitation).
A large strip mine could have a footprint breakdown:
► Food land: 0.80% of footprint (mine village present)
► Forest land: 0.01% (only paper consumption)
► Carbon land: 31.17% (diesel gensets and mobile plant)
► Consumed land: 0.07%
► Shadow footprint of water: 67.95% in an arid climate (<100 mm mean annual precipitation).
Challenges and shortfalls
EFA provides the potential for policy-makers to prioritize their actions in a more informed and integrated way. In Cardiff, for example, EFA provided the city with a benchmark against which future footprints could be compared to track performance. It was also a way for the city to demonstrate that it was taking concrete action to implement SD (Collins and Fairchild, 2007). Despite these benefits, EFA has been criticized for neither accurately reflecting the impacts of human consumption nor allocating the responsibilities of impact correctly (Collins and Fairchild, 2007). Consequently, there is confusion about how different consumer activities relate to the impact, and so EFA does not provide decision-makers with a useful policy-making tool.
EFA as a standalone approach has also been criticized for not being capable of identifying, with certainty, how far an entity is from sustainability. This arises due to the restricted scope of EFA, differences in methodology (for example, using a compound or a component approach, limiting EFA to the 'energy land' concept, or expanding it to include carbon land), and concern around the accuracy of calculating biocapacity (RPA, 2005). EFA can, however, be used in conjunction with other measures, such as the water footprint, to provide an assessment of sustainability.
A serious shortfall from a mining perspective is the inability of the current methodology to adequately deal with toxic waste discharges. This is due mainly to the lack of reliable data describing how pollutants impact on bioproductivity (Rees, 2000, in RPA, 2005)2. EFA proponents state that society should not tolerate highly toxic wastes and radioactive substances for which there is no assimilative capacity in the environment. Such substances should be banned, phased out, or dealt with in closed circuits. Thus, EFA is not a standalone panacea for measuring mining environmental impacts and should be used as part of set of tools for environmental management.
Conclusion
Despite several shortcomings, EFA provides valuable insights into the long-term ecological sustainability of industrial systems such as mines and processing plants. EFA can be conducted at both macro- and micro-scales and is useful in linking impacts at site level to those at the scale of a nationstate. However, using EFA as a business strategy in isolation from a country strategy and global context provides limited value to business leaders.
Although it is more convenient for business to use one aggregate number (measured in global hectares) to monitor ecological performance, it is challenging for business leaders to interpret this metric and embed it in business evaluation strategies. Given the increasingly high stakes and risk of catastrophic ecological collapse, it is incumbent on business to work through these challenges to ensure that operations, especially in the extractive sector, can be optimized to deliver the greatest development dividend at the lowest ecological cost.
References
Borucke, M.D. Moore, G. Cranston, K. Gracey, K. Iha, J. Larson, E. Lazarus, J.C. Morales, M. Wackernagel, M., and Galli, A. 2013. Accounting for demand and supply of the biosphere's regenerative capacity: The National Footprint Accounts' underlying methodology and framework. Ecological Indicators, vol. 24. pp. 218-533. [ Links ]
Chambers, N., Simmons, C., and Wackernagel, 2004. Sharing Nature's Interest - Ecological Footprints as an Indicator of Sustainability. Earthscan Publications, uK. 185 pp. [ Links ]
CIA. 2015. World Factbook. Total renewable water yield per country, https://www.cia.gov/library/publications/the-world-factbook/fields/2201.html [Accessed January 2015]. [ Links ]
Collins, A. and Fairchild, R. 2007. Sustainable food consumption at subnational level: an ecological footprint, nutritional and economic analysis. Journal of Environmental Policy and Planning, vol. 9, no. 1. pp 5-30. [ Links ]
Daly, H.E. 2005. Economics in a full world. Scientific American, September 2005. pp 100-107 [ Links ]
De Sherbinin, A., Carr, D., Cassels, S., and Jiang, L. 2007. Population and environment, http://www.ncbi.nlm.nih.gov/pmc/articles/PMC2792934/ [Accessed December 2013]. [ Links ]
El Zein, A., Jabbour, S., Tekce, B., Zurayk, H., Nuwayhid, I., Khawaja, M., Tell, T., Al Mooji, Y., de Jong, J., Yassin, N., and Hogan, D. 2014. Health and ecological sustainability in the Arab World: a matter of survival. Lancet, vol. 383. pp. 458-476. [ Links ]
Fang, K., Heijungs, R., and de Snoo, G.R. 2013. Theoretical exploration for the combination of the ecological, energy, carbon and water footprints: overview of a footprint family. Ecological Indicators, vol. 36. pp. 508-518 [ Links ]
Galli, A., Wiedmann, T., Ercin, E., Knoblauch, D., Ewing, B., and Giljum, S. 2012. Integrating ecological carbon and water footprint into a 'Footprint Family' of indicators: definition and role in tracking human pressure on the planet. Ecological Indicators, vol. 16. pp. 100-112. [ Links ]
Hanafiah, M.M., Hendriks, J.A., and Huijbregts, M.A.J. 2012. Comparing the ecological footprint with the biodiversity footprint of products. Journal of Cleaner Production, vol. 37. pp. 107-114. [ Links ]
Hoekstra, A.Y., Chapagain, A.K., Aldaya, M.M., and Mekonnen, M. M. 2011. The Water Footprint Assessment Manual - Setting the Global Standard. Earthscan, London. 228 pp. [ Links ]
Khan, S. and Hanjira, M.A. 2009. Footprints of water and energy inputs in foo production - global perspectives. Food Policy, vol. 34. pp. 130-140 [ Links ]
Lotz, M. and Brent, A. 2014. Nedbank's Carbon Footprinting Guide - a practical footprinting calculation guide focussing on measuring, monitoring, reporting and verification. 1st edn. Nedbank Ltd. 100 pp. [ Links ]
Monfreda, C., Wackernagel, M., and Deumling, D. 2004. Establishing national natural capital accounts based on detailed Ecological Footprint and biological capacity assessments. Land Use Policy, vol. 21. pp. 231-246. [ Links ]
RPA. 2005. Sustainable consumption and production - development of an evidence base; study of ecological footprinting. Final Report prepared for DEFRA. 134 pp. [ Links ]
Wackernagel, M. and Rees, W. 1996. Our Ecological Footprint: Reducing Human Impact on the Earth. The New Catalyst Bioregional Series, New Society Publishers, Gabriola Island, BC, Canada. 160 pp. [ Links ]
Weidmann, T. and Barrett, J. 2010. A review of the Ecological Footprint indicator - perceptions and methods. Sustainability, vol. 2. pp. 1645-1693. [ Links ]
WRI and WBCSD (World Resources Institute and World Business Council for Sustainable Development). 2004. The Greenhouse Gas Protocol - A Corporate Accounting and Reporting Standard. Revised edition, USA. 116 pp. [ Links ]
WWF. 2002. Living Planet Report 2002. World Wide Fund for Nature, Gland, Switzerland. 39 pp. [ Links ]
WWF. 2014. Living Planet Report 2014 - Species and Spaces, People and Places. World Wide Fund for Nature, Gland, Switzerland. 180 pp. [ Links ]
World Bank. 2015. Country areas. http://data.worldbank.org/indicator/AG.SRF.TOTL.K2 [Accessed January 2015]. [ Links ]
Xue, H., Kumar, V., and Sutherland, J.W. 2007. Material flows and environmental impacts of manufacturing systems via aggregated input-output models. Journal of Cleaner Production, vol. 15. 1349-1358. [ Links ]
This paper was first presented at the Mining, Environment and Society Conference ‘Beyond sustainability - Building resilience’, 12-13 May 2015, Mintek, Randburg, South Africa.
1 A global hectare represents a standard amount of biological productivity (Monfreda et al, 2004).
2 EF requires wastes to be amenable to biological assimilation. Some work has been done on heavy metals and PCBs (see RPA, 2005) but fundamentally, the EF cannot deal with this due to the fundamental assumption that toxic and non-biodegradable wastes should not be discharged to the environment.

