


Services on Demand
Article
 English (pdf)
 Article in xml format
 Article references
Indicators

Related links
-
 Cited by Google
 -
 Similars in Google
Share

 Permalink
Journal of the Southern African Institute of Mining and Metallurgy
On-line version ISSN 2411-9717
Print version ISSN 2225-6253
J. S. Afr. Inst. Min. Metall. vol.116 n.12 Johannesburg Dec. 2016
http://dx.doi.org/10.17159/2411-9717/2016/v116n12a14
GENERAL PAPERS
A three-tier method of stability evaluation for coal mines in the Witbank and Highveld coalfields
J.N. van der Merwe
Visiting Professor, School of Mining Engineering, University of the Witwatersrand, Johannesburg, South Africa
SYNOPSIS
The probability of survival of coal pillars is a more rational indicator of stability than the safety factor. Over time, pillars undergo reduction in size by progressive scaling of the sidewalls. The probability of survival is therefore not constant but reduces over time. The rate of scaling can be quantified, and the reduction of the probability of survival as a function of time can therefore also be quantified. The paper describes the link between the factor of safety, probability of survival, and reduction of the probability of survival. Using the safety factor, probability of survival, and the time at which the probability of survival will reduce to 50% is proposed as a more rational method of evaluating pillar stability than the safety factor alone.
Keywords: pillar stability, probability of failure, time-related decay, safety factor.
Introduction
Coal pillar strength has long been the subject of research in South Africa and several other coal-producing countries. However, it began receiving serious attention only after the Coalbrook disaster in 1960. The most important outcomes of the initial investigations were the groundbreaking research by Salamon and Munro (1967) that resulted in the well-known power formula for pillar strength, and the work by Bieniawski (1969) that resulted in a linear formula for strength. The former approach was based on empirical back-analysis of failed and stable pillar cases, and the latter on in situ strength tests on large specimens.
The Salamon and Munro (1967) formula has been widely used in South Africa and even adapted for application to hard rock pillars by researchers such as Hedley and Grant (1972).
At the time of the initial work by Salamon and Munro, there were only 27 failed pillar cases suitable for analysis. It was not possible at the time to determine site- or seam-specific strength, and the result was a general formula for use in all seams in all mining districts. Since that time pillars have continued to fail and the database continued to grow - as of 2013, there were 85 cases in the database. Using the additional data, there have been a number of re-evaluations of the strength formula and it has also become possible to differentiate between the different mining seams and areas.
The strength formula is used in conjunction with reasonable estimates of the pillar load to arrive at a safety factor. There are norms in place for safety factors for different purposes, such as short-term coal production panels, longer term main development, protection of overlying surface structures, etc. However, these norms are based on subjective judgement and the measure of stability cannot be quantified. Pillars with higher safety factors are logically 'more stable' than those with lower safety factors, but 'how much more' cannot be determined.
The solution to this dilemma is to base design not on a safety factor, but on a probability of failure. The original Salamon and Munro (1967) work did give an indication of the expected probability of having a stable layout for any given safety factor, but as that was based on the characteristics of the database of failed pillars only, it was not strictly correct. This has been rectified by later work (van der Merwe and Mathey, 2013a) in which the probability of failure was determined based on a comparison of the number of failed cases to stable ones on a safety factor by safety factor basis.
All the empirical work making use of databases of failed pillars has the same fundamental flaw: it is based on the as-mined dimensions of pillars (sometimes even the planned dimensions) and ignores the fact that pillars are known to scale over time. Consequently, the pillar dimensions at the time of failure cannot be the same as they were at the time of mining, and the safety factors will also not be the same. It can be argued that the stable pillars also undergo sidewall scaling and consequently there is some measure of compensation, but this argument loses validity as the comparisons between failed and stable cases are made at a certain point in time when the pillars have different ages and have therefore scaled to different extents.
It is thus clear that the time effects also have to be considered in the evaluation of stability. While this has been done for at least one coal-mining district (van der Merwe, 2003a, 2016), no integrated method to evaluate pillar stability incorporating the safety factor, probability of failure, and time effects has been developed to date. This paper sets out to provide such a method and also to provide guidance on the interpretation of the three norms.
Pillar strength and safety factor
According to Salamon and Munro (1967) the generic formula for pillar strength, σs, is

where
k = constant related to material strength
w = pillar width
h = pillar height.
The pillar load, σL, is commonly estimated by the tributary area theory, which implies that each pillar is responsible for supporting its full share of the overburden load, or

where C is the pillar centre distance and H is the depth of mining.
The safety factor is then simply the ratio of pillar strength to load.
For rectangular pillars, it is common practice to adapt w in Equation [1] to wefollowing the suggestion of Wagner (1980 ):

Where pillars were mined by continuous miner, for calculation purposes the pillar width is often artificially increased by up to 0.5 m to allow for the fact that no blast damage occurred in those pillars.
Following the initial work by Salamon and Munro (1967) the database of failed pillars continued to expand as new pillar failures occurred. From time to time the pillar strength was re-evaluated using the more reliable databases.
Historical overview
Table I summarizes the important evaluations that were performed at different stages. All parameters except those of the 1969 formula by Bieniawski were derived empirically.
The first important observation from the table is that there is continued growth of the database of failed pillars. This is expected, as all pillars continue to scale and therefore approach the point of failure. It is also important to note that of the 85 cases in the 2013 database, 25 (29%) were mined after the implementation of the Salamon and Munro (1967) strength formula.
There is also a tendency for the material strength constant k to decrease as the values of α and β continue to increase. The value of periodic review is shown by the differences in the 'constants' that were derived over time.
Latest work
The latest revision was performed by van der Merwe and Mathey (2013a). Since it had long been accepted that there are significant differences between the coal strengths in different areas and/or coal seams - see for instance Salamon, Canbulat, and Ryder (2006) and van der Merwe (1993) - this work was done for the Witbank No. 2 and 4 seams and the Highveld seams only. As of 2013 the vast majority of national coal production was from the Witbank coalfield and there was sufficient data available to perform the analyses.
Salamon and Munro (1967) used the maximum likelihood method for their work. The method is based on the assumption that pillars in the database of failed pillars failed at a safety factor of 1.0 and that intact pillars had safety factors in excess of 1.0. The procedure then results in estimates of the parameters k, a, and β that come closest to satisfying those conditions.
Van der Merwe (2003a) used an alternative statistical approach, called the overlap reduction method. It is based on the argument that the perfect formula would result in total separation of the distributions of safety factors in the failed and stable databases. If perfection cannot be achieved, the best available formula would be the one that reduces the overlap of the distributions to a minimum. The process then finds the combination of k, a, and β that results in the smallest overlap between the distributions.
Van der Merwe and Mathey (2013a) used both methods. The outcome was contradictory at first glance as the two methods resulted in different strength formulae, given as:
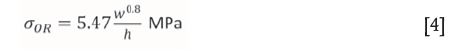
and

where the subscripts OR and ML refer to the overlap reduction and maximum likelihood methods respectively. Figure 1 shows a comparison of safety factors obtained with the two strength formulae for different pillar widths at constant pillar height. Note that the commonly used comparison based on strength vs width-to-height is not followed here, as the width-to-height relationship using formulae with different exponents for w and h is ambiguous.

It is seen that for the stated range, and especially in the practical range where the width-to-height ratio is greater than 2.0, the overlap reduction method results in higher strength. The apparent contradiction is cleared up when the strength formulae are evaluated against the background of the probability of failure, described in the following sections.
Probability of survival
Probability of survival and safety factor
The original work by Salamon and Munro (1967) hinted at design based on probability of failure and included a table expressing the probability of having a stable layout as a function of the safety factor. However, the table was essentially based on the frequency distribution of the database of failed pillars, and did not take cognisance of the existence of stable pillars at comparative safety factors.
Van der Merwe and Mathey (2013b) followed a different approach. They first extended the sample database of stable pillars from the 98 used by Salamon and Munro to a total of 337 cases by inspection of mine plans. This was then further extended to replicate the full population, based on historical coal production data.
Safety factors using Equations [4] and [5] were calculated for the databases of failed and stable cases. The numbers of failed cases to stable ones on a safety factor by safety factor basis were then determined for each of the two strength formulae, resulting in the probability of failure. It was found that different formulae were again obtained from the different approaches to strength determination. The following relationships between the probabilities of survival (i.e. 100 - probability of failure %) and safety factors were derived by the authors:

and

where
POSOR= Probability of survival using the overlap reduction method to determine strength
POSML= Probability of survival using the maximum likelihood method to determine strength
SFor = Safety factor using the overlap reduction method to determine strength
SFML= Safety factor using the maximum likelihood method to determine strength.
The two equations are compared graphically in Figure 2 for the safety factor range of 1.0 to 1.8.

It is seen that the probability of survival using the overlap reduction method tends to be lower than that obtained by the maximum likelihood method. Therefore, while the overlap reduction method results in higher strength (and thus higher safety factors), it also results in lower probabilities of survival, which compensates for the higher strength as compared to the maximum likelihood method.
Probability of survival and pillar size
In reality, the link between probability of survival and safety factor is less important than the link between actual pillar size and probability of survival. The final outcome of a pillar design is a physical pillar size, to which different magnitudes of safety factor can be attached depending on which method is used to determine pillar strength. However, the probability of survival would be expected to be similar for a given pillar size, irrespective of the method used to determine it.
To illustrate the point, Figure 3 shows a comparison of the probabilities of survival for given pillar sizes, determined using Equations [6] and [7]. For the comparison, a mining height of 3 m was used with 6 m wide bords and mining depth of 100 m.

Now it is seen that the probabilities of survival are largely similar and can be considered as the same for practical design purposes. The differences in strength noted previously are therefore not important, as the probability of survival for a given pillar size is the same, irrespective of which route was followed to determine strength and probability of survival.
Application of design method
It now follows that the desired design sequence should be as follows.
► The first step should be to decide on a desired probability of survival given the circumstances (i.e. production panel, longer term main development, surface structures requiring protection, etc.)
► The probability of survival (POS) is transformed to a probability of failure (POF), simply by
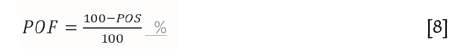
► The corresponding safety factor is determined using a transformation of either Equation [6] or [7]. For overlap reduction, use the transformed Equation [6]:

For maximum likelihood, use the transformed Equation [7]:

► The final step is to find the required pillar width, w, by a process of iteration and using either Equation [4] or [5] for the pillar strength, depending on which method was used to calculate the probability of survival. For ease of use, the respective equations for safety factor in a single step are given as:
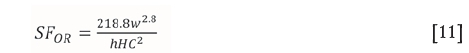
The pillar width is still determined by iteration from the safety factor equation, the main difference being that now the safety factor is merely an interim step to link the required probability of stability - the core of the process - and the pillar width. It is very important to note that the equations for probability of failure are not generic but are linked to specific methods used to determine pillar strength.

Suggested norms
The acceptable limits of probabilities of failure for various categories of protection should be determined by agreement between the various stakeholders. Table II contains suggestions to serve as a starting point for discussion, and is not intended as prescriptive.
Limitations
The design procedure outlined in previous paragraphs relies primarily on data relating to pillar failures. The database of failed pillars is not static. In the current database, 71% of the cases were mined before the original database was created for the Salamon and Munro (1967) analysis. It is quite possible for cases that were included in the database of stable pillars to have failed later, and now appear in the database of failed cases. This is clear indication of the effects of time on the analysis; as the analysis is based on as-mined dimensions, it does not take into account the fact that pillars scale and could be prone to collapse at a later date at a lower actual safety factor. Clearly then, time effects have to be taken into consideration.
Effects of time on pillar stability
There have been attempts in the past to determine the time at which pillars could be expected to fail, such as that by van der Merwe (2003b). As that analysis was based on the database of 2003 it is no longer considered to be entirely suitable. The work was updated by van der Merwe (2016), making use of the latest version of pillar strength determination by van der Merwe and Mathey (2013a).
The method that was used for the analysis was based on the observation that pillars are prone to sidewall scaling. As time passes, they therefore reduce in size and eventually may reach the point of failure. If the safety factor at which failure can be expected was known, it would be possible to backanalyse the cases of known failure and then determine the rate of scaling.
Pillar dimensions at the time of failure cannot be measured directly because it is simply not possible to know with certainty which pillars are at the point of failure, and there is an obvious danger in entering such areas for the purpose of measurement, even if the areas were known. Indirect methods therefore have to be used.
The amounts of sidewall scaling on pillars that had not yet failed had previously been measured (van der Merwe, 2004), and from that data a rate of sidewall scaling was determined. That rate was then applied to the database of failed pillars for which the lifespans were known in the Witbank No. 1, 2, and 4 seams as well as the Highveld seams. The safety factors based on the estimated new pillar dimensions at the time of failure were then calculated using Equation [4] for pillar strength.
Due to factors such as the variability of the coal strength and dimensions of pillars in a panel, the databases of failed pillars invariably exhibit distributions of safety factors. The median safety factor of this database was found to be 0.53. It is also seen that according to Equation [9], the safety factor at which the probability of failure is 50% is 0.49. It was then thought reasonable to base the further analysis on the assumption that the limiting safety factor should be 0.5, as explained in detail in van der Merwe (2016). Note that for this purpose, the strength obtained by using the overlap reduction method was preferred, because that method is not based on any assumptions regarding the safety factors of pillars in the database of failed cases.
The final step was to determine the rate of sidewall scaling by back-analysis of the cases of failed pillars, by determining what rate would result in a safety factor of 0.5 at the known time of failure. It was found that the rate of sidewall scaling reduces with time (i.e. the highest rate of scaling occurs immediately after mining) and that it is indirectly proportional to the mining height (i.e. taller pillars scale faster than shorter ones).
According to van der Merwe (2016), the rate of sidewall scaling, R, at any given point in time is:

where
T = time lapse in years since creation of the pillar
m = constant = 0.1799
x = constant = 0.7549.
The critical distance of sidewall scaling, dc, that has to occur for a pillar to have a safety factor of 0.5 is

The expected lifespan of a pillar, Te, is then

From the description in this section it should be clear that Equation [15] is based on indirect measurement and is subject to the inherent imperfections and uncertainties in the databases. As such, it cannot be expected to provide accurate estimates of pillar lifespans, say to 10 or 15 years' accuracy. For that reason the term 'pillar life index' (PLI) is preferred.
Interpretation and use of pillar life index (PLI) and probability of survival (POS)
The concept of probability of failure was used in the derivation of PLI. Therefore, it does not predict the time of failure in absolute terms, but rather the time at which the probability of survival reaches a value of 50%. It forms the link between the safety factor and probability of failure at any time in the future and importantly, can be used to trace the progression of probability of survival over time.
This is easily done by determining the amount of sidewall scaling at any given point in time, dT, by multiplying Equation [13] by T to obtain

The pillar width at that time, wT, is then

Equation [11] can now be used to determine the safety factor by substituting w by wTand the probability of survival is then given by Equation [7].
Figure 4 is an illustrative example of the use of the process. It compares the decay in the probability of survival over a 100-year period for four cases, with initial POS values of respectively 99%, 99.5%, 99.9%, and 99.995%.

The more rapid decay in the POS of the case with initial POS of 99% (say a short-term production panel) as compared to that for the case with initial POS of 99.995% (say with a sensitive structure on surface) is immediately apparent. After 100 years, the former POS has decreased to 87.5% while the latter is still very high at 99.6%. It can be shown that in this case, the POS will still be greater than 98% after 500 years.
The specific numbers in the example are not generic; they will vary according to the conditions of mining height, depth, etc. The general rule, however, is valid: cases with a high initial POS will decay slower than those with lower initial POS. This procedure opens the door to a more rational basis for pillar design.
It is now possible to set more rational norms for pillar stability, based on the dynamic nature of stability. From the moment a pillar is created, its probability of survival decreases. This can be quantified.
For example, the requirement can now be set that shortterm production panels should have a POS of 99% immediately, and that the POS should still be in excess of 80% at the expected end of life of the mine. Where there are surface structures requiring protection, the norm can be that the immediate POS should be greater than 99.995%, and that it should still be greater than 98% in 500 years' time.
Conclusions
It has been demonstrated that the size of the database of failed pillars, which is central to all empirical methods for determination of pillar strength, increases over time. The increase in the number of pillar failures over time is explained by the process of failure, which is due to progressive scaling of pillars.
The probability of survival (POS) of pillars is a more rational approach to pillar design, as the additional stability that comes at the expense of coal resources can be quantified. The probability of survival can be determined.
The rate of scaling, primarily a function of time and pillar height, can also be determined. It is therefore possible to predict the time at which the POS will be at 50%. It is also possible to determine the decay of POS over time. This opens a new way of evaluating pillar stability.
Requirements can now be set for an immediate POS of a pillar system, coupled to a required POS at any time in the future. The point in time at which the final probability of stability requirement is set can vary from the end of life of the mine in the case of production panels to hundreds of years in the future where surface structures require protection.
These procedures can also be used to evaluate long-term surface stability of pillar-mined areas for the purposes of mine closure and future land use.
The probability of survival, safety factor, and predicted time at which the pillar system's probability of survival will be at 50% are integrated and should be used together to evaluate pillar stability, especially where longer term stability is required.
References
Bieniawski, Z.T. 1969. In situ large scale testing of coal. In Situ Investigation in Soils and Rocks. British Geotechnical Society, London. 1969. [ Links ]
Hedley, D.G.F. and Grant, F. 1972. Stope pillar design for the Elliot Lake uranium mines. Bulletin of the Canadian Institute of Mining and Metallurgy, vol. 65. pp. 37-44. [ Links ]
Madden, B.J. 1990. An investigation into the factors affecting the strength of pillars in South African coal mines. PhD thesis, University of the Witwatersrand, Johannesburg. [ Links ]
Salamon, M.D.G., Canbulat, I., and Ryder, J.A. 2006. Final Report: Task 2.16 Development of seam-specific strength formulae for South African collieries. Coaltech, Johannesburg. [ Links ]
Salamon, M.D.G. and Munro, A.H. 1967. A study of the strength of coal pillars. Journal of the South African Institute of Mining and Metallurgy, September 1967. pp. 56-67. [ Links ]
Salamon, M.D.G., Galvin, J.M., Hocking, G., and Anderson, I. 1996. Coal pillar strength from back calculation. Research Report 1/96. School of Mining Engineering, University of New South Wales. [ Links ]
Van der Merwe, J.N. 1993. Revised strength factor for coal in the Vaal Basin. Journal of the South African Institute of Mining and Metallurgy, vol. 93, no. 3. pp. 71-77. [ Links ]
Van der Merwe, J.N. 2003a. A new coal pillar strength formula for South Africa. Journal of the South African Institute of Mining and Metallurgy, vol. 103, no. 5. pp. 281-292. [ Links ]
Van der Merwe, J.N. 2003b. Predicting coal pillar life in South Africa. Journal of the South African Institute of Mining and Metallurgy, vol. 103, no. 5. pp. 293-301. [ Links ]
Van der Merwe, J.N. 2004. Verification of pillar life prediction method. Journal of the South African Institute of Mining and Metallurgy, vol. 104, no. 11. pp. 667-675. [ Links ]
Van der Merwe, J.N. 2016. Review of coal pillar lifespan prediction for the Witbank and Highveld coal seams. Journal of the Southern African Institute of Mining and Metallurgy, vol. 116, no. 11. pp. 1083-1090. [ Links ]
Van der Merwe, J.N. and Mathey, M. 2013a Update of coal pillar strength formulae for South African coal using two methods of analysis. Journal of the Southern African Institute of Mining and Metallurgy, vol. 113, no. 11. pp. 841-847. [ Links ]
Van der Merwe, J.N. and Mathey, M. 2013b. Probability of failure of South African coal pillars. Journal of the Southern African Institute of Mining and Metallurgy, vol. 113, no. 11. pp. 849-857. [ Links ]
Wagner, H. 1980. Pillar design in coal mines. Journal of the South African Institute of Mining and Metallurgy, January 1980. pp. 37-45. [ Links ]
Paper received Jun. 2015
Revised paper received Sep. 2016

