


Services on Demand
Article
 English (pdf)
 Article in xml format
 Article references
Indicators

Related links
-
 Cited by Google
 -
 Similars in Google
Share

 Permalink
Journal of the Southern African Institute of Mining and Metallurgy
On-line version ISSN 2411-9717
Print version ISSN 2225-6253
J. S. Afr. Inst. Min. Metall. vol.116 n.12 Johannesburg Dec. 2016
http://dx.doi.org/10.17159/2411-9717/2016/v116n12a13
GENERAL PAPERS
Experimental investigation and numerical simulation of surrounding rock creep for deep mining tunnels
Z-P. SongI; T-T. YangI; A-N. JiangI; D-F. ZhangI; Z-B. JiangII
ISchool of Civil Engineering, Xi'an University of Architecture and Technology, Xi'an, China
IITransportation Equipment and Ocean Engineering College, Dalian Maritime University, Dalian, China
SYNOPSIS
In deep excavations under conditions of high ground stress, even hard rock undergoes creep and other time-dependent effects that may result in instability. This study involves an analysis of the typical damage to the surrounding rock in the deep tunnels of the Jinchuan nickel mine in China. In order to understand the creep mechanism, triaxial creep laboratory tests were conducted under high stress. The creep characteristic curves and the Nishihara model parameters of typical rock were obtained from these tests. The numerical simulations, with which the creep model is developed, were performed using Flac3D. The creep model parameters were back-analysed on the basis of field monitoring data. Finally, appropriate support schemes for deep tunnels are suggested. The creep deformation of rock increases with time and axial load. At the same load level, the creep deformation of unloading is greater than that of loading. The simulated deformations of the surrounding rock are coincident with those from in situ monitoring, indicating the applicability of the presented rock creep model in situations of high ground stress. The results constitute a reference for support design in deep mining tunnels.
rock creep, high ground stress, deformation, modelling, numerical simulation.
Keywords: rock creep, high ground stress, deformation, modelling, numerical simulation.
Introduction
The excavation of underground caverns can alter the natural stress field of the surrounding rock. In deep engineering projects under conditions of high ground stress, even hard rock shows obvious creep properties and time effects (Yao, 2005; Liu, 1994). The time effect of excavation not only causes decompression of the floor and increases sidewall stress, but also leads to stress concentration at the corners of the excavation, which influences the stability of the surrounding rock in a very complex manner.
Many researchers have studied the creep properties of rock. 'Griggs (1939) showed that creep occurs in sandstone, shale, and silty sandstone rock under the load of 12.5%-80% of the failure load.' Subsequently, much research has been published on rock creep tests, including the uniaxial compressive creep test, the triaxial compressive creep test, the discontinuity rock shearing test, and field tests (Wawersik, 1974; Amadei et al., 1980; Okubo et al., 1991; Jin et al.,1995). A rheological model is used to describe the complex rheological deformation of material. This model is based on various fundamental parameters including rock elasticity, plasticity, and viscous properties, which can be combined into a constitutive model to reflect the rheological properties of various types of rocks. Wang et al. (2014) studied the creep-damage-rupture characteristics of rock salt by applying a creep-damage model. Munson (1997) developed a multi-mechanism constitutive model of creep of polycrystalline rock salt based on steady-state creep and modified it to incorporate transient creep through work hardening and recovery. An elasto-viscoplastic approach was developed to simulate the time-dependent nature of the fracture zone (Malan, 1999). Rheological models were proposed to understand the collapse of iron ore mines in Lorraine by Dragan et al. (2003).
Along with the development of computing science and information science, numerical simulation has profoundly influenced the study of rock mechanics and engineering, thus making the tunnel creep calculation possible and becoming an important aspect of scientific research and engineering calculations. A rock failure process analysis (RFPA) system for the simulation of failure processes and the time effect of surrounding rock in tunnels was developed by Ma and Tang (2013). Many numerical software tools such as ANSYS (Liu and Sun, 1998), FLAC3D(Gao, et al., 2000), and UDEC (Munson, 1997) can be applied to rheological analysis in geotechnical engineering. These tools are, respectively, based on the finite element method, the finite difference method, and the discrete element method. However, because of the uncertainty and complexity of geological bodies, the adoption of the correct model and rock parameters is the key factor affecting the accuracy of numerical simulations in underground engineering. Recently, there is growing concern over back-analysis using displacement data from monitoring of the surrounding rock to identify rock mechanics parameters (Wang, Utili, and Jiang, 2014; Boydy and Bouvand, 2002). Rock creep parameter back-analysis methods were studied by Mostafa et al. (2013) and Montassar and Buhan (2013). Sakurai (2009) aimed to address actual engineering problems and back-analysed rock mass creep parameters using field monitoring data.
From the above research results, we can identify the following problems. (1) The mechanism of surrounding rock deformation in deep tunnels is different from that in shallow tunnels. Most creep tests and models are limited to soft rock, rock salt, or soil surrounding shallow tunnels, with few concerned with hard rock in the deep tunnels of metalliferous mines. (2) The research results of constitutive models mostly work with laboratory data, which is seldom used in tunnel engineering stability and support design. The present study adapted laboratory, numerical simulation, and field monitoring approaches to study the creep properties of the surrounding rock of deep tunnels in Jinchuan nickel mine in China,. Based on the test data, we selected an appropriate creep model for the deep surrounding rock, back-analysed parameters using the monitoring data, forecast the deformation of surrounding rock, and suggest a support scheme.
Engineering background
Jinchuan nickel mine is situated in Jinchang city, Gansu province, China. The annual output of the mine includes 1.5 x 10⁵ t of nickel, 4 x 10⁵ t of copper, 3.5 t of platinum group metals, 8 t of gold, 8 t of silver, 50 t of selenium, and 2.5 x 10⁶ t of biochemical products. A vertical section of mine area No. 2 is shown in Figure 1.
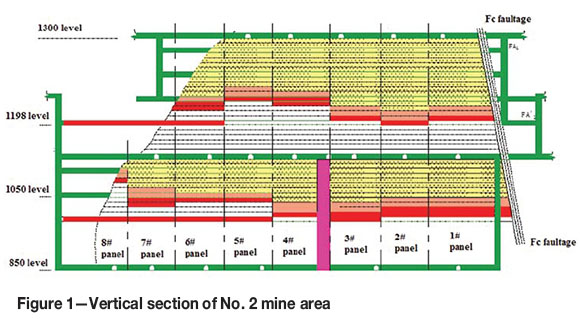
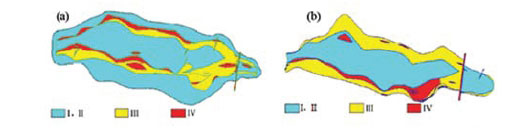
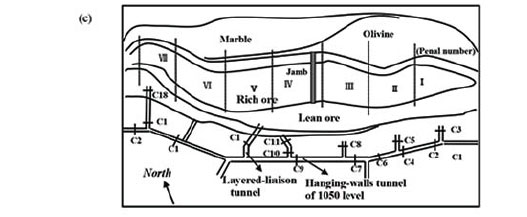
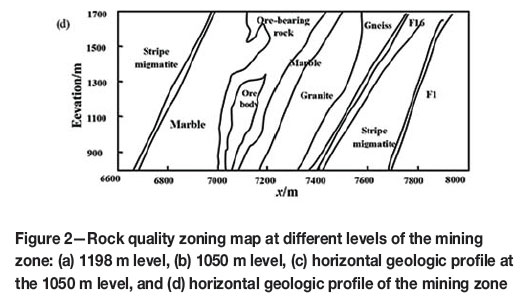
Currently, the mine is made up of two midsections: the 1050 and 1198 m levels. The 1050 m level is divided into five segments, with a depth of 1000 m below the surface. The sublevel height is 20 m. Because of the complexity of the geological body, two classification methods were used to guarantee the accuracy of the classification results. According to the RMR (Bieniawski, 1973) and the Q Tunnelling Quality Index (Barton, Lien, and Lunde, 1974), the rock mass of the Jinchuan mining area at 850-1198 m is divided into three classes, as shown in Figure 2a and 2b. The blue area represents good quality rock with RMR classification I and II , and a Q value between 10 and 40; these rocks include marble, granite, amphibolite, and ore. The yellow area represents general quality class III RMR, the corresponding Q value is between 4 and 10, and the rock types include olivine and peridotite. The red area represents faults and fracture zones with poor quality class IV RMR, the corresponding Q value is between 1 and 4. The geological profiles are shown in Figure 2c and d.
The maximum stress lies in the horizontal direction, running NE-NNE with a magnitude of 1.69-2.27 times the overburden stress, which indicates that the deep stress field is mainly a horizontal tectonic stress. The formulae for the maximum stress, minimum stress, and vertical principal stress are
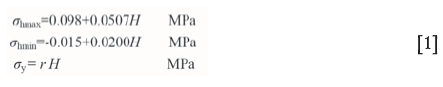
where σhmax, σhmin, and σyare maximum horizontal stress, minimum horizontal stress, and vertical principal stress, respectively; r is bulk density (MN·m3); and H is depth (m).
Rock mass deformation can be influenced by many factors, such as the pre-mining stress model, the geology, the mine layout, the rock mass structure with its major/minor joint densities and directions, and other geological discontinuities. Because this mine area lies at a depth of approximately 1000 m, the horizontal tectonic stress is larger than the vertical stress. The geological body includes some class III and class IV rock masses, and the surrounding rock shows large convergence deformation. According to monitoring results, the convergence deformation can reach tens of centimeters in height. The deformation has a time effect and develops into some typical destructive modes, as shown in Figure 3.
The observed surrounding rock damage modes are as follows: arc squeezing and shearing (Figure 3a); floor lift (Figure 3b); convergence of rock around the entire tunnel (Figure 3c); and sidewall squeezing and extension fracturing (Figure 3d). The above deformation and damage modes of the surrounding rock are mainly induced by a high stress environment and the rock properties. The high stress results in yielded and broken rock. Conversely, with the production and accumulation of inner damage, the strength of the rock decreases over time. In order to ascertain the appropriate support scheme and limit the deformation, it is necessary to study rock creep regulation.
Laboratory testing of rheological properties
Test equipment and test specimens
As shown in Figure 4a, the creep tests were undertaken using the RLW-2000 rock triaxial rheology test system. This comprised an axial loading system, a confining pressure loading system, a pore water pressure loading system, a servo system, and control and data collection systems. Figure 4b shows the actual installation, Figure 4c the rock specimen monitored with sensors, and Figure 4d the rock specimen.
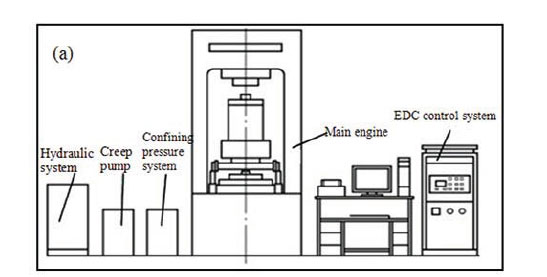
The rock specimens of marble, buchnerite, and rich ore were from the 1050 m subsection of Section C1 in Jinchuan No. 2 mining area at a depth of about 1000 m. Based on the ASTM standard, the rock cores were prepared as standard specimens with a diameter of 50 mm and a height of 100 mm.
Test design
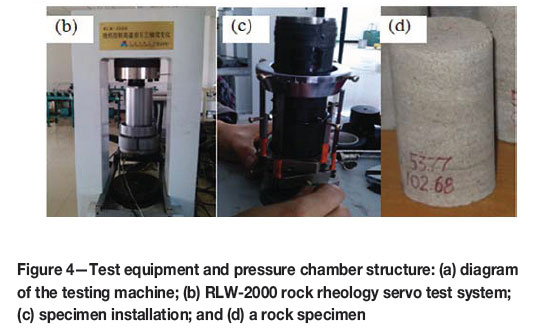
The schemes of the creep test are shown in Table I. The marble and buchnerite creep tests only included the loading process, which comprised seven or eight levels until accelerated creep flow was observed in the rock. Rich ore tests included both loading and unloading processes, and each process included four levels, adopting the same confining pressure (σ2 = σ3) as the single specimen method. The respective confining pressures were 20 and 40 MPa; that is, each specimen was subjected to the same confining pressure and a different σ1. Experiments were conducted at room temperature and under atmospheric conditions.
Results and analysis
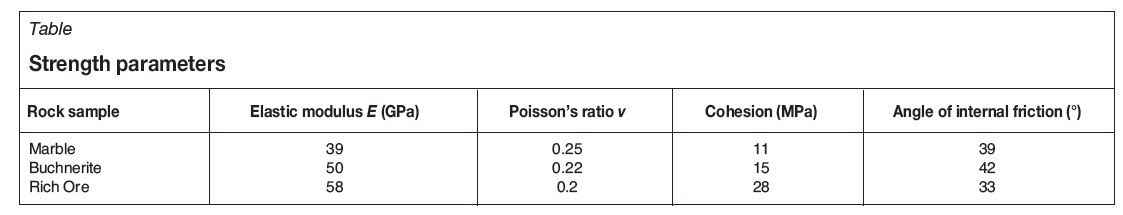
Before the creep tests, triaxial strength tests were performed. Because the Mohr-Coulomb yielding criterion is widely used in numerical simulations for each type of rock for which we performed conventional triaxial shear tests, five specimens were loaded with different confining pressures and the corresponding Mohr envelope was obtained. Using a linear fitting method, the cohesion and angle of internal friction could be determined. Firstly, we derived the formulae of coordinates of tangency points between the cotangent line and any two circles. Then, we carried out unitary linear regression for m tangency points, and so obtained the regression of the envelope line of n Mohr circles. The estimated elastic parameters and strength parameters are shown in Table II. The cohesions of the studied rock samples were between 11 and 28 MPa, with the rock specimens classified as hard rock. There are also some equivalent transform methods that are used to obtain the strength parameters between Mohr-Coulomb and Hoek-Brown criteria, which can improve the rationality of the parameters (Zhao and Li, 2003). The creep tests were completed according to the test procedures, and the creep curves related to deformation and time were obtained. The relationship between axial displacement and time for the marble specimen under different confining pressures and axial loads is shown in Figure 5.
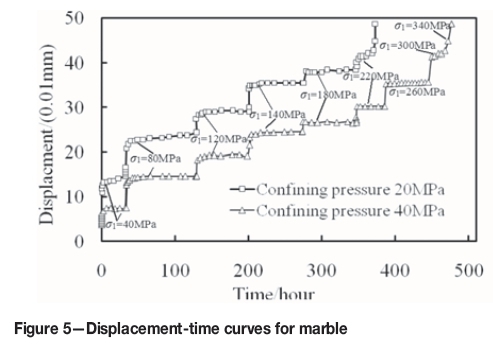
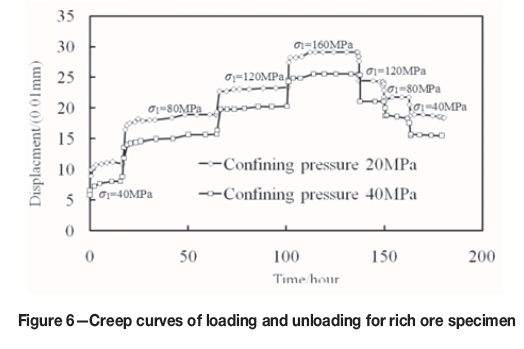
When the axial load increases, deformation increases dramatically; however, when the axial load is constant, deformation slowly increases over time. Damping (the first rheological deformation) and constant velocity flow (the second rheological deformation) obviously occur in the specimen. As the stress increases sequentially and reaches the peak strength of the specimen, the constant velocity creep stage quickly ends and the accelerating creep stage (the third period of rheological deformation) begins. Moreover, the deformation-time curves are nonlinear and have a staircase shape. At a low load level, the axial creep deformation is small. Creep deformation increases with increasing load level. In addition, at the same load level, creep deformation at a confining stress of 40 MPa is much less than that with a confining stress of 20 MPa. Figure 6 shows the loading and unloading creep curves corresponding to different confining pressures for the rich ore specimen. Furthermore, creep deformation increases when the load increases, and when the load decreases the axial deformation decreases accordingly. However, the displacement variations of loading and unloading are different, and the creep deformation of unloading is larger than that of loading at the same stress level. This indicates that at a high stress level, internal damage to the rock increases and plastic deformation results.
Rheological model and its parameters
Nishihara body constitutive model
A viscoelastoplastic model termed the Nishihara body (Figure 7) was proposed in 1961 and comprises a Kelvin body and a Bingham body. The creep curve for the Nishihara body can be used to describe decay, steady, and unstable creeps. The Nishihara body was selected as the creep model for the expression of the test data in this study.
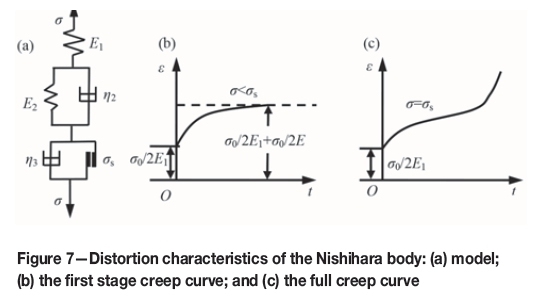
Consider that the total stress is σ, strain is ε, and rock yield stress is σs, the Nishihara body constitutive equations can be expressed as
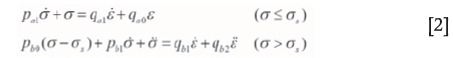
where
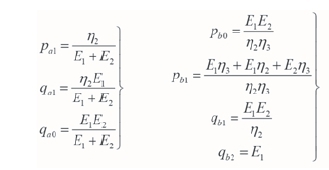
E1 and E2 are spring coefficients of the Hookean spring; η2and η3are viscosity coefficients of the Newton dashpot; and σsis the long-term strength or yield strength of the Saint-Venant body.
According to the generalized Hooke's Law, the three-dimensional constitutive relation for an elastomer is
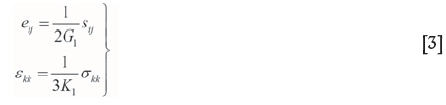
where sijis the deviatoric stress tensor, eijis the deviatoric tensor of strain; σkkand εkkare the deviatoric stress tensor and the first invariant stress tensor, respectively; and G1and K1are shear modulus and bulk modulus, respectively. Therefore, the elastomer's strain can be represented as
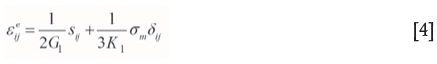
where is the spherical component of the stress tensor.
Assuming that the volume change is elastic, rheological properties are mainly performed at the shear deformation. The viscoelastic solids three-dimensional constitutive relation is
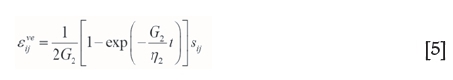
where G2and η2are the viscoelastic shear modulus and shear viscous coefficient, respectively. The viscoelastoplastic constitutive relationship is
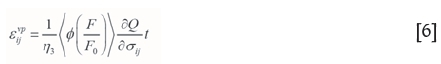
where
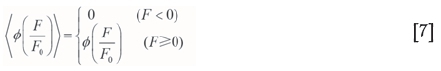
where F is the rock yield function; F0 is the initial reference value of the rock yield function; Q is the plastic potential function; and Ф (·) is taken as a type of power function, usually taking the power index n = 1.
Validation of the constitutive model
The Nishihara model describes the variation in the attenuation period and steady period fairly well.
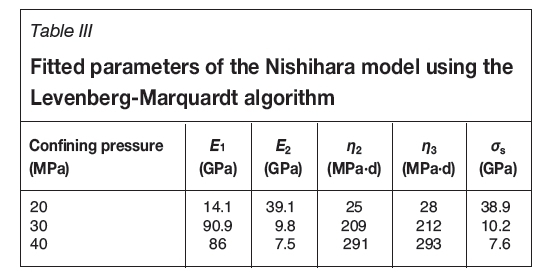
E1, E2, η2, η3, σsare the parameters of the model. The terms E1 and E2 are for the elasticity moduli; η2and η3are viscosity coefficients; and σsis long-term strength. E1 and σs can be obtained from the test creep curves directly, according to the results of the above rock creep test. They describe the sum of squared differences between calculated strain of the Nishihara model and monitored strain in laboratory tests as Q (E2, η2, η3). There are many choices available to fit nonlinear models to the data. We selected a type of nonlinear least squares, called the Levenberg-Marquardt algorithm (Bevington,1982; Brown, 2006). It is more accurate than gradient descent algorithms and more robust than the Gauss-Newton algorithm.
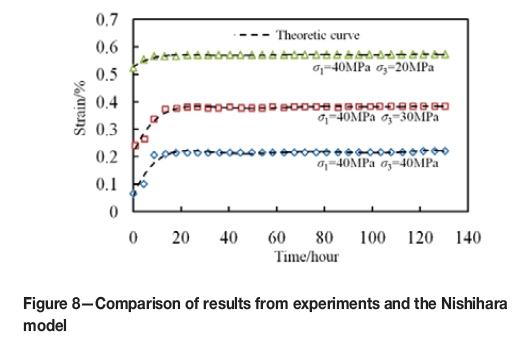
The rheological parameters are shown in Table III. The terms E1 and E2 are the elasticity moduli; η2and η3are viscosity coefficients; and σsis long-term strength. As shown in Figure 8, the specimen of marble is highly deformable and the creep parameters are affected by confining stresses because different confining stress provides different constraints on lateral deformation. The creep test curve and the theoretical curve are consistent; therefore the Nishihara model can be used to effectively describe the creep properties of the rock samples.
Numerical simulations of creep for the Jinchuan mining area tunnel
Parameter back-analysis
The Nishihara model parameters obtained from laboratory tests can reflect the creep character of the rock. However, there are differences between intact rock specimens and the rock mass they come from. In order to reflect the geological body properties for tunnels in the Jinchuan No. 2 mining area, displacement back-analysis based on monitoring data is necessary during the engineering process. The purpose of back-analysis is to find a set of material parameters {X*} to meet the following function
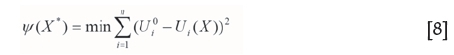
where X represents the parameters to be identified, Ui0 represents real measured displacements of key points, and Ui (X)i represents calculated displacements of key points. When the error function Ψ reaches a minimum, the solution X* can be regarded as the actual parameters of the rock mass.
The geometric and numerical models are s shown in Figure 9. The numerical model includes 15 249 elements and 17 358 nodes. The terms L1, L2, and L3 are the field monitoring lines of the 1050 m subsection in Section C2. The monitoring points were also set in the model and the displacement data was recorded in the calculation process. The Nishihara creep model was adopted for two strata in the simulation. Initially, the model was set up using the rock mass balance. Then, the rock was excavated and supported according to actual engineering procedures used on the mine.
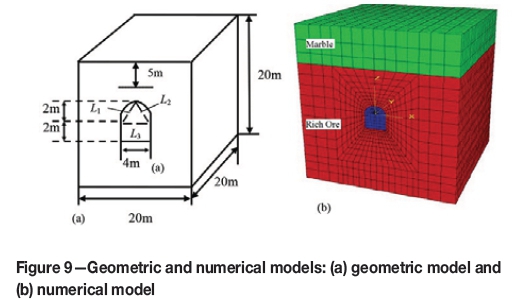
Table IV shows the rock mechanics parameters of marble and rich ore. Because the marble is distant from the tunnel and has little influence on the surrounding rock deformation, its elastic and creep parameters are determined by exploration and experience.
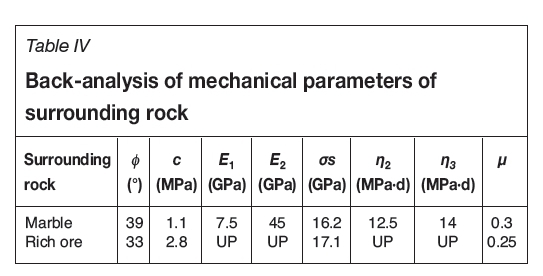
However, rich ore is the main component of the rock surrounding the tunnel; therefore, E1, E2, η2, and η3are set as uncertain creep parameters (denoted as UP in Table IV) that need to be back-analysed with field monitoring curves L1, L2, and L3. Equation [8] is set as an objective function, and the parameters can be determined by optimizing the back-analysis algorithm.
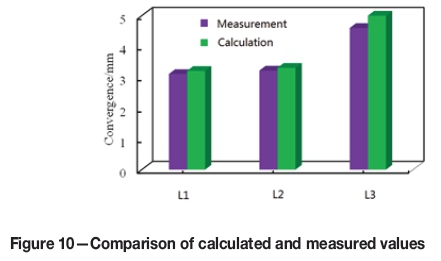
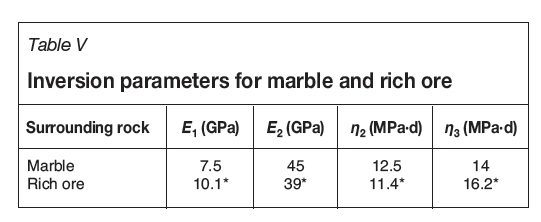
Intelligence algorithm (difference evolution, DE) optimization is used in the back-analysis. The DE has a robust and global searching property. This overcomes the drawbacks of the conventional optimization algorithm, which is limited in its local optimum solution (Mohamed, Sabry, and Khorshid, 2012). We substituted the inversion parameters into the model and calculated the displacements of key measure lines of L1, L2, and L3. Figure 10 is the comparison between the calculated and measured data for the seventh day. These are coincident, illustrating the correctness of the inversion results. The inversion parameters are listed in Table V and can be used for subsequent analysis.
Based on the determined parameters, the numerical simulation and in situ monitoring of sections of C3 and C4 of the 1050 m subsection are compared in Figure 11.
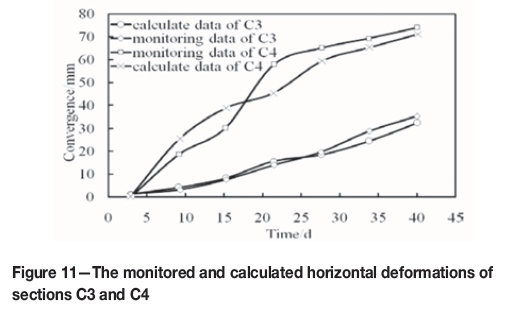
The horizontal convergence deformation of C3 reaches about 30 mm after 40 days. However, simultaneously, the horizontal convergence deformation of C4 reaches about 70 mm. For both C3 and C4, the in situ monitoring data coincides with the simulated results, indicating that the Nishihara creep model can effectively reflect the creep characteristics of deep tunnel rock.
Prediction of surrounding rock deformation
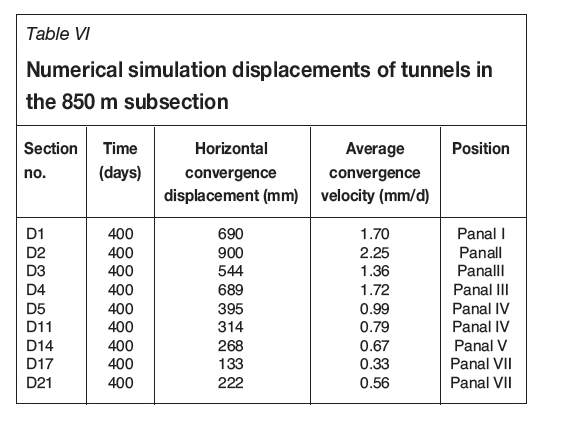
Panels have been designed in several sections of the next mid-section's 850 m subsection tunnels (denoted as D) and will be constructed in future. We conducted numerical simulations for these tunnels based on the back-analysis results so as to forecast the rock displacements at 400 days and to appraise the support scheme. The calculated displacements after 400 days are shown in Table VI. The maximum horizontal convergence displacement in Section D2 is 900 mm, and the corresponding velocity is 2.25 mm/d. The minimum horizontal convergence displacement in Section D17 is 133 mm, and the corresponding velocity is 0.33 mm/d. In summary, there is significant deformation of the surrounding rock after 400 days. This deformation will result in collapse due to the high horizontal stress and rheological properties of the rock. In order to limit the deformation of the surrounding rock and guarantee the stability of tunnels, support schemes should be adopted.
Support strategy for deep tunnels with high ground stress
For the tunnels with high ground stress, the principle of the second support ('first yield, then resist') should be adopted. In order to make the scheme economical and stable, the timing of the first and second supports should be satisfactorily determined. For an environment with high ground stress and seepage pressure, different bolts must be selected depending on the presence of a loose and soft zone, a sliding zone, or an elastic zone. It is suggested that the support scheme be combined with U-type steel arches and bolt grouting, as shown in Figure 12.
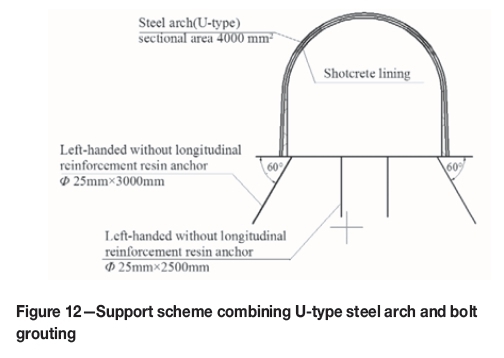
Steel arches can directly support the surrounding rock and effectively reduce deformation. Bolt grouting combined with support and injection helps to increase the strength and bearing capacity of the surrounding rock and effectively control its deformation. The numerical simulation shows that this support scheme can both resist the horizontal deformation of the two sides of the tunnel and control the vertical deformation of the tunnel arc. Long-term deformation of surrounding rock can also be controlled using this scheme.
The results indicated that the above scheme not only effectively limits the deformation of the rock on two sides of the tunnel, but also controls the vertical deformation to a certain extent. The total displacements of the tunnel was reduced by 63.84%. The stress concentration and the depth of rock damage decreased significantly.
Conclusions
The deformation and destruction mode of the surrounding rock in deep tunnels of the Jinchuan nickel mine in China were analysed. The rock surrounding the tunnels is characterized by significant displacement, a long duration time, serious damage, and asymmetry. Deformation of the surrounding rock exhibits an obvious time effect. The essence of tunnel creep is that a brittle failure can become a plastic failure because of the high stress, the inner damage, and the change in rock strength over time.
The authors conducted triaxial creep laboratory tests under a high ground stress condition. The tests results show that rock creep deformation increases with increasing load. If the stress is low, the creep deformation stabilizes. However, if the stress exceeds a certain value, the creep deformation increases over time (i.e. the creep accelerates. When the load decreases, axial deformation decreases accordingly. The curves of loading and unloading are asymmetrical, and the creep deformation of unloading is greater than that of loading at the same stress level. The Nishihara model was adopted to describe the test data.
Based on the field monitoring data, the Nishihara parameters of the rock mass were determined using back-analysis. Numerical simulations of the deep tunnel, the excavation, and the support were carried out. The deformations from numerical calculations and monitoring were coincident, which indicates that the Nishihara creep model can effectively reflect the deep tunnel rock characteristics. From the numerical model, changes in tunnel deformation over time in subsequent phases can be predicted. Based on the analysis, a support scheme combining U-type steel arches and bolt grouting is suggested for deep tunnels under high ground stress. The results indicated that the proposed scheme effectively limits the deformation of the two sides of the tunnel and the vertical deformation of the top arch. The results provide a reference for tunnel support in deep mines with similar geological characteristics.
Acknowledgments
The authors deeply appreciate support from the National Twelfth Five-Year Plan for Science and Technology (2012BAJ17B02), and the National Natural Science Foundation(51079010 51578447).
References
Amadei, B. and Curran, J.H. 1980. Creep behavior of rock joints. Proceedings of the 13th Canadian Rock Mechanics Symposium. pp.146-150. [ Links ]
Barton, N., Lien, R., and Lunde, J. 1974. Engineering classification of rock masses for the design of tunnel support. Rock Mechanics, vol. 6, no. 4. pp.189-236. [ Links ]
Bieniawski, Z.T. 1973. Engineering classification of jointed rock masses. Journal ofthe South African Institution ofCivil Engineers, vol. 15, no. 1. pp. 335-344. [ Links ]
Bevington, P.R. and Robinson, D.K. 1982. Data Reduction and Error Analysis for the Physical Sciences, 2nd edn. McGraw-Hill, New York. [ Links ]
Brown, A. 2006. Spectral curve fitting for automatic hyperspectral data analysis. IEEE Transactions on Geoscience and Remote Sensing, vol. 44. pp. 1601-1608. [ Links ]
Boydy, E., Bouvand, A., and Pellet, F. 2002. Back analysis of time-dependent behavior of a test gallery in claystone. Tunnelling and Underground Space Technology, vol. 17, no. 4. pp. 415-424. [ Links ]
Dragan, G., Francoise, H., and Dashnor, H.A. 2003. Short-and long-term rheological model to understand the collapses of iron mines in Lorraine, France. Computers and Geotechnics, vol. 30, no. 7. pp. 557-570. [ Links ]
Gao,Q., Guo, X.L., and Yang, H.T. 2000, GA-based solution for inverse viscoelastic problem. Journal of Dalian University of Technology, vol. 40, no. 6. pp. 664-668. [In Chinese]. [ Links ]
Griggs, D.1939. Creep of rocks. Journal of Geology, vol. 47, no. 8. pp. 225-251. [ Links ]
Jin, F.N. and Pu, K.Y. 1995, Discussion of visco-elastic models. Chinese Journal of Rock Mechanics and Engineering, vol. 14, no. 4. pp. 355-361. [in Chinese]. [ Links ]
Liu, X. 1994. Rock Rheological Mechanics Introduction. Geological Press, Beijing. [ Links ]
Liu, B.G. and Sun, J. 1998. Identification of rheological constitutive model of rock mass and its application. Journal of Northern Jiaotong, vol. 22, no. 4. pp. 10-14. [In Chinese]. [ Links ]
Ma,.K., Tang, C.A., and Xu, N.W. 2013. Failure precursor of surrounding rock mass around cross tunnel in high-steep rock slop. Journal of Central South University of Technology, vol. 20, no. 1. pp. 207-217. [ Links ]
Malan, D.F. 1999. Time-dependent behavior of deep level tabular excavations in hard rock. Rock Mechanics and Rock Engineering, vol. 32, no. 2. pp. 123-155. [ Links ]
Mohamed, W.A., Sabry, H.Z., and Khorshid, M. 2012. An alternative differential evolution algorithm for global optimization. Journal of Advanced Research, vol. 3, no. 3. pp.149-165. [ Links ]
Montassar, S. and de Buhan, P. 2013. Numerical prediction of liquefied ground characteristics from back-analysis of lateral spreading centrifuge experiments. Computers and Geotechnics, vol. 52. pp. 7-15. [ Links ]
Mostafa, S., Abolfazl, T., and Mohammad, A.M. 2013. Time-dependent behavior of tunnel lining in weak rock mass based on displacement back analysis method. Tunnelling and Underground Space Technology, vol. 38. pp. 348-356. [ Links ]
Munson, D.E. 1997. Constitutive model of creep in rock salt applied to underground room closure. International Journal of Rock Mechanics and Mining Sciences, vol. 34, no. 2. pp. 233-247. [ Links ]
Munson, D.E. 1997. Constitutive model of creep in rock salt applied to underground room closure. International Journal of Rock Mechanics and Mining Sciences, vol. 34, no. 2. pp.233-247. [ Links ]
Okubo, S., Nishimatsu, Y., and Fukui, K. 1991. Complete creep curves under uniaxial compression. International Journal of Rock Mechanics and Mining Sciences and Geomechanics Abstracts, vol. 28, no. 1. pp. 77-82. [ Links ]
Sakurai, S. 2009. Determination of initial stresses and mechanical properties of viscoelastic underground medium. Proceedings of the 3rd ISRM Congress. Colorado University Press, Denver. pp. 1169-1173. [ Links ]
Wang, L.G., Zhao, N., and He, F. 2006. Nonlinear creep model and stability analysis of weak rock. Journal of Liaoning Technical University, vol. 25, Supp1, pp. 680-682. [ Links ]
Wang, G.J., Zhang, L., Zhang, Y., and Ding, G. 2014. Experimental investigation of the creep-damage-rupture behavior of rock salt. International Journal of Rock Mechanics and Mining Sciences, vol. 66, no. 1. pp. 181-187. [ Links ]
Wawersik, W.R. 1974. Time dependent behaviour of rock in compression. Advances in Rock Mechanics. Proceedings of the 3rd Congress of the International Society of Rock Mechanics, Colorado. pp. 357-363. [ Links ]
Wang, H.N., Utili, S., and Jiang, M.J. 2014. An analytical approach for the sequential excavation of axisymmetric lined tunnels in viscoelastic rock. International Journal of Rock Mechanics and Mining Sciences, vol. 68. pp. 85-106. [ Links ]
Yao, X.M. 2005. Studying the rock destroy mechanism induced by surrounding rock unloading. Northeastern University, Shenyang. [In Chinese]. [ Links ]
Zhao, J. and Li, H.B. 2003, Estimating the dynamic strength of rock using Mohr-Coulomb and Hoek-Brown criteria. Chinese Journal of Rock Mechanics and Engineering, vol. 22, no. 2. pp. 171-176. [In Chinese]. [ Links ]
Paper received Nov. 2014
Revised paper received Apr. 2016

