


Services on Demand
Article
 English (pdf)
 Article in xml format
 Article references
Indicators

Related links
-
 Cited by Google
 -
 Similars in Google
Share

 Permalink
Journal of the Southern African Institute of Mining and Metallurgy
On-line version ISSN 2411-9717
Print version ISSN 2225-6253
J. S. Afr. Inst. Min. Metall. vol.116 n.12 Johannesburg Dec. 2016
http://dx.doi.org/10.17159/2411-9717/2016/v116n12a8
GENERAL PAPERS
Estimating the effects of line brattice ventilation system variables in an empty heading in room and pillar mining using CFD
T. Feroze; B. Genc
School of Mining Engineering, University of the Witwatersrand, Johannesburg, South Africa
SYNOPSIS
The ventilation of underground coal mines plays an important role in minimizing the risk of methane and coal dust explosions. The ability of ventilation, with the use of line brattices (LBs), to remove methane and coal dust in empty headings is dependent on the amount of air leaving the LB and entering the heading. The quantity of this air depends on the associated system variables, namely heading dimensions, settings of the LB, and velocity of air in the last through road (LTR). However, the exact effect of these system variables on the flow rate at the exit of the LB in an empty heading is not known. The installation of LBs in South African coal mines is generally carried out based on experience. This can result in over-or under-ventilation and may increase the cost of providing ventilation or cause accidents, respectively. In this paper, using computational fluid dynamics (CFD), the air flow rate at the exit of the LB in an empty heading was estimated using full-scale three-dimensional models. The CFD model used was validated using experimental results Firstly, the settings of these three system variables were varied, the flow rates at the exit of the LB were measured, and finally the results were used to calculate the effect of each system variable. The outcome is a mathematical formula that can be used to estimate air flow rate at the exit of the LB in empty headings for any practical scenario.
This paper will help the coal mining sector in South Africa by providing estimation models based on scientific reasoning for the installation of LBs, and will also serve academia as part of the curriculum towards educating future mining engineers.
Keywords: ventilation, coal mines, line brattice, CFD.
Introduction
Auxiliary ventilation is required to ventilate development headings, which form part of the secondary circuit and are separate from the main flows. The design, selection, and installation of any auxiliary ventilation device requires an understanding of the capabilities of the equipment and the requirement in hand. Codes of practice and regulations in operating mines are developed based on this understanding. Ventilation engineers and mine managers use these codes and regulations to develop plans for optimally managing the hazards presented by the mining operations and the environment.
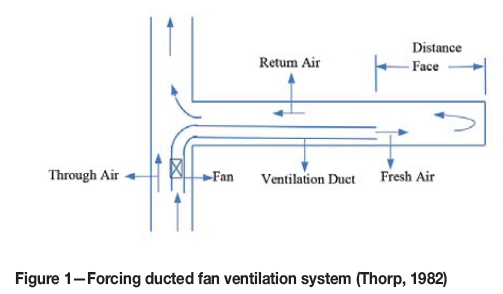
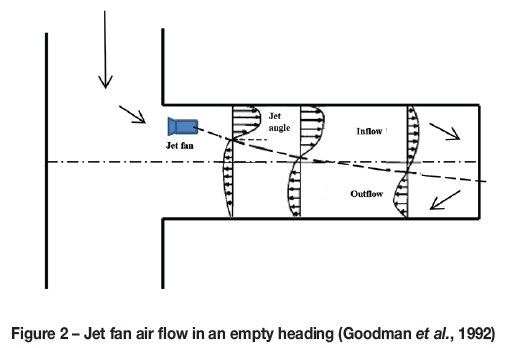
Using this approach, a line brattice (LB) can be an effective method for providing sufficient air into the development heading. A LB is a low-cost, short-term solution to direct air into the development heading without the need for any local power and which produces no noise (McPherson, 1993). It is manufactured from plastic sheeting with or without fabric reinforcement (Hartman et al., 2012). If no LB is used in a development heading the air may not be ventilating beyond 10 m in normal production conditions (Feroze and Phillips, 2015). Therefore, as a general practice, LB ducted fans (Figure 1) or jet fans (Figure 2) are used to ventilate headings deeper than 10 m, to achieve better penetration of air and sufficient ventilation.
LB ventilation systems have been studied for years. Luxner (1969) showed that in a LB ventilation system the air flow patterns were independent of the flow rate delivered by the LB system. Meyer et al. (1991) have shown that upstream and downstream scoops increase penetration by 16% and 46% respectively, and also that the air velocities are greater than without the use of a brattice. Meyer (1993) showed that the recirculation with an upstream brattice is 10%, and 50% with a downstream brattice. Tien (1988) revealed that a LB is essential for the prevention of recirculation and for the control of respirable dust and methane in the face area. A number of studies have been carried out on the effect of the setback distance (distance of the LB from the face). Taylor et al. (2005) and Goodman and Pollock (2004) showed the effects of the LB setback distance on return airway dust and gas levels. Goodman et al. (2006) also showed that for an exhaust LB system an increase in setback distance increases the dust levels close to face. Thimons et al. (1999) studied the influence of LB setback distance on the air flow at the face in the presence of a continuous miner.
In addition to past experimental studies, numerical modelling has been extensively used over the past decade in research related to ventilation systems in underground mining. Aminossadati and Hooman, (2008) studied the effects of LB length on the ventilation of the crosscut region using a two-dimensional CFD model. Wala et al. (2003) carried out simulations related to working face ventilation in the presence of a continuous miner, and the air requirement to ventilate methane during the mining of a boxcut and slab cut (Wala et al., 2007). Phrushotham and Bandopadhyay (2010) simulated the shock-loss phenomenon of different configurations of air crossings. Zheng and Tien (2008) used CFD to simulate the diesel particulate exhaust from mining machines. Torano et al. (2009) studied methane behaviour in a roadway using CFD. Van Heerden and Sullivan (1993) used CFD to simulate the ventilation of the working areas in the presence of continuous miners and roadheaders.
However, the design and installation of a LB are still fundamental issues for ensuring sufficient air supply for effective ventilation (Aminossadati and Hooman, 2008). No mathematical models have been developed to estimate the outcome of a LB ventilation system. The ability of ventilation air, with the use of a LB, to remove methane and dust in development headings is dependent on the amount of air entering the heading {i.e. leaving the LB) (Lihong et al., 2015). The quantity of this air changes with the settings of the associated system variables such as heading dimensions, settings of the LB, velocity of air in the LTR etc. The lengths of the development headings and the air flow rates available in the LTR are not the same throughout a mine and change at each stage of mining. Therefore, the settings of the auxiliary equipment used at one place may not be appropriate at another place, and supervisors need to be guided by instructions based on scientific reasoning to change the settings to obtain the desired flow rates for each location. At present, LBs are still installed based on experience and, since a development heading where production takes place is the most vulnerable area due to the presence of high levels of methane and dust, inadequate ventilation may lead to conditions conducive to methane explosions. About 75% of methane explosions occur in the immediate working areas and in blind drifts (Tkachuk et al., 1997). The correct/optimum use of LBs at each location can be determined only once the effect of each associated system variable on the flow rate is known, otherwise the ventilation will either be more than the requirement, adding to costs, or insufficient to ensure compliance with regulations and may result in accidents.
In this investigation, ANSYS Fluent, a CFD numerical code, was used to investigate the effect of some of the system variables associated with the LB ventilation system on the flow rate at the exit of the LB. These variables are the dimensions of the heading (height and depth), LTR velocity, and settings of the LB (length of the LB in the LTR, angle of the LB in the LTR, length of the LB inside the heading, and distance of the LB from the wall of the heading). The mathematical model presented will assist ventilation managers and supervisory staff to correctly estimate the outcome of their actions in advance, so that optimum ventilation can be ensured. The results have academic value as well, and can be used as training material to teach the effects of the system variables associated with the LB ventilation system.
Research matrix
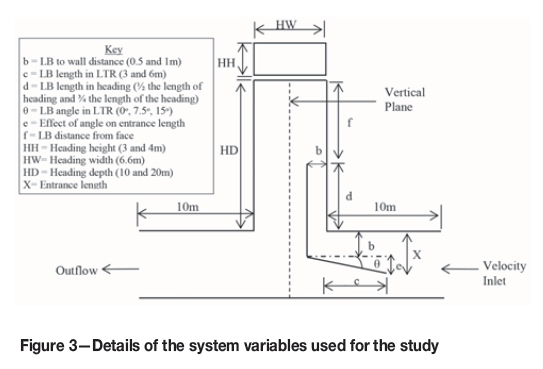
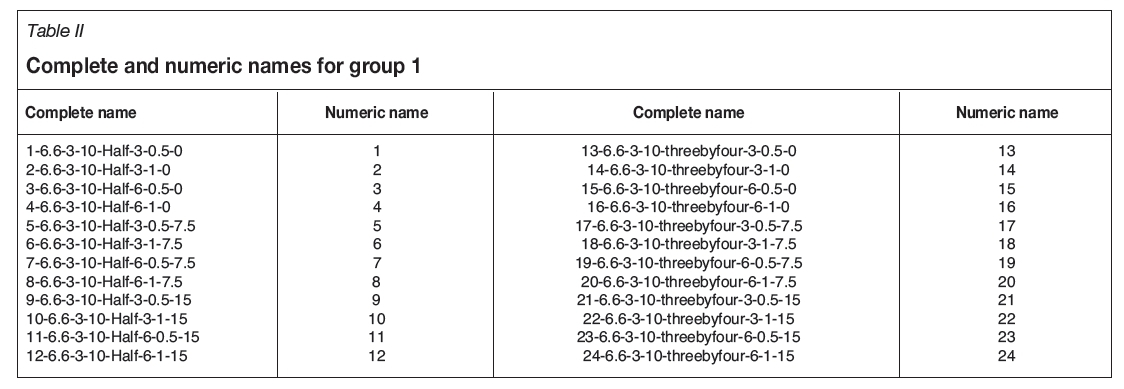
The system variables used for this research are the heading dimension, LB settings, and the LTR velocity, details of which are given in Table I and shown in Figure 3. Each possible combination of these variables was studied, resulting in a total of 96 cases for each LTR velocity (combined cases for all LTR velocities were 288). To carry out the analysis, these cases were organized into four groups based on the dimensions of the heading, and in each group there are a total of 24 base cases. These cases were named using the syntax case number - width of heading - height of heading -length of heading - length of LB inside the heading - length of LB in the LTR - distance of LB from wall in the heading -angle of LB in the LTR. Thus 1-6.6-3-10-Half-3-0.5-0 means case number 1, the dimensions of the heading are 6.6 x 3 x 10 (W x H x D), the length of the LB inside the heading is half the size of the heading, the length of the LB in the LTR is 3 m, the distance of LB from the wall in the heading is 0.5 m, and the angle of the LB in the LTR is 0°. Based on the heading dimension, the groups of cases formed in this study are 6.6 x 3 x 10 m (Group 1, 1-24 cases), 6.6 x 3 x 20 m (Group 2, 25-48 cases), 6.6 x 4 x 10 m (Group 3, 49-72 cases), and 6.6 x 4 x 20 m (Group 4, 73-96 cases). The system variables were changed within each group in the same sequence; the numerical and complete names of group 1 are given in Table II. Therefore, sets of cases became available within each group and amongst groups as well. In each set, all the system variables excepting one are the same for all the cases of a set. This helped in undertaking comparative analyses and calculating the exact effect of each system variable.
Numerical modelling of the LB ventilation system in CFD
The complete numerical modelling including the creation of the geometry, meshing of the geometry, solving of the complex set of mathematical equations iteratively, and analysis of the results was carried out using the commercially available ANSYS Fluent numerical code. The mathematical model used consists of the conservation of mass equation, the conservation of momentum (Navier-Stokes equations), and the transport equations for the turbulence model. The numerical model was validated using several studies, one of which is given in Feroze and Phillips (2015), and another such study is included in this paper.
The K-ε model uses two transport equations to solve the velocity and the length scale. The turbulence kinetic energy, k, represents the velocity scale while turbulence dispersion rate, ε, represents the length scale. This is the widely used method for underground air flow analysis and has a few variants. One such variant is the realizable K-ε model, which was used for this study. This model is more accurate than the K-ε as it uses an improved equation to calculate turbulence dispersion rate and calculates the eddy viscosity coefficient, unlike the standard K-ε model where it is assumed as a constant. The details of the turbulence model are available in the software manual (ANSYS Fluent Theory Guide, 2015).
Model geometry and meshing
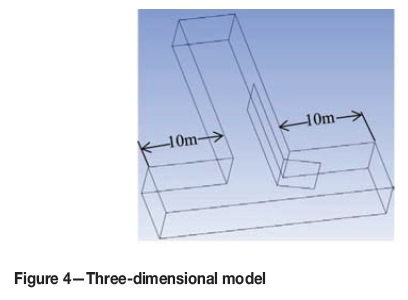
The three-dimensional model as shown in Figure 4 was generated in the ANSYS Design Modeller software for all the cases. The length of the LTR modelled on both the upstream and downstream side of the heading was kept equal to 10 m for all the cases. As far as possible a structured hexahedral mesh with a size of 0.04 m was created using the ANSYS Mesher. A mesh independence test was carried out using mesh sizes of 0.1 m, 0.075 m, 0.04 m, and 0.03 m. A mesh size of 0.04 m was found to be the most suitable, with less than 1% deviation with further reduction in mesh size. Inflation layers, where required, were used at the boundaries of the geometries to allow smooth transition from laminar flow near the wall to turbulent flow away from the walls.
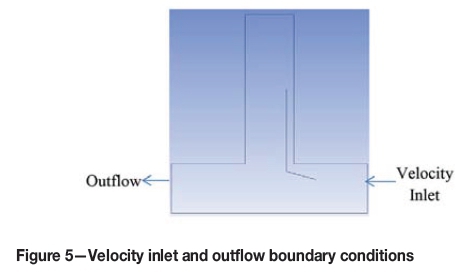
Boundary conditions
► At the inlet of the LTR (Figure 5) a 'velocity inlet' boundary condition was used and air velocities of 1 m/s, 1.5 m/s, and 2 m/s were used for each base case
► At the outlet of the LTR (Figure 3) an 'outflow' boundary condition was used
► At all the walls an enhanced wall function was used in all the simulations.
Numerical calculations
The governing equations, together with the selected turbulence model and boundary conditions, were iteratively solved using ANSYS Fluent numerical code. A second-order scheme was used, which is computationally more intensive than a first-order scheme but the error is less. The convergence criteria for all the equations were set at 10-5. The iterative process was stopped after the desired convergence and the overall mass conservation was satisfied at the inlet and outlet of the domain (property conservation).
Results and discussion
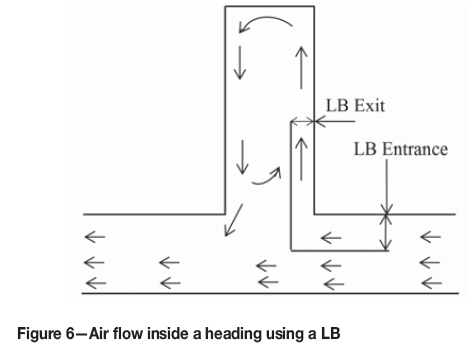
288 scenarios were simulated and studied to visualize the effects of the change of LTR velocity and the change of configuration of the LB for different dimensions of the headings on the flow rates at the exit of the LB. A LB was installed on the upstream side. The air therefore followed a counterclockwise flow inside the heading, entered from the upstream side through the channel between the LB and the wall, and joined the main stream at the downstream side as shown in Figure 6.
Flow rates at exit of LB in the empty headings
The flow rates measured at the exit of the LB for all the cases with a LTR velocity of 1 m/s are given in Figure 7, showing the cumulative effect of all the system variables except for the LTR velocity. A number of factors besides the LTR velocity and the height of the heading affected these flow rates by inducing viscous effects:
► The length of the LB in the LTR and the heading
► Angle of the LB in the LTR; the entrance length of the LB
► Distance of the LB from the wall in the heading dictates the reduction in area between the LB and the wall; larger area at the entrance of the LB vs the area inside the heading when an angled LB is used.
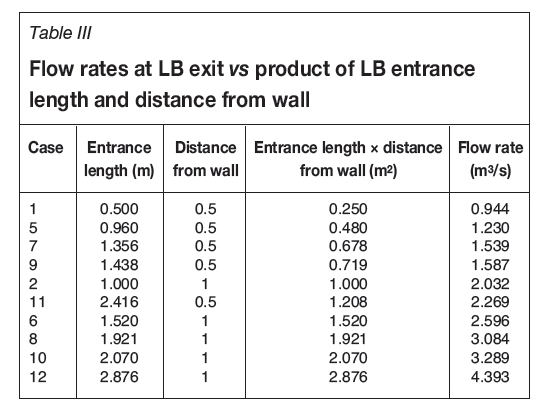
To develop an initial estimation model, the measured flow rates for the first twelve cases (6.6 x 3 x 3 m heading with 5 m long LB in the heading) simulated with a LTR velocity of 1 m/s were analysed. This model was then refined by considering the effect of the system variables highlighted above on all the cases. The flow rates for these cases were found to be proportional to the product of the entrance length and the distance of the LB from the wall in the heading, as given in Table III and shown in Figure 8. The product of entrance length and distance of the LB from the wall is the same for cases where the LB was used with zero angle and the same wall distance (same for Case 1 and 3 and for 2 and 4). Therefore, out of the first four cases only Cases 1 and 2 were used in the initial estimation model.
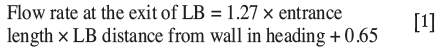
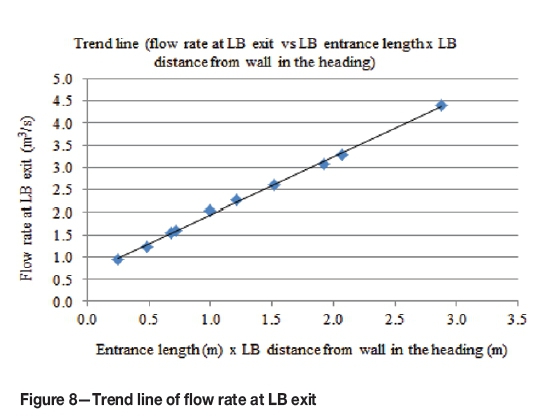
The expression of the trend line in Figure 8 is given in Equation [1]. This equation is only applicable to the cases falling within the boundaries of the 10 cases used to develop the expression. However, to use Equation [1] for all other scenarios encompassed within the boundaries of this study, additional conditions were determined after deliberating upon the effects of the change in the LTR velocity, height of the heading, length of the LB in the heading, and change in length of the LB in the LTR when it was used with zero angle.
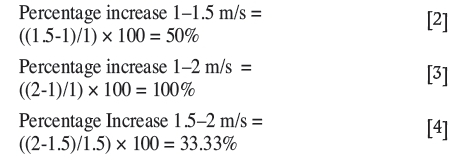
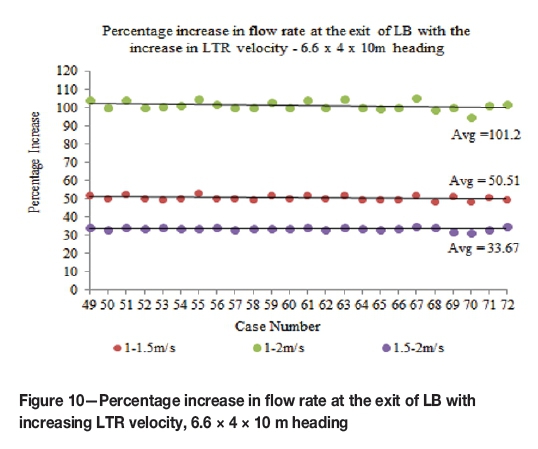
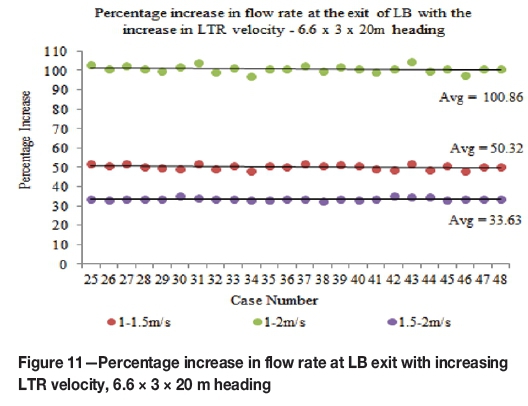
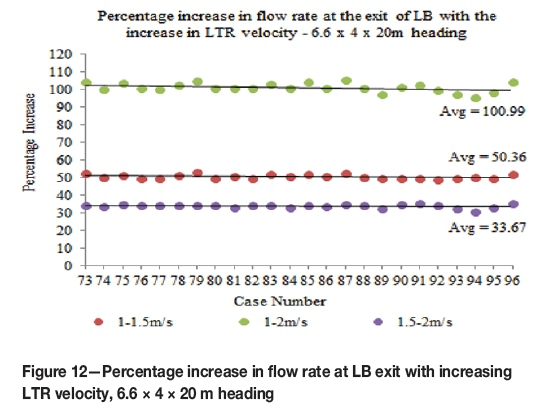
Effect ofchange in LTR velocity
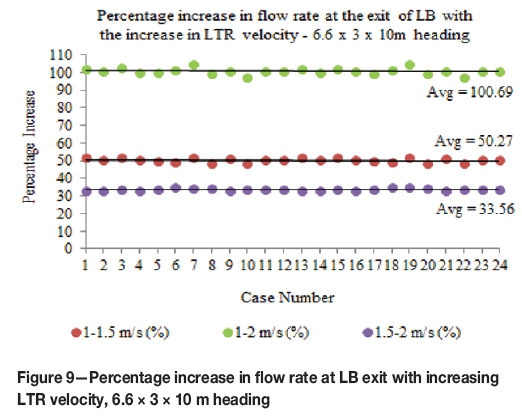
The percentage increases in the flow rates at the exit of the LB with the increase in LTR velocity are given in Figures 9 through 12 for each heading dimension (for all LTR velocities). The percentage differences in the LTR velocities are given in Equations [2] through [4]. The results showed that the average percentage increase in the flow rates at the exit of the LB with increasing LTR velocity for all the headings was approximately equal to the corresponding percentage increase in the LTR velocity (maximum average difference of less than 2%).
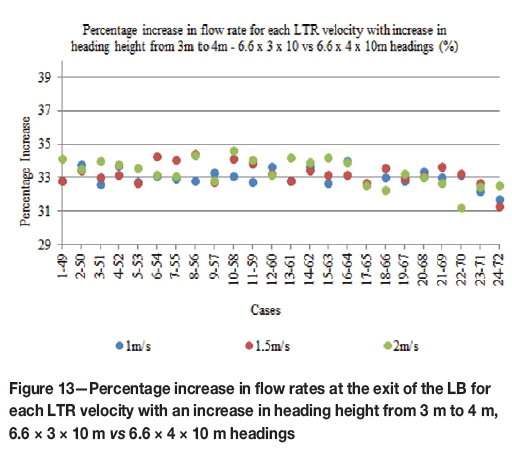
Effect of change in height of the heading
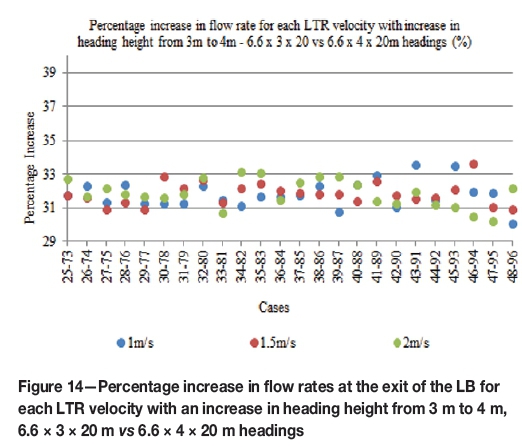
The percentage increase in the flow rates at the exit of the LB with increasing height of the heading, i.e. 6.6 x 3 x 10 m vs 6.6 x 4 x 10 m and 6.6 x 3 x 20 m vs 6.6 x 4 x 20 m, are given in Figures 13 and 14 respectively. The percentage increase in the areas of the headings with the change in the height of the heading from 3 to 4 m is given in Equation [5]. The results showed that the average percentage increase in flow rate was approximately equal to the corresponding percentage increase in the height of the heading (maximum average difference of 1.2%).
Effect of change in length of the LB in the LTR
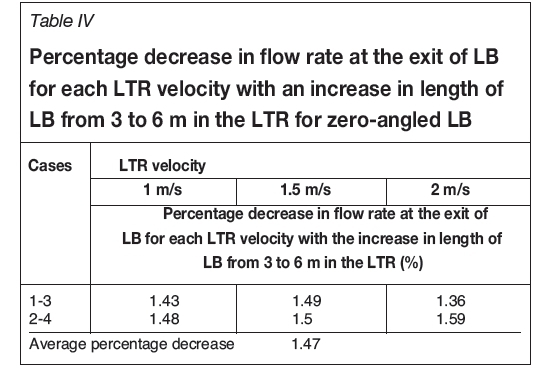
The effect of the change in length of the LB in the LTR for a LB used with an angle is already catered for in Equation [1] by using the product of entrance length and distance of the LB from the wall of the heading. However, when the LB was used without an angle, the product of entrance length and the distance of the LB from the wall stayed the same for cases with the same LB-to-wall distance, even with different LB lengths in the LTR. To cater for this, the percentage differences in flow rates at the exit of the LB for cases when the LB is used with zero angle were analysed. In the first twelve cases there are two cases each using 3 m (Cases 1 and 2) two using and 6 m (Cases 3 and 4) lengths of LB in the LTR. Two sets of cases can be formed from these four cases: Set 1 with Cases 1 and 3 and Set 2 with Cases 2 and 4. In both the sets, except for the length of LB in the heading, all the other settings are same in both the cases of each set. The differences in flow rates for the cases in each set are given in Table IV. The results show that the flow rate at the exit of the LB decreased on average by approximately 1% per 2 m increase in the length of the LB in LTR. Similarly, for all such sets of cases in the study, this difference was found to be around 1.5% on average.
Effect ofchange in length ofthe LB in the heading
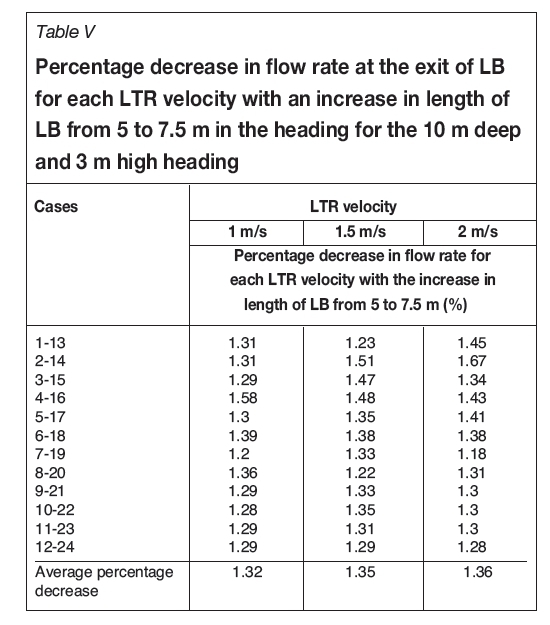
Lengths of 5 m and 7.5 m were used in the 10 m long heading and lengths of 10 m and 15 m in the 20 m long heading. Equation [1] was developed for the 10 m long heading with 5 m long LB. The flow rates at the exit of the LB changed with the change in the length of the LB in the heading. To quantify this change, cases with different lengths of LB in the heading and similar remaining configurations and dimensions were compared. The length of the LB inside the heading for the first twelve cases (1-12) is 5 m and for the next twelve cases (13-24) is 7.5 m. The cases were grouped into twelve sets; in each set all the configurations, except for the length of the LB in the heading, were different (1-13, 2-14.....12-24). The percentage differences in flow rates at the exit of the LB between the cases in each set are given in Table V. The results show that the flow rate at the exit of the LB decreased on average by approximately 1% per 2 m increase in length of the LB. The average difference for all such sets of cases studied was also found to be around 1.5%.
Conditions for using Equation [1]for any heading dimension
Keeping in view the above discussion, the following deductions and conditions can be drawn from Equation [1] to estimate the flow rate at the exit of the LB for cases with any LTR velocity, heading height, and setting of the LB falling within the studied limits.
► Velocity: Equation [1] is for a LTR velocity of 1 m/s. For higher or lower LTR velocities, increase/decrease the flow rate to the proportional increase or decrease in the LTR velocity
► Heading height: Equation [1] is for a heading height of 3 m. Increase/decrease the flow rate proportional to the percentage increase or decrease in height of the heading (compared to 3 m)
► Length of LB in LTR and distance from the wall in the heading
- LB at an angle in LTR: The effect of the change in length of the LB in the LTR for an angled LB is already catered for in Equation [1] by using the product of the entrance length and distance from the wall of the LB
- LB without an angle in LTR: Equation [1] was designed for a LB length of 3 m in the LTR. The viscous effect changes with the change in this length. Therefore, the estimated flow rate change is 1% increase/decrease per 2 m decrease/increase in the length of the LB in the LTR respectively (using the reference length of 3 m)
► Length of LB in the heading: Equation [1] is for a LB length of 5 m in the heading. For different lengths the estimated flow rate change is 1% increase/decrease per 2 m decrease/increase in the length of the LB in the heading respectively (using the reference length of 5 m)
► Leakage: A test case (Case 1 of original study) was simulated with a leaky LB. A gap of 0.1 m was used between the LB and the roof of the heading along the LB. The air flow at the exit of the LB without the leakage was found to be 0.944 m3/s and with the leakage was calculated as 0.922 m3/s, indicating a difference of less than 3%. Similarly, the experimental study conducted at Kriel Colliery, which is described later in the paper, also showed that if a LB is installed correctly, the numerical results can be within limits of 5% accuracy. In order to address the effect of leakage faced in an actual underground environment, a safety factor of 5% may be used with the final estimated result.
Generalized equation
Given the conditions above, a generalized equation to estimate the flow rates at the exit of the LB has been developed and can be written as Equation [6].
Use only when LB used with zero degree in LTR
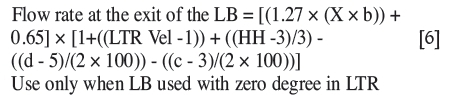
where
X = LB entrance length
b = Distance of the LB from the wall in the heading
c = Length of the LB in the LTR
d = Length of LB in the heading
HH = Heading height
LTR Vel = Velocity of air in the LTR.
Validation case study
Validation of a numerical model is required to demonstrate its accuracy so that it may be used with confidence and that the results may be considered reliable. The validated model can then be used for studies involving a large number of situations in similar environments without conducting further validations. This becomes an even greater advantage when considering ventilation in the mining industry, where it is extremely difficult, and at times even dangerous, to perform experiments and take accurate measurements of the flow features.
In the case study, in situ measurements were taken at Kriel Colliery, which is situated 120 km east of Johannesburg and 50 km southwest of Witbank. These measurements were then compared with the numerical results, and found to be in line with the experimental results.
Experimental set-up and results
The in situ measurements were taken in a heading ventilated using a LB; the dimensions of the heading and LB are given in Figure 15. The velocity of air at several locations inside the heading and the flow rate at the exits of the LB were measured. The air velocities and direction of the air inside the heading were recorded using the hot wire and rotating vane digital anemometers and smoke tube respectively. The air flow rate was calculated by using the average velocity at the exit of the LB. Access to the area within 4 m of the face was not allowed, therefore flow rates close to the face were not taken.
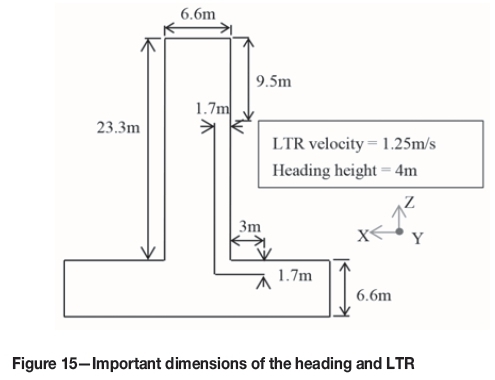
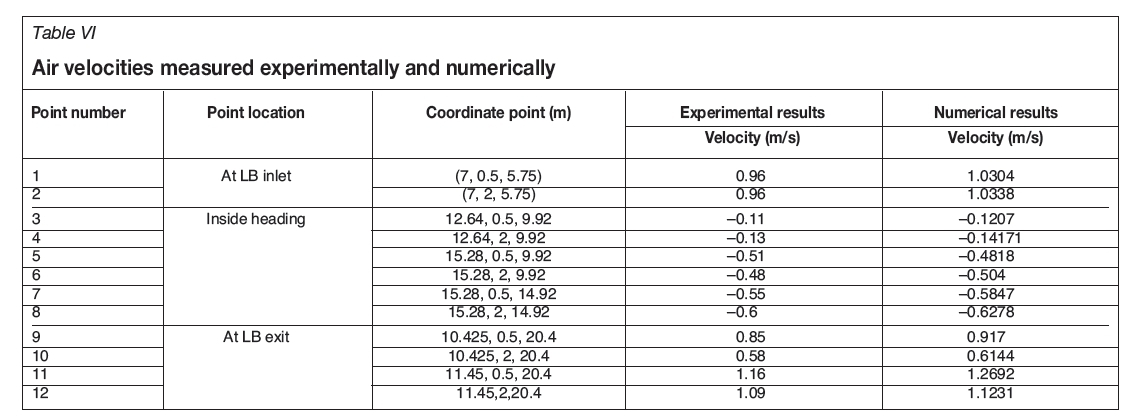
The air velocities measured inside the heading are given in Table VI along with the coordinates of these points. The coordinates of the bottom right corner of the LTR was considered as (0,0,0) and the other coordinates were calculated using this reference point. Positive and negative signs indicate the direction of air movement (a positive sign indicates air movement into the heading, and negative for the opposite movement). The flow rate measured at the exit of the LB was 6.26 m3/s.
Numerical calculations
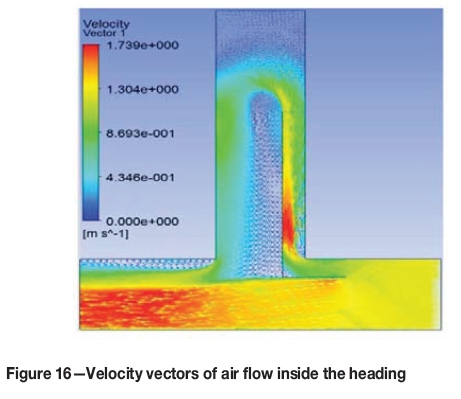
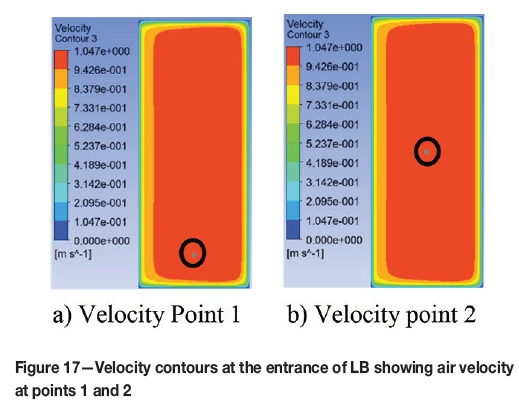
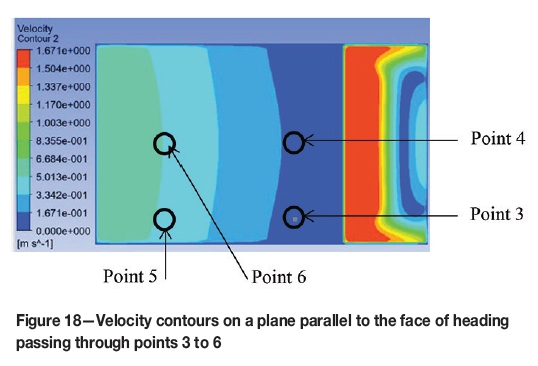
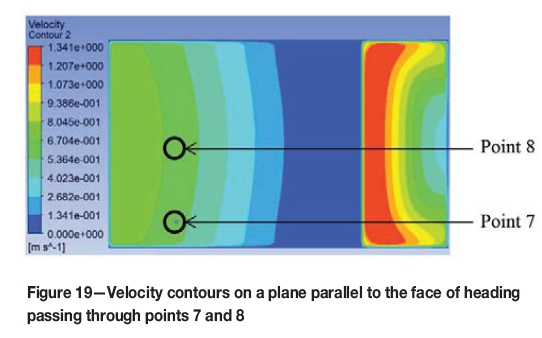
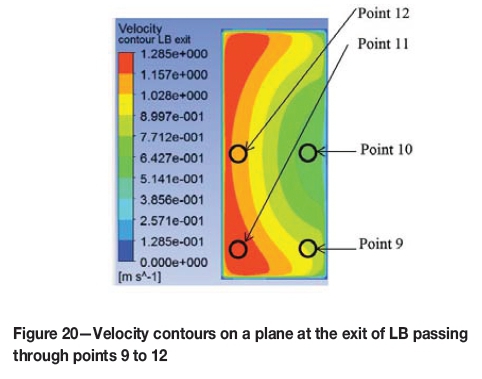
The modelling technique, boundary conditions, and numerical model used for this case study were as used for the other cases discussed in this paper. The flow of air inside the heading is shown using velocity vectors in Figure 16. It can be seen that the air entered the LB-wall channel, ventilated the heading, and returned from the downstream side. The velocities of the air inside the heading at five points (the same points as were chosen for the experiment) are shown in Figures 17 through 20 using velocity contours, and are listed in Table VI. The sign convention in the tabulated data is the same as was chosen for the experimental results; only positive signs are used in the Figures showing the velocity contours, indicating the magnitude of the velocities. The flow rate measured at the exit of the LB was 6.566 m3/s.
Comparison of the validation results
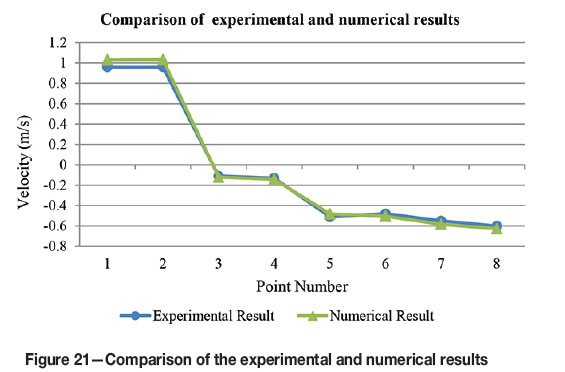
A comparison of the numerical results with the experimental results is given in Figure 21. It can be seen that the numerical results are in line with the experimental results. The validation study showed that the ANSYS Fluent K-ε realizable model is suitable for studying the ventilation of an empty heading connected to the LTR.
Conclusion
The effects of various system variables related to the installation of the LB, along with the effect of LTR velocity and heading height and depth on the flow rates at the exit of the LB in empty headings, were estimated using CFD. These estimations have been represented in simple user-friendly forms. A model to estimate the consolidated effect of all the LB system variables studied has also been formulated by summing the individual effects, and this is represented in Equation [6].
The South African coal mining industry can benefit from this newly developed model in a number of ways. Ventilation engineers can estimate the flow rates at the exit of the LB for different practical scenarios, and this can aid in the provision of sufficient ventilation. The results can easily be developed into a training aid using simple spreadsheets to ensure that mineworkers at the coal face have a better understanding of the working of a LB. The model can also serve academia as part of the curriculum to teach future mining engineers how the different variables associated with the LB ventilation system affect the ventilation in a heading.
Acknowledgements
The authors would like to acknowledge Andrew Thompson from Anglo Thermal Coal, Eric Nkosi from Kriel Coal, and Marco Biffi, Alan Cook, Rodiney Fourie, and Robyn Biffi for making the experimental testing in Kriel Colliery possible. The work presented here is part of a PhD research study in the School of Mining Engineering at the University of the Witwatersrand.
References
Aminossadati, S.M., and Hooman, K. 2008. Numerical simulation of ventilation air flow in underground mine workings. Proceedings of the 12th US/North American Mine Ventilation Symposium, Reno, Nevada, 9-12 June. pp. 253-259. [ Links ]
ANSYS® Academic Research. 2015. Release 15.0, Help System, ANSYS Fluent Theory Guide, ANSYS, Inc. (Chapter 4). [ Links ]
Feroze, T. and Phillips, H.R. 2015. An initial investigation of room and pillar ventilation using cfd to investigate the effects of last through road velocity. Proceedings of the 24th International Mining Congress and Exhibition of Turkey (IMCET15). Antalya, Turkey, 14-17 April. Chamber of Mining Engineers of Turkey. pp. 970-977. [ Links ]
Goodman, G.V.R., Taylor, C.D., and Thimons, E.D. 1992. Jet fan ventilation in very deep cuts - a preliminary analysis. Report of Investigation 9399. US Bureau of Mines, US Department of the Interior, Pittsburgh, PA. pp. 1-12. [ Links ]
Goodman, G.V.R., and Pollock, D.E. 2004. Use of a directional spray system design to control respirable dust and face gas concentrations around a continuous mining machine. Journal of Occupational and Environmental Hygiene, vol. 1, no. 12. pp. 806-815. [ Links ]
Goodman, G.V.R., Beck, T.W., and Pollock, D.E. 2006. The effect of water spray placement for controlling respirable dust and face methane concentrations. Journal of the Mine Ventilation Society of South Africa, vol. 59, no. 2. pp. 56-63. [ Links ]
Hartman, H.L., Mutmansky, J.M., Ramani, R.V., and Wang, Y.J. 2012. Mine Ventilation and Air Conditioning. 3rd edn. Wiley-Interscience. [ Links ]
Lihong, Z., Christopher, P., and Yi, Z. 2015. CFD modeling of methane distribution at a continuous miner face with various curtain setback distances. International Journal of Mining Science and Technology, vol. 25, no. 4. pp. 635-640. [ Links ]
Luxner, J.V. 1969. Face ventilation in underground bituminous coal mines. Airflow and methane distribution patterns in immediate face area - line brattice. Report of Investigation 7223. US Bureau of Mines, US Department of the Interior, Pittsburgh, PA. [ Links ]
McPherson, M.J. 1993. Subsurface Ventilation and Environmental Engineering. Champan & Hall, New York. [ Links ]
Meyer, C.F. 1993. Improving underground ventilation conditions in coal mines. Final Project Report COL 029a, November 1993. Safety in Mines Research Advisory Committee (SIMRAC), Johannesburg. [ Links ]
Meyer, J.P., le Grange, L.A., and Meyer, C. 1991. The utilisation of air scoops for the improvement of ventilation in a coal mine heading. Mining Science and Technology, vol. 13, no. 1. pp. 17-24. [ Links ]
Purushotham, T. and Bandopadhyay, S. 2010. Analyzing shock losses at air-crossings in a mine ventilation network using CFD simulations. Proceedings of the 13th US/North American Mine Ventilation Symposium, Sudbury, Ontario, Canada, 13-16 June. pp. 463-468. [ Links ]
Taylor, C.D., Timko, R.J., Thimons, E.D., and Mal, T. 2005. Using ultrasonic anemometers to evaluate factors affecting face ventilation effectiveness. Society for Mining, Metallurgy and Exploration (SME) Annual Meeting, Salt Lake City, Utah. 28 February - 2 March. 7 pp. [ Links ]
Tkachuk, S.P., Bobrov, A.I., Ivanov, Y.A., and Busygin, K.K. 1997. Trends of aerogas control efficiency improvement in coal mines of Ukraine. Proceedings of the 27th International Conference of Safety in Mines Research Institutes, ICSMRI97, New Delhi, 20-22 February 1997. pp. 463-466. [ Links ]
Thimons, E.D., Taylor, C.D., and Zimmer, J.A. 1999. Ventilating the box cut of a two-pass 40ft extended cut. Journal of the Mine Ventilation Society of South Africa, vol 59, no. 3. pp. 108-115. [ Links ]
Thorp, N. 1982. Auxiliary ventilation practice. Environmental Engineering in South African Mines. Burrows, J. (ed.). Cape and Transvaal Printers, Cape Town. [ Links ]
Tien, J.C. 1988. Face ventilation during cross-cut development in a room and pillar operation. Proceedings of the 4th US Mine Ventilation Symposium, Berkeley, CA, 20-22 June. pp. 202-208. [ Links ]
Torano, J., Torno, S., Menendez, M., Gent, M., and Velasco, J. 2009. Models of methane behaviour in auxiliary ventilation of underground coal mining. International Journal of Coal Geology, vol. 80, no. 1. pp. 35-43. [ Links ]
Van Heerden, J. and Sullivan, P. 1993. The application of CFD for evaluation of dust suppression and auxiliary ventilation systems used with continuous miners. Proceedings of the 6th US Mine Ventilation Symposium, Salt Lake City, Utah, 21-23 June. Society for Mining, Metallurgy and Exploration (SME), Littleton, Co. pp. 293-297. [ Links ]
Wala, A.M., Jacob, J., Huang, P.G., and Brown, J.T. 2003. A new approach to evaluate mine face ventilation. Mining Engineering, vol. 55, no. 3. pp. 25-30. [ Links ]
Wala, A.M. Vytla, S., Taylor, C.D., and Huang, G. 2007. Mine face ventilation: a comparison of CFD results against benchmark experiments for the CFD code validation. Mining Engineering, vol. 59, no. 10. pp. 49-55. [ Links ]
Zheng, Y. and Tien, J.C. 2008. DPM dispersion study using CFD for underground metal/nonmetal mines. Proceedings of the 12th North American Mine Ventilation Symposium, Reno, Nevada, 9-12 June. pp. 487-493. [ Links ]
Paper received Jan. 2016
Revised paper received Mar. 2016.

