


Services on Demand
Article
 English (pdf)
 Article in xml format
 Article references
Indicators

Related links
-
 Cited by Google
 -
 Similars in Google
Share

 Permalink
Journal of the Southern African Institute of Mining and Metallurgy
On-line version ISSN 2411-9717
Print version ISSN 2225-6253
J. S. Afr. Inst. Min. Metall. vol.116 n.11 Johannesburg Nov. 2016
http://dx.doi.org/10.17159/2411-9717/2016/v116n11a11
WITS SPECIAL EDITION - VOLUME I
Review of coal pillar lifespan prediction for the Witbank and Highveld coal seams
J.N. van der Merwe
School of Mining Engineering, University of the Witwatersrand, Johannesburg, South Africa
SYNOPSIS
Coal pillars are prone to scaling over time, and are progressively reduced in size and consequently subjected to increased load and reduced strength. The effective factor of safety therefore reduces. Databases of failed and stable pillars cannot, therefore, be regarded as definitive.
More than a decade has passed since the first attempt to predict the lifespan of pillars. This paper presents a review based on the new database and pillar strength equations. The methodology for the analysis is based on the fact that pillars scale. The ultimate safety factor (defined as the ratio between strength and load at the time of failure) is derived, followed by an estimate of the rate of pillar scaling, which results in an estimate of the expected time of failure.
It is suggested that the predicted lifespan should not be used as an absolute indicator of expected pillar life, but rather as an index - the pillar life index (PLI) - to complement the safety factor and related probability of failure when evaluating pillar stability. A pillar with a predicted lifespan of less than 500 years would be regarded as being in danger of imminent collapse, while a lifespan of at least 1 000 years should be required for long-term purposes.
The differences between this analysis and that published in 2003 constitute a strong case for regular reviews of all the empirically based stability indicators, namely the safety factor, probability of failure, and the PLI. Reviews at 10 year intervals appear to be required.
The constants in the proposed method are valid only for the Witbank No. 1, 2 and 4 seams and the Highveld No. 2 and 4 seams.
Keywords: coal pillar, pillar scaling, pillar age, safety factor.
Introduction
It is well known that over time, coal pillars are prone to scaling, and thus are progressively reduced in size and consequently subjected to increased load and reduced strength. The effective factor of safety therefore reduces and it is quite possible for failure to occur after a long time interval. In fact, scrutiny of the database of failed pillars indicates that failure occurred after periods ranging from 2 to 49 years, and not immediately after mining.
The factor of safety for pillars at the time of failure is not the same as that immediately after mining. The concept of the safety factor is based on the pillar strength obtained by statistical analysis of pillar dimensions immediately, or within a month after mining, when the surveys are conducted. Strictly speaking, the safety factor as commonly used is valid only immediately after mining, and it continues to reduce thereafter. The ideal situation would be to base analyses of pillar strength on pillar dimensions at the time of failure, but that is simply not possible because the real dimensions cannot be measured at that time.
Due to the time-related reduction in the stability of pillars, databases of failed and stable pillars cannot be regarded as definitive. They are merely snapshots of the situation at any given point in time. This is just one argument in favour of periodic reviews of the databases as well as the derivation of pillar strength considerations based on empirical analyses of the databases.
When Salamon and Munro (1967) published their groundbreaking work on coal pillar strength, they had only 27 collapsed pillar cases in the database. That number has now grown to 85 (van der Merwe and Mathey, 2013a). Of the new collapse cases, eight were mined prior to 1965 which means that at the time of the original analysis they would have been regarded as stable cases. Fifty of the new collapses were mined after the introduction of the 1967 safety factor, indicating that collapses have not been completely eliminated by designing according to the safety factor.
The effect of time has to be included in any consideration of long-term pillar stability. The previous attempt at estimating the expected lifespan of coal pillars was described by van der Merwe (2003). More than a decade has passed since then and more data is now available - therefore a review of the procedure is required.
The methodology that was followed in this review is essentially similar to that used previously. It is based on the fact that pillars scale. The ultimate safety factor (defined as the ratio between strength and load at the time of failure) is derived, followed by an estimate of the rate of pillar scaling, which results in an estimate of the time at which failure can be expected.
The rate of pillar scaling was previously determined by back-analysis using the time of collapse and an assumption of the ultimate safety factor, based on the lowest safety factor in the database of failed cases. That rate was subsequently confirmed by measurement of scaling rates on pillars that had scaled but not yet failed (van der Merwe, 2004).
A slightly different sequence was followed in this review. The initial rate, determined by direct measurement on scaled pillars, was applied to the database of failed pillars with known lifespans in order to determine the ultimate safety factor, also taking cognisance of the probability of failure (van der Merwe and Mathey, 2013b). It was then adjusted according to the estimated rate based on back-analysis of the failed pillar database.
Due to differences in site- or seam-specific coal strength characteristics, described inter alia by Salamon, Canbulat, and Ryder (2006), the review was restricted to the Witbank (excluding the No. 5 seam) and Highveld coal seams. Extension of the procedure to other areas and seams was attempted, but there was insufficient data to derive scaling rates with confidence. At a later stage, different groupings of areas and seams for the other areas should be incorporated, but this review is restricted to the Witbank No. 1, 2, and 4 and Highveld seams.
In the context of this paper, the term 'failed case' refers to cases where a number of pillars had failed in the same area, confirmed by subsidence of the surface, and not the failure of individual pillars.
Scaling rates obtained by direct measurement.
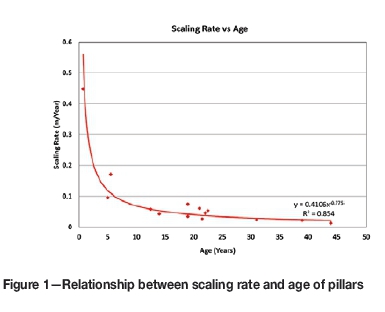
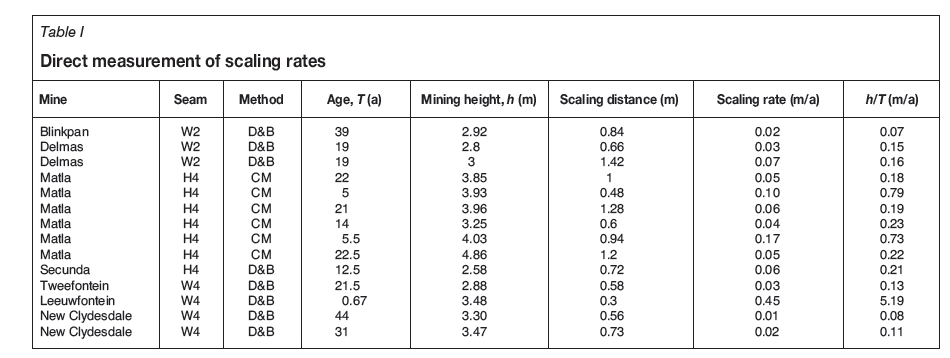
The data used for this analysis is summarized in Table I. This is the data used by van der Merwe (2004), with the addition of two new cases. As in the previous analysis, the rate of scaling was found to correlates with the h/T parameter, the quotient of mining height and age.
The numbers shown in Table I are the average numbers. The total number of individual measurements was in excess of 2 500, the smallest number at any given site being 18. There was no discernible difference between the scaling rates at drill and blast (D&B) sites and areas mined by continuous miner (CM).
The scaling rate correlated well with the inverse of the age of the pillars at the time of measurement, i.e. the younger the pillars the higher the rate. The rate decreased rapidly with increasing age (Figure 1).
Other relationships were also investigated, and the best correlation was obtained when the scaling rate was compared to the h/T parameter (Figure 2).
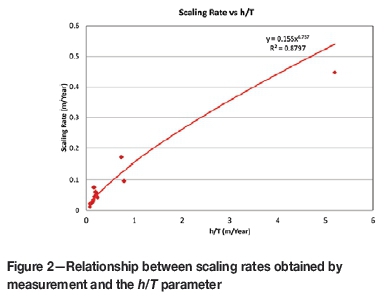
The relationship can be described by the general equation:

where
R = scaling rate
h = mining height
T = pillar age
m, x = constants.
For this case, m = 0.155 and x = 0.757.
The high correlation coefficient, R2 = 0.88, is no doubt influenced by the single outlying data-point. Removing that data-point resulted in the R2 value being reduced to 0.79, which is still considered to be satisfactory although the values of m and x were different. That data-point (Leeuwfontein) was then investigated further, but no reason was found to exclude it from the database. It was measured in the same manner as all the other data-points and there were no recorded geological anomalies. It was thus retained in the database.
Determination of critical safety factor
The next step in the analysis was to apply the scaling rate as found by Equation [1] to the database of failed pillars in order to determine the safety factors at the time of failure.
Database
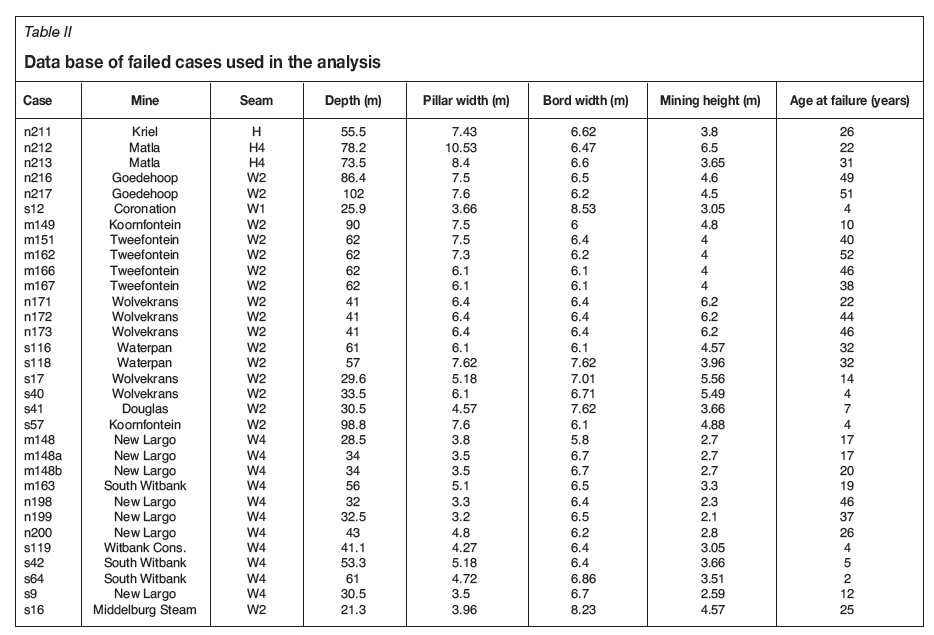
Only the Witbank No. 2 and 4 seams and the Highveld No. 4 seam cases were used (no Highveld No. 2 seam data was available), and cases where the ages of the pillars could not be determined were excluded. The database containing the 32 qualifying cases is shown in Table II.
Ultimate safety factor
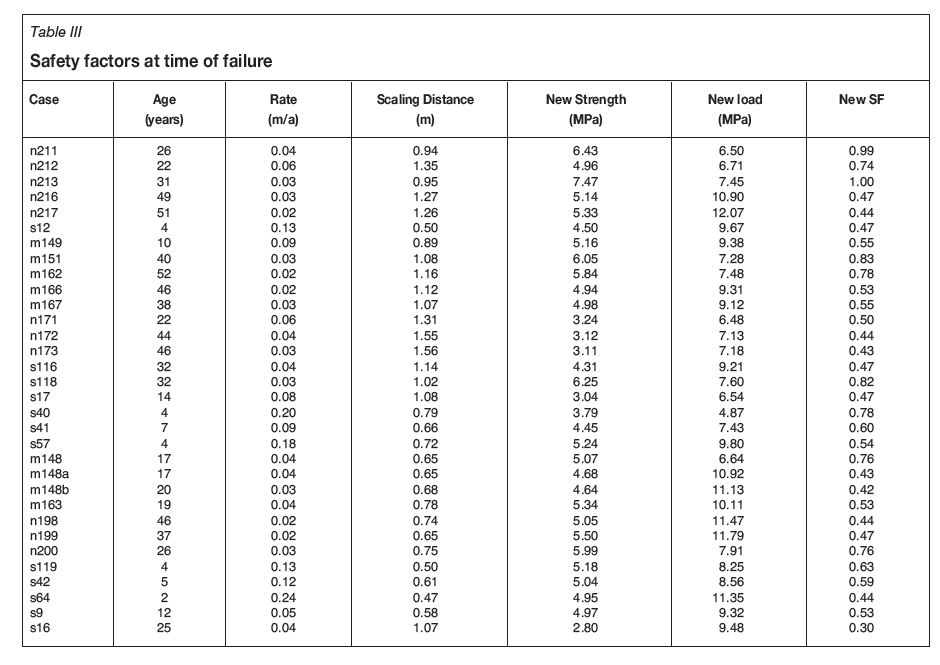
The scaling rate as found by Equation [1] was applied to the cases shown in Table II and the scaling distances at the time of failure were determined. The safety factors at the time of failure, termed the ultimate safety factors, were then determined using the reduced pillar widths. The tributary area theory was used to calculate the pillar loads.
The pillar strength equation that was used was the overlap reduction formula (van der Merwe and Mathey, 2013c):
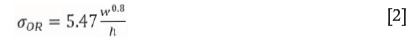
where
w = pillar width (m) h = mining height (m).
The scaling distance, ds, was obtained by:

where
T = age of pillars at failure
R = rate of scaling determined by Equation [1].
The outcomes are shown in Table III.
The median value of the ultimate safety factors is 0.53. This is close to the assumption of 0.4 that was used in the previous analysis in 2003. The probability of failure of pillars at the median safety factor value of 0.53 is 44%. The equation that was used for the probability of failure is that given by van der Merwe and Mathey (2013b):

where SFORis the safety factor using Equation [2] for pillar strength, column 7 in Table III.
Taking into account the imperfections inherent in some of the older data and the scatter in the outcomes, it was decided that a safety factor of 0.5 should be used as the ultimate safety factor, i.e. the safety factor based on dimensions of the pillars at the time of failure, as opposed to the as-mined dimensions. The value of 0.5 corresponds to a probability of failure of 49%.
Determination of the critical scaling distance, dc
The critical scaling distance, dc, is defined as the amount of scaling a pillar has to undergo in order to reach the ultimate safety factor, Su.
Prior to any scaling, the safety factor based on the overlap reduction technique for pillar strength is given by:
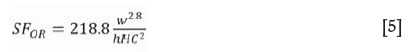
where
C = pillar centre distance
H = mining depth.
After scaling for a distance d, the pillar centre distances remain the same, but the width is reduced to a value w-d. Equation [5] should then be rewritten as:
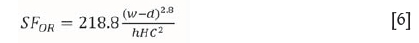
In order for SFORto be reduced to 0.5, the ultimate safety factor, the critical scaling distance, dc, can be obtained by substituting SFORby Svand d by dcin Equation [6]:
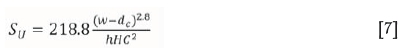
A simple transformation of Equation [7] then yields the expression for dc:

and for SU = 0.5, the final expression is:

Application of critical scaling distance to database of failed pillars
It has now been established that an ultimate safety factor of 0.5 is a reasonable value and an expression for the critical scaling distance has been derived. The next step is to apply this to the database of failed pillars. In the case of failed pillars with known lifespans, the average rate of scaling at the time of failure, RF, can be determined simply by

where L is the known lifespan of the pillars.
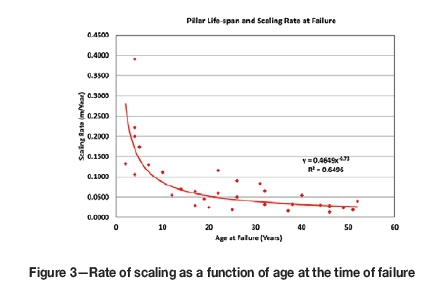
As was the case with the direct measurements, the scaling rate was compared to other measurable parameters. Again, an inverse correlation of the rate with the age of pillars was found (Figure 3). A rapid decrease in the rate with increasing age was also seen, as with the direct measurements.
Other relationships were also investigated, and again the best correlation was found with the h/T parameter (Figure 4). This indicates that the scaling rate decreases rapidly with increasing age and increases with increasing mining height.
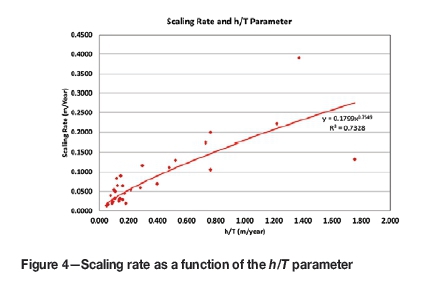
This part of the analysis confirms the generic equation for the rate of scaling (Equation [1]), but with different values for the constants m and x. In the case of the database analysis, m = 0.1799 and x = 0.7549.
The question arises as to which set of constants should be used for m and x. Here it has to be borne in mind that the scaling distances obtained by direct measurement probably underestimate the real distances, as loose slabs that are still in place are regarded as solid. The damaging scaling would include fractures inside the visible pillars that cannot be detected by direct measurement. It is thus believed that the rates obtained by back-analysis of the failed pillars should be used.
To avoid misunderstanding, the rate equation should then be:

The scaling rates as obtained by the two methods, namely direct measurement of scaling distances of pillars prior to failure and hypothesized rates at the time of failure, had the same characteristics. Both displayed the best correlations with the h/T parameter. The relationships were both directly proportional to mining height and inversely proportional to age. Both methods indicated that taller pillars scale quicker and that the rate of scaling decreases rapidly with increasing age.
Pillar life prediction
There are two equations to describe the rate of scaling. One relates the rate to the h/T parameter (Equation [1]) and the other to the rate based on the lifespan of pillars in the database of failed pillars (Equation [10]). At the time of failure, the time T in Equation [1] has to be equal to the pillar age L in Equation [10].
One can then write:
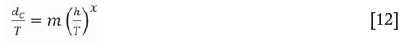
from which it follows that
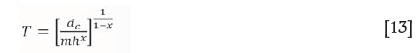
with m = OA 799 and χ = 0.7549.
Equation [13] gives the predicted lifespan of pillars.
Test with known lifespans of failed pillar cases
Equation [13] was applied to the cases in the database as contained in Table II to test the accuracy of the method.
Comparison of scaling rates
The scaling rates predicted by Equation [11] were compared to the scaling rates as obtained with the age of the pillars at failure. This is shown graphically in Figure 5. The slope of the correlation line is influenced by one outlying point. Ignoring that single data-point improves the slope from 0.81 to 0.95 and the correlation coefficient from 0.62 to 0.65.
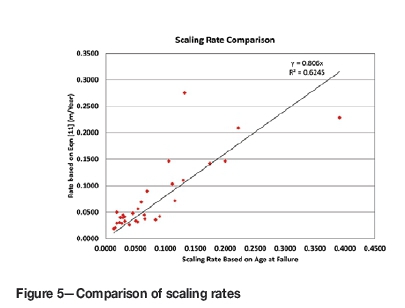
It can be concluded that the rates are in reasonable agreement.
Comparison of lifespans
Compared on a one-on-one basis, there are distinct differences between the actual and predicted pillar lifespans for 7 of the 32 cases (Table IV). The outliers are indicated in red in the table.
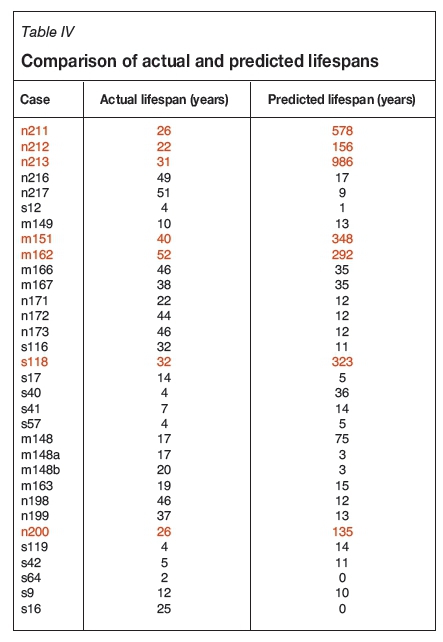
The average of the actual lifespans of the failed pillars is 25 years, and that of the predicted lifespans is 99 years. Removing the seven outliers reduces the averages to 23 and 19 years respectively. This indicates that, on the whole, there is reasonable correspondence between the predicted and actual lifespans, but that predicted lifespans can be inflated. There is nothing in the database that warrants removal of the wayward data points. The explanations are likely to include the following:
► Inaccuracies in recorded data
► Greatly reduced scaling rates of old pillars - an error of a few millimetres per year can add substantially to the predicted lifespan as the scaling distance approaches the critical distance
► Small errors in recorded pillar sizes can also have dramatic effects on the predicted lifespans.
Comparison of predicted lifespans of the failed and stable cases
Pillar lifespans were predicted for a database of hitherto stable cases. The database consisted of the database of stable pillars in van der Merwe and Mathey (2013a), with the exclusion of all but the Witbank No. 1, 2, and 4 seams and the Highveld seams. The remaining database contained 157 cases. Figure 6 shows the frequency distribution of the predicted lifespans, clipped at 40 000 years for clarity.

The average predicted lifespan was found to be 134 000 years, a number which is inflated by a number of cases with extremely long predicted lifespans. Based on the analogy with the predictions for the database of failed pillars, removal of the highest 20% of predicted lifespans reduced the average lifespan to 15 000 years. This is still greatly in excess of the prediction for the known failed cases, inspiring confidence in the prediction method.
The frequency distributions of the predicted lifespans for the failed and intact databases are compared in Figure 7. Note that the horizontal scale in the figure is in two parts, showing the first 1 000 years in shorter intervals than the next 72 000 years. This is done for clarity.
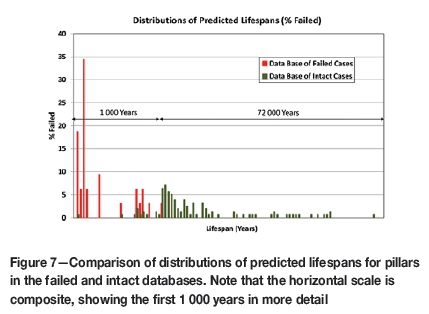
The failed pillar cases peaked at 15 years, while the range extends to a maximum of 1 000 years. The peak value for the database of intact pillars occurs at 3 000 years, while the range extends to 500 000 years. The scale in Figure 7 is clipped at 73 000 years. The figure clearly illustrates the distinction between predicted lifespans for the databases of failed and intact pillars.
Scrutiny of the data indicated that for the database of intact pillars there is a single case where the current survival period of the pillars exceeds the predicted lifespan. Furthermore, 8% of the cases in the database of intact pillars had predicted lifespans of less than 1 000 years, the maximum predicted lifespan of cases in the database of failed pillars. The range of safety factors for this group was from 0.95 to 1.96, the average being 1.4.
The safety factor distributions of cases in the databases of failed and intact pillars are shown in Figure 8. It is seen that 38 (or 20%) of the combined number of cases in the databases occur in the area of overlap, i.e. between safety factors of 1.0 and 1.5. This is comparable to the total number of cases in the overlap zone of the distributions of pillar lifespans - 39 cases or 20.6%.
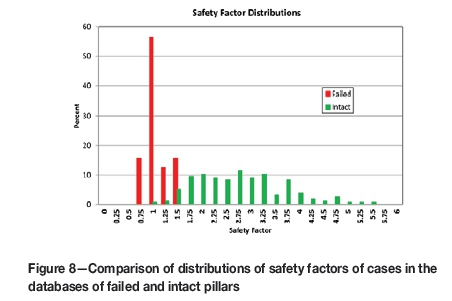
However, in the case of the safety factor distributions, the peaks occur much closer together (compare Figures 7 and 8). The overlap in the predicted lifespan comparison is exaggerated by the single case of a predicted lifespan of close to 1 000 years in the database of failed pillars.
It may be concluded that the predicted lifespan is at least as good a discriminator between failed and stable cases as the safety factor, and taking into account the distance between the peak occurrences, it can be considered as a superior discriminant.
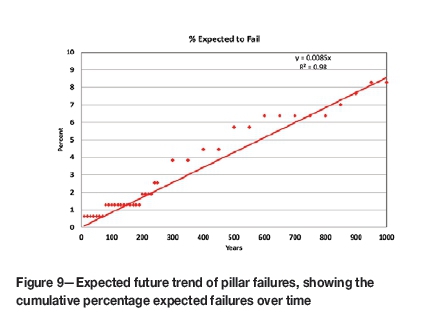
Expected pattern of failures for the future
A question that needs to be answered is how stable is the surface likely to be over currently mined areas where pillars have not failed. To date, only approximately 0.4% of all panels mined by the bord and pillar method have failed (van der Merwe and Mathey, 2013b). That number is expected to increase in the future, the expected trend being shown in Figure 7. The trend is based on the predicted lifespans of pillars in the database of intact pillars. The trend can be expressed by:

where
N = % of panels failed
Y = time in years.
This is in line with current knowledge, indicating that for an average current lifespan of 50 years for South African coal mine pillars, the expected failure percentage is approximately 0.43%. Less than 9% of panels mined can be expected to fail in the next 1 000 years.
Suggested norms
It is clear from the comparisons between predicted and real pillar lives that the method of prediction should not be regarded in the absolute sense; but it is also clear from the comparison between life predictions for the databases of failed and stable cases that there are distinct differences in the predicted lifespans, with the predicted lifespans of cases in the intact database greatly exceeding those in the database of failed pillars.
For the database of failed cases, 95% of the predicted lifespans are less than 500 years, while all the pillars have predicted lifespans of less than 1 000 years. It is therefore suggested that cases where the predicted lifespan is less than 500 years should be regarded as being in danger of imminent failure, while for long-term purposes, a lifespan of at least 1 000 years is proposed as a norm.
Conclusions
► Coal pillars are prone to scaling. This is invariably observed and confirmed by direct measurement. Since pillars only fail after a period of time, the real safety factors of pillars at the time of failure are less than those in the as-mined condition
► The rate of scaling, according to direct measurement, follows a well-established pattern, being inversely proportional to age and directly proportional to mining height
► Application of the scaling rate determined from direct measurement to the database of failed pillars to estimate the pillar dimensions at the time of failure indicated that it is reasonable to assume that the safety factor of pillars at the time of failure is 0.5
► The pillar dimensions for each case in the database of failed pillars that will result in a safety factor of 0.5 can then be determined, and as the real survival periods of those pillars are known, the rate of scaling can be indirectly determined
► The scaling rates so obtained exhibit the same characteristics as those determined by direct measurement, but with slightly different constants
► With scaling rate, pillar dimensions, and safety factor at the time of failure known, it is possible to predict the time at which pillars can be expected to fail
► The correlation, on a one-on-one basis, between the predicted and actual lifespans of pillars in the database of failed pillars, which was determined to test the method, is poor, but the range of predicted lifespans compares reasonably well with the actual range. The prediction method results in clear distinction between the databases of failed and intact pillar cases, with the average predicted lifespan of pillars in the database of failed pillars being 99 years (or 19 years if the obvious outliers are excluded), and that of pillars in the database of intact pillars 134 000 years
► It is therefore suggested that the predicted lifespan should not be used as an absolute indicator of expected pillar life, but rather as an index - the pillar life index (PLI) - to complement the safety factor and related probability of failure in evaluating pillar stability
► As a conservative norm, it is suggested that pillars with a predicted lifespan of less than 500 years should be regarded as being in danger of imminent collapse, while a lifespan of at least 1 000 years should be required for long-term purposes. These norms correspond with the 95% and 99% percentiles of the cumulative frequency of predicted lifespans for pillars in the database of failed pillars, including the outlying points
► The pillar life index is a superior (or at the very least similar) indicator of stability compared to the safety factor. As is the case with safety factors, this is true only for the databases as at the end of 2012
► The differences between this analysis and that published in 2003 provide a strong motivation for regular reviews of all the empirically-based stability indicators, namely the safety factor, probability of failure, and the PLI. Reviews at 10-year intervals appear to be required
► The constants in the proposed method are only valid for the Witbank No. 1, 2 and 4 seams and the Highveld No. 2 and 4 seams.
References
Salamon, M.D.G. and Munro, A.H. 1967. A study of the strength of coal pillars. Journal of the South African Institute of Mining and Metallurgy, September 1967. pp. 56-67. [ Links ]
Salamon, M.D.G., Canbulat, I., and Ryder, J.A. 2006. Development of seam-specific strength formulae for South African collieries, Task 2.16. Coaltech 2020, Johannesburg. [ Links ]
Van der Merwe, J.N. 2003. Predicting coal pillar life in South Africa. Journal of the South African Institute of Mining and Metallurgy, June 2003. pp. 293-301. [ Links ]
Van der Merwe, J.N. 2004. Verification of pillar life prediction method. Journal of the South African Institute of Mining and Metallurgy, December 2004. pp. 667-675. [ Links ]
Van der Merwe, J.N. and Mathey, M. 2013a. Update of coal pillar database for South African coal mining. Journal of the Southern African Institute of Mining and Metallurgy, November 2013, vol. 113 no. 11. pp. 825-840. [ Links ]
Van der Merwe, J.N. and Mathey, M. 2013b. Probability of failure of South African coal pillars. Journal of the Southern African Institute of Mining and Metallurgy, November 2013, vol. 113, no. 11. pp. 849-857. [ Links ]
Van der Merwe, J.N. and Mathey, M. 2013c. Update of coal pillar strength formulae for South African coal using two methods of analysis. Journal of the Southern African Institute of Mining and Metallurgy, November 2013, vol. 113, no. 11. pp. 841-847. [ Links ]
Paper received Apr. 2015
Revised Paper Received Feb. 2016

