


Services on Demand
Article
 English (pdf)
 Article in xml format
 Article references
Indicators

Related links
-
 Cited by Google
 -
 Similars in Google
Share

 Permalink
Journal of the Southern African Institute of Mining and Metallurgy
On-line version ISSN 2411-9717
Print version ISSN 2225-6253
J. S. Afr. Inst. Min. Metall. vol.116 n.11 Johannesburg Nov. 2016
http://dx.doi.org/10.17159/2411-9717/2016/v116n11a10
WITS SPECIAL EDITION - VOLUME I
The influence of various factors on the results of stability analysis of rock slopes and on the evaluation of risk
M.J. Kanda; T.R. Stacey
University of the Witwatersrand, Johannesburg, South Africa
SYNOPSIS
The design of rock slopes in the planning and operation of open pit mines and for road and rail cuttings requires the evaluation of their stability. This is commonly done using two well-established methods - limit equilibrium and numerical modelling. The research described in this paper compares the outputs of analyses using these two methods with regard to factor of safety and probability of failure, taking into account technical factors associated with each method and other factors such as material parameters and their variabilities. Results show that technical factors such as number of slices and slip circles, number and type of finite elements, and the stress reduction factor can all affect the results of stability analyses. Factors not taken into account in limit equilibrium analyses, such as dilation, in situ stress, and locked-in stresses can affect the outputs significantly. The research has focused particularly on the predicted location of the failure surface, the resulting volume of failure and, most significantly dependent on this volume, the predicted risk associated with slope failure. The results presented show that there is good agreement between the outputs of the two methods regarding factor of safety and probability of failure. However, the same is not the case with regard to volume of failure and hence risk, which can be very dependent on the methods of analysis and their input parameters. The research is not exhaustive, and there are many other factors that could affect the results of slope stability analyses that were not investigated. Some such factors are mentioned in the paper.
Keywords: slope stability, factor of safety, probability of failure, volume of failure, risk.
Introduction
The design of rock slopes in the planning and operation of open pit mines and for road and rail cuttings requires the evaluation of their stability. The traditional method of stability analysis used limit equilibrium (LE) methods, and this approach continues to be used. Numerical modelling (NM) packages are now also commonly used in slope stability analyses. The outputs from these analyses provide the factor of safety (FOS) and probability of failure (POF) of the slope. Since the capabilities of the two approaches are different, there can be some variations in FOS and POF outputs and in the predicted location of the failure surface. These variations can affect the predicted volume of failure, and this could in turn have a significant effect on the risk associated with the potential failure (Read and Stacey, 2009). Researchers such as Chiwaye and Stacey (2010) have found that LE analyses underestimate the predicted failure volume, unlike NM methods.
In this paper, numerous factors that influence the outputs from slope stability analyses are considered. These include factors particular to the two analysis methods and their assumptions (referred to as 'technical factors'), and input parameter factors required by one method but not by the other. In addition, the effects on risk resulting from these factors are considered.
Methods of slope stability analysis
Historical observations of slope failures in 'homogeneous' rock and soil slopes indicated that failure surfaces were often curved, and this led to the development of the circular failure analysis method for evaluating slope stability. In this LE method, instability is driven by gravity, and resisting forces are generated by the shear strength along the circular surface. The Mohr-Coulomb shear strength criterion is commonly used to determine the shear strength along the surface (cohesion plus friction) corresponding with the normal stress acting on the surface. For stability analysis, the sliding or rotating mass is divided into a number of slices and the stability of each slice is considered, taking into account inter-slice forces. The cumulative sums of the disturbing forces and the resisting forces at the base of each slice along this surface allow the FOS of the slope to be determined as the ratio of the resisting to disturbing forces. Stability is determined for many circular failure surfaces and the critical failure surface is the one that yields the lowest FOS. The POF of the slope can be determined as the probability that the FOS is less than unity.
Variables in this method of stability analysis include:
► Technical factors associated with the analysis method: number of slices, number of slip circles analysed
► Material property factors: density, cohesion, angle of friction.
The circular failure analysis method was the traditional method of slope stability analysis for many years. However, nowadays numerical stress analysis techniques are commonly also used for slope stability analyses. In contrast with the LE approach, the failure surface is not chosen, but is determined by the development of failure corresponding with the stress distribution in the slope and the specified failure criterion. In this paper, finite element stress analyses were used to evaluate slope stability. Variables in this method include the following:
► Technical factors: number of elements in the finite element mesh, type of finite elements, shear strength reduction method for FOS calculation, method of determination of POF (point estimate method (PEM), response surface method (RSM))
► Material property factors: density, failure criterion and associated parameters such as cohesion and friction angle (Mohr-Coulomb parameters), Hoek-Brown parameters, dilation angle
► Boundary condition factors: remoteness of model boundaries, initial conditions, i.e. in situ stresses, and locked-in stresses (LIS).
It can be seen from the above that there are numerous factors taken into account in the numerical analysis approach that are not taken into account in the LE method. Examples are the in situ stresses and the rock mass deformation properties. It can therefore be expected that there could be differences in the results obtained from the two approaches. For example, the locations of the critical failure surfaces determined in the two methods may not be the same. Chiwaye and Stacey (2010) arrived at this conclusion, and also showed that, consequently, the two methods predicted different volumes of failure. This means that the risk predicted by the two methods, which is directly dependent on the volume of failure, could be significantly different.
The research described in this paper was carried out by Kanda (2015), who investigated the influence of the above factors on the results of slope stability analyses. It should be noted that there have been numerous such investigations, for example by Diederichs et al. (2007), Ureel and Momayez (2014), Rathod and Rao (2012), and Nian et al. (2011). The present research focuses particularly on the predicted location of the failure surface, the predicted volume of failure, and hence the risk associated with failure.
Investigation into factors of influence
Slope stability analyses were undertaken using two Rocscience packages, namely Slide and RS2 (Rock and Soil 2-dimensional, formerly called Phase2), for LE and NM methods respectively. The analyses showed discrepancies in some results in relation to risk assessment. These divergences corresponded with technical parameters and material properties required in the use of these analytical methods. For a study of these factors of influence on slope stability, a slope model was set up. To simplify the problem, the research dealt with a homogeneous rock mass slope with a height of 600 m. The generic slope geometry is shown in Figure 1. Analyses were carried out for a range of slope angles.
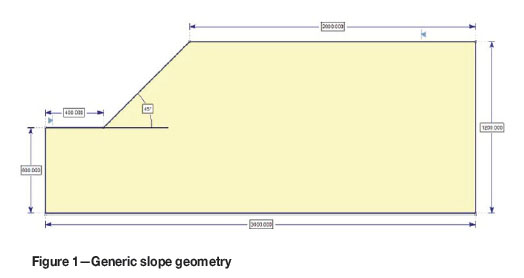
This geometry was adopted as a reference case, and it satisfies the geometrical requirement for a slope model as recommended by Wyllie and Mah (2004). The following properties were assigned to the homogeneous material: unit weight of 27 kN/m3, UCS of 80 MPa, a geological strength index (GSI) of 50, and the Hoek-Brown intact rock yield parameter (mi) equal to 10. The Young's modulus (E) and Poisson's ratio (v) were considered equal to 2.13 GPa and 0.25, respectively. The Hoek-Brown rock mass constant mb was then found equal to 0.28. Based on the suggestions of Hoek et al. (2002), the corresponding mean values of cohesion and friction angle used were 640 kPa and 30 degrees, respectively. These values were based on the work of Chiwaye and Stacey (2010).
Influence of technical factors
LE and numerical analyses were assessed and compared with regard to the sensitivity of their results to technical factors. For the LE evaluation, two factors were considered, namely the number of slices used and the number of slip circles analysed. Numbers of slices were in the range from 1 to 1000. In this LE method of analysis, a non-circular slip surface search has been preferred to the circular slip surface search in order to better approximate the practical path of the failure surface (Rocscience, 2008), and to ensure valid comparison of the results with those of Chiwaye and Stacey (2010). This path search methodology was used. A default number of 5000 slip surfaces was adopted and the optimizing surface option was chosen. The surface that yielded the minimum FOS was adopted as the critical surface of slope failure (Hustrulid et al., 2000).
In the numerical analyses, the two technical factors are the numbers of elements in the finite element mesh and the type of finite elements. The influence of the shear strength reduction factor (Rocscience, 2009), which is the method of FOS calculation, was not investigated, but will be considered briefly in the discussion later in the paper. The sensitivity of slope stability analysis results was assessed for several uniform meshes, with numbers of elements in the interval of 100 to 100 000. The alternatives of three-node and six-node triangular finite elements and four-node and eight-node quadrilateral finite elements were investigated. The method of determining the POF was also investigated, and two alternative techniques were considered, namely the response surface method and the point estimate method.
Influence of material property factors
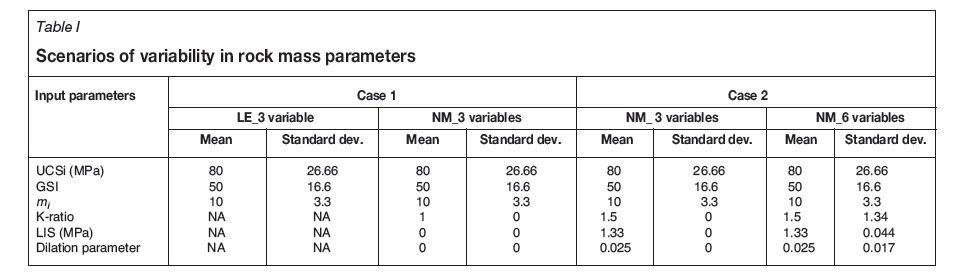
Some material parameters could be included in one analytical method and not in another. To investigate the effects, four scenarios of material property combinations were grouped into two cases as presented in Table I. The material properties that can impact on the LE and NM stability results are the cohesion and the angle of friction. The dilation parameter is a material property not catered for in LE analyses, but which is considered in NM analyses. Variation in the density was not considered in the analyses. To take into account variability in the material properties, two types of distribution were used, normal and lognormal.
In addition to these properties, two failure criteria were considered, the Mohr-Coulomb and Hoek-Brown criteria.
Influence of boundary conditions
The ratio of in situ horizontal stress to vertical overburden stress (K-ratio) and LIS were the two initial conditions assessed. The influence of the remoteness of boundaries was not considered since the adopted model geometry satisfied the requirements indicated by Wyllie and Mah (2004). The combined impacts of the two factors on stability analysis results were evaluated as shown in case 2 in Table I.
Results for the evaluation of the influence of technical factors on slope stability
Probabilistic results of the influence of technical factors are presented separately below for LE analyses and for NM analyses. The influences of these factors on the evaluation of risk are presented and compared later in the paper.
Limit equilibrium analyses
Influence of the number of slices
Analyses carried out for a range of numbers of slices, and for a range of slope angles from 25° to 80°, demonstrated that FOS and POF results converged to a constant value when the number of slices was 25 or greater. Increasing the number of slices beyond the value of 25 is therefore unnecessary if only the FOS and POF are of interest. This conclusion applies for both Mohr-Coulomb and Hoek-Brown criteria. However, an investigation of the effect of the number of slices on the location of the critical slip surface indicated that 25 slices may not be sufficient. In this investigation, rather than focusing on the failure surface location, the predicted failure volume was assessed since it depends on the failure surface location. The results are shown in Figures 2 and 3.
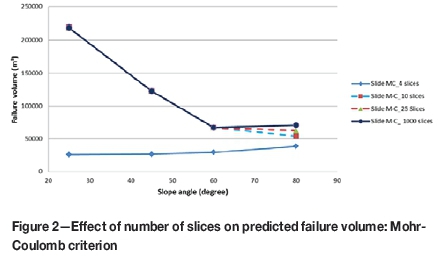

It can be seen that, for steeper slopes, the predicted failure volumes for both Mohr-Coulomb and Hoek-Brown criteria can be significantly greater with a greater number of slices. Thus, if risk is a parameter of interest in addition to stability, since risk (POF x Consequence) depends significantly on failure volume, a larger number of 1000 slices (the highest number of slices available in Slide) should be used for LE analyses, since predicted failure volumes converge with increased numbers of slices.
Slip surfaces
As indicated above, the default number of 5000 failure surfaces was adopted, and the 'optimize surface' option was chosen. The pseudo-random surface option was enabled to ensure repeatability of the results for the same seeds, with its seeds automatically generated (RocScience, 2008). The segment length was chosen to be auto-defined. No grid requirements were needed, since the program searched for the critical slip surfaces. The critical slip surface was that which gave the lowest FOS. The results presented in Figures 2 and 3 are also representative for the investigation of the influence of slope failure surface location.
A comparison of Figures 2 and 3 shows that for the shallower slopes, using the Mohr-Coulomb criterion in the evaluation of failure volume leads to lower sliding volumes than when the Hoek-Brown criterion is employed. This may be a reason behind the finding expressed in the literature that Slide underestimates the failure volume (Cheng, 2003; Han and Leshchinsky, 2004; Chiwaye and Stacey, 2010). For the steeper slopes, the two predictions for the failure volumes are much closer.
Influence of the variability in material properties
Analyses show that, for rock mass parameters following normal distributions, the Mohr-Coulomb criterion underestimates the POF at flatter slope angles and overestimates it for steeper slope angles. According to Hoek (2007), the Hoek-Brown criterion should have preference over the MohrCoulomb criterion in order to eliminate uncertainty due to the estimation of equivalent Mohr-Coulomb parameters.
Numerical modelling
LE methods require little computational effort and therefore the use of Monte Carlo analyses to take into account variability is efficient. However, the number of analyses required makes the full Monte Carlo analysis onerous for numerical models that involve large numbers of elements. Two techniques were considered for numerical analyses. These were the response surface method (RSM) (Tapia et al., 2007) and the point estimate method (PEM) (Rosenblueth, 1975). Thus, prior to the determination of the effects of technical factors on results from numerical modelling, it was decided to evaluate the comparative performance of these two techniques. This was done by comparing the results of analyses using the RSM and the PEM, also referred to as the full NM analysis. In these analyses, six-noded triangular finite elements were used, since they had demonstrated good performance previously (Chiwaye and Stacey, 2010). The evaluations involved the determination of probabilities of failure, and there was good agreement between the POF results from the two techniques. Therefore the use of the RSM is to be preferred, since it is less time-consuming than the PEM (Myers et al., 2009). The RSM was therefore used in all the further numerical analyses of slopes. A comparison of the results from the RSM, the full numerical analysis, and a full LE analysis, for both normal and lognormal distributions of variables, is shown in Figure 4. It can be seen that, for lognormal distributions, the RSM technique corresponds with the full numerical analysis perfectly. For normal distributions the RSM shows closer agreement with the full numerical analysis than does the full LE analysis. The RSM result will give a conservative prediction of POF.

Numerical modelling results
Types of finite elements
As indicated, alternatives of three-node and six-node triangular finite elements and four-node and eight-node quadrilateral finite elements were investigated. The accuracy of the results naturally also depends on the number of elements, and this is dealt with later. Figure 5 shows an example of one of the comparisons carried out for element types.
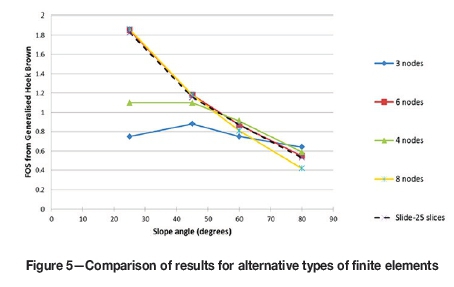
It is quite clear from Figure 5 that the three-node and four-node elements are inferior, and that the results for six-and eight-node elements are effectively equivalent. Based on this information, it was decided to make use of six-node triangular elements for all further analyses.
Numbers of finite elements
By varying the numbers of elements in the mesh, the sensitivity of slope factor of safety to the number of elements was determined, and the results are shown in Figure 6. Results of corresponding LE analyses are also shown for comparison purposes.
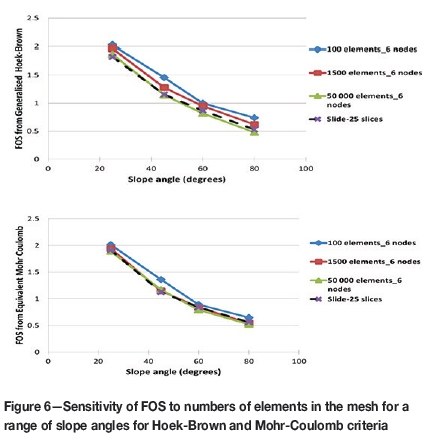
Irrespective of the type of failure criterion, there is a convergence of FOS values as the numbers of elements increase, but at the expense of running time. FOS trends for 1500 elements are just slightly different from those for 50 000 elements. Similar results were obtained when assessing the effect of element numbers on the POF.
The results in Figure 6 show the benefit of a large number of elements. The FOS results for LE analyses with 25 slices are almost identical to the numerical analysis values for 50 000 mesh elements. Lesser numbers of elements show greater discrepancies with the LE results, on the conservative side (larger FOS). It is suggested that 1500 six-noded elements could be used if the FOS is of primary interest. This suggestion is not valid in the case of the failure volume, which is very sensitive to the numbers of elements as illustrated in Figure 7. The LE analysis results are also shown for comparison.
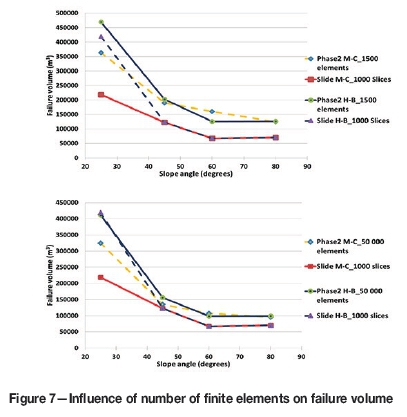
It is recommended that, whatever the failure criterion, the slope stability analyses will require 1000 slices and 50 000 elements for LE and NM methods, respectively, when assessing the failure volume.
Influence of boundary conditions on the risk of slope failure
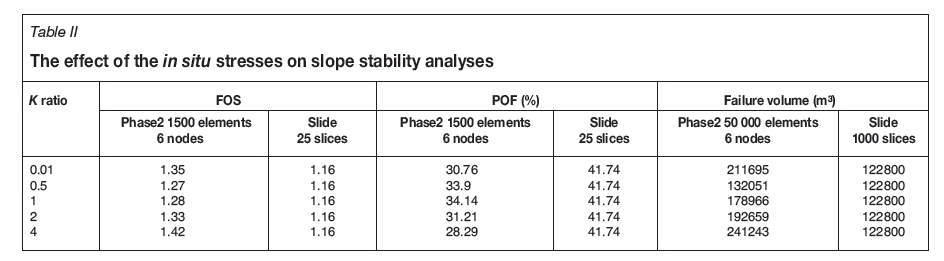
The two boundary conditions considered were the in situ stresses, and the LIS. Results of comparative analyses for a range of in situ stress K-ratios are shown in Table II. It can be seen that the probabilities of failure from the numerical analyses are substantially lower than those from the LE method. Since NM takes into account a greater number of influencing factors, its POF predictions are recommended. The predicted failure volumes, and therefore the risk, are, however, greater than those determined by Slide.
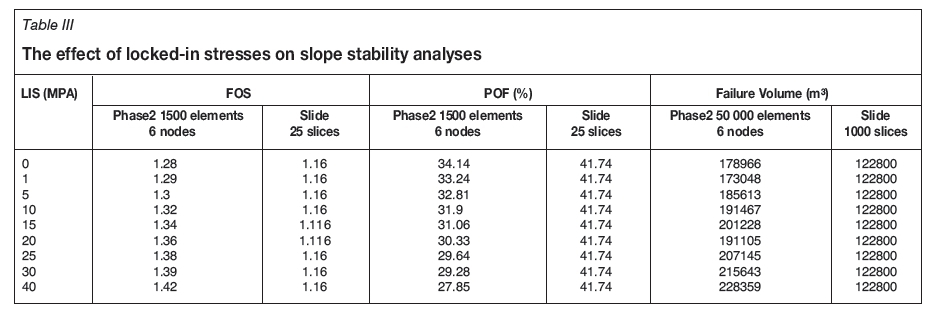
An increase in locked-in horizontal stresses results, similarly, in a reduction in the POF, but in an increase in the predicted failure volume and hence in the predicted risk. The results of the analyses are shown in Table III.
Results of the evaluation of the influence of material property variability on slope probability of failure and failure volume
LE and NM analyses were carried out to investigate the effect of material property variability on their outputs. The stability analysis results for the scenarios in Table I demonstrated that parameters other than the UCSi, GSI, and mi have minor impact on the FOS, but show that the influence on the POF and failure volumes, and thus on predicted risk, can be significant, as shown in Figures 8 and 9.

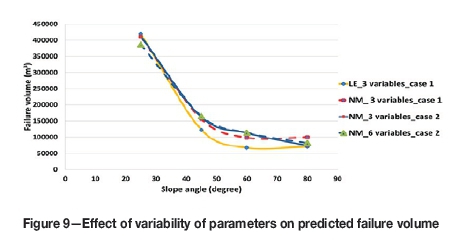
Although the discrepancies between the POF and failure volume results might appear small on these figures, they could have a significant effect on the risk. Minor differences could involve failure volumes of the order of thousands of cubic metres. Therefore, great care should be exercised when assessing the results of slope stability analyses and the effect on them of variability in input parameters.
Influence of dilation on risk of slope failure
An increase in dilation will have the effect of increasing the shear resistance on joint surfaces, and therefore could be expected to enhance the stability of slopes. Analyses show this to be the case, in that the risk of slope failure is very sensitive to a slight change in the dilation parameter.
Discussion and conclusions
The purpose of the research reported in this paper was to investigate the effects of a range of factors on the outputs of slope stability analyses. Of particular interest was the influence on the predicted risk associated with slope failure. It is acknowledged that the investigation was not an exhaustive one, and that there are numerous other factors of influence that have not been quantified (Keyter, 2015). Further factors are therefore raised here to bring them to the attention of readers.
Both the LE and numerical analysis methods used in this paper assume that cohesion and friction act in unison during the failure process; and this is the assumption in the shear strength reduction factor (SRF) approach used in the NM method (Diederichs et al., 2007). However, particularly in hard, brittle rock conditions (the conditions relevant for deep open pits, for example), during the failure process it is the cohesion that is destroyed first, and frictional resistance only builds up as failure progresses (Hadjiabdolmajid, 2001). The cohesion-weakening friction-strengthening criterion has been found to work well in such conditions, rather than the conventional Mohr-Coulomb and Hoek-Brown criteria. The SRF, as implemented, will therefore influence the result of the stability analysis, as noted by Diederichs et al. (2007). Deformation properties of the rock mass (modulus of elasticity and Poisson's ratio) will also affect the SRF, and consequently the failure volume and risk. The criterion of failure is in fact a complex consideration, since during the slope failure the mechanisms of failure are likely to change. Mechanisms involved in the initiation of failure and the propagation of failure may be different, and ideally both should be accounted for in the stability analysis (Stacey, 2006). Groundwater, which can have a significant effect on the stability of slopes, was another factor not considered in the analyses carried out.
Slope stability analyses commonly carried out, and as described in this paper, are two-dimensional. In contrast, slope failures are almost always three-dimensional. The three-dimensional geometry and the plan geometry affect both the stability of the slope and the extent of failure, if failure does occur (Stacey, 2006). The 3D factor will therefore have a significant effect on the volume of failure and the risk.
From the investigation of the influences of technical factors, rock mass parameters, and boundary condition factors on slope stability analyses, as described in this paper, the main conclusions are as follows.
► The Hoek-Brown criterion can be recommended for determination of FOS and POF, independently of the type of distribution of input parameters, and may contribute to avoiding any imprecision in POF calculations
► Using the Mohr-Coulomb criterion in the evaluation of failure volume leads to lower sliding volumes than when Hoek-Brown is employed. This may be a reason behind the finding expressed in the literature that Slide underestimates the failure volume
► For both FOS and POF analyses, 25 slices are reliable for building a Slide model. However, the determination of failure volumes requires a much larger number of slices (1000 slices, the maximum number in Slide)
► The FOS and POF results converge with an increase in the numbers of finite elements, independently of the applied failure criterion. Also, these results are obtained with significantly fewer elements when using six-noded and eight-noded elements
► Similarly to the LE results, the determination of FOS and POF requires only a limited number of elements (1500 elements for this research model), whereas the failure volume determination requires a larger number of elements (50 000 elements)
► NM methods always predict greater risk than the LE method. The latter technique does not take into account the K-ratio and the LIS, and therefore underestimates the predicted risk of slope failure.
Acknowledgement
Some of the research on which this paper is based was supported in part by the National Research Foundation of South Africa (grant-specific unique reference number (UID) 85971). The Grantholder (second author) acknowledges that the opinions, findings, and conclusions or recommendations expressed in any publication generated by the NRF-supported research are those of the author and that the NRF accepts no liability whatsoever in this regard.
References
Cheng, Y.M. 2003. Location of critical failure surface and some further studies on slope stability analysis. Computers and Geotechnics, vol. 30. pp. 255-267. doi:10.1016/S0266-352X(03)00012 [ Links ]
Chiwaye, H. and Stacey, T. 2010. A comparison of limit equilibrium and numerical modelling approaches to risk analysis for open pit mining. Journal of the Southern African Institute of Mining and Metallurgy, vol. 110, no. 10. pp. 571-580. [ Links ]
Diederichs, M.S., Lato, M., Hammah, R., and Quinn, P. 2007. Shear strength reduction approach for slope stability analyses. Proceedings of the 1st Canada-US Rock Mechanics Symposium. 8 pp. [ Links ]
Hadjiabdolmajid, V.R. 2001. Mobilization of strength in brittle failure of rock. PhD thesis, Department of Mining Engineering, Queen's University, Kingston. 268 pp. [ Links ]
Han, J. and Leshchinsky, D. 2004. Limit equilibrium and continuum mechanics-based numerical methods for analyzing stability of MSE walls. Proceedings of the 17th ASCE Engineering Mechanics Conference, University of Delaware, Newark, DE. Vol. 1, pp. 1-8. [ Links ]
HOEK, E. 2007. Rock mass properties. Practical Rock Engineering. Rocscience Inc. http://www.Rocscience.com/hoek/corner/11_Rock_mass_properties.pdf [ Links ]
Hoek, E., Carranza-Torres, C., and Corkum, B. 2002. Hoek-Brown failure criterion -2002 edition. Proceedings of NARMS-Tac. pp. 267-273. [ Links ]
Hustrulid, W.A., McCarter, M.K., and van Zyl, D.J.A. 2000. Slope Stability in Surface Mining. Society for Mining, Metallurgy, and Exploration, Littleton, CO. [ Links ]
Kanda, M.J. 2015. Limit equilibrium and numerical modelling approaches in slope stability analyses with regard to risk assessment for open pit mining. MSc dissertation, University of the Witwatersrand. 137 pp. [ Links ]
Keyter, G.J. 2015. Personal communication. [ Links ]
Myers, R.H., Montgomery, D.C., and Anderson-Cook, C.M. 2009. Response Surface Methodology: Process and Product Optimization Using Designed Experiments (3rd edn). Wiley, Hoboken, NJ. [ Links ]
Nian, T.K., Chen, G.Q., Wan, S.S., and Luan, M.T. 2011. Non-convergence criterion on slope stability FE analysis by strength reduction method. Journal of Convergence Information Technology, vol. 6, no. 5. pp. 78-88. [ Links ]
Rathod, G.W. and Rao, K.S. 2012. Finite element and reliability analyses for slope stability of Subansiri Lower Hydroelectric Project: a case study. Geotechnical and Geological Engineering, vol. 30. pp. 233-252. [ Links ]
Read, J. and Stacey, P. 2009. Guidelines for Open Pit Slope Design (1st edn). CRC Press. [ Links ]
Rocscience Inc. 2008. SLIDE version 5.0 User Manual. [ Links ]
Rocscience Inc. 2009. Phase2 version 7.0 User Manual. [ Links ]
Rosenblueth, E. 1975. Point estimation for probability moments. Proceedings of the National Academy of Science USA, vol. 72. pp. 3812-3814. [ Links ]
Stacey, T.R. 2006. Considerations of failure mechanisms associated with rock slope instability and consequences for stability analysis. Journal of the Southern African Institute of Mining and Metallurgy, vol. 106, no. 7. pp. 485-493. [ Links ]
Tapia, A., Contreras, L.F., Jefferies, M.G., and Steffen, O. 2007. Risk evaluation of slope failure at Chuquicamata Mine. Proceedings of the International Symposium on Rock Slope Stability in Open Pit Mining and Civil Engineering. Australian Centre for Geomechanics, Perth. pp. 477-485. [ Links ]
Ureel, S. and Momayez, M. 2014. An investigation of the limit equilibrium method and numerical modeling for rock slope stability analysis. Rock Mechanics and its Applications in Civil, Mining, and Petroleum Engineering. Proceedings of the Geo-Shanghai 2014 International Conference, Shanghai, China, 26-28 May 2014. Zhang, L. and Wong, E.L.N.Y. (eds.). Geotechnical Special Publication 237. American Society of Civil Engineers. pp. 218-227. [ Links ]
Wyllie, D.C. and Mah, C. 2004. Rock Slope Engineering. CRC Press. [ Links ]
Paper Received May 2016
Revised Paper Received Aug. 2016

