


Services on Demand
Article
 English (pdf)
 Article in xml format
 Article references
Indicators

Related links
-
 Cited by Google
 -
 Similars in Google
Share

 Permalink
Journal of the Southern African Institute of Mining and Metallurgy
On-line version ISSN 2411-9717
Print version ISSN 2225-6253
J. S. Afr. Inst. Min. Metall. vol.116 n.11 Johannesburg Nov. 2016
http://dx.doi.org/10.17159/2411-9717/2016/v116n11a1
WITS SPECIAL EDITION - VOLUME I
The influence of test specimen geometry on the laboratory-determined Class II characteristics of rocks
U.W.O.L Vogler; T.R. Stacey
University of the Witwatersrand, Johannesburg, South Africa
SYNOPSIS
The behaviour of rocks depends on their material properties, and therefore it is important that these properties are determined by relevant and reliable laboratory testing methods. The ISRM Suggested Methods are very important documents in this regard, and a draft suggested method exists for the determination of the 'complete stress-strain curve for intact rock in uniaxial compression'. The method specifies the required geometry of specimens and the required testing procedures. The research described in this paper involved the determination of complete stress-strain curves for two materials, one exhibiting the Class I characteristic, and the other the Class II characteristic. To obtain a better understanding of the deformation behaviours in the post-peak region, tests were carried out on specimens of both material types with different length-to-diameter ratios. The results showed that the geometries of the test specimens influence the stressstrain curves in the post-peak region. The implication is, therefore, that the numerical values obtained for the slopes of the post-peak graphs are not material constants, but are geometry-dependent. Explanations for this behaviour are given. These findings have important implications regarding the use of post-peak data, for example for blast fragmentation considerations, and for evaluation of rockbursting potential. The research findings are based on a limited amount of laboratory testing, and should be confirmed by further testing.
Keywords: rock characteristics, Class I behaviour Class II behaviour, servo-controlled test, post-peak characteristics, specimen geometry, brittleness.
Introduction
The most common approach for studying the behaviour of rock is by compression testing of cylindrical specimens in the laboratory. Rocks respond to forces by deforming and eventually breaking. The strength and the deformation characteristics are derived from the stressstrain curves produced. Standard shapes and sizes for the test specimens and standard loading rates are recommended in the Suggested Methods of the International Society for Rock Mechanics (ISRM) and the American Society for Testing and Materials (ASTM) standards. In spite of these standards, there remain certain aspects of testing which require further attention. The research described in this paper deals with deformation and failure behaviour of rock materials using stiff, servo-controlled testing equipment. The particular objective was to test the premise that the behaviour of cylindrical rock specimens in the post-peak region of the stress-strain curves does not reflect only a material characteristic, but is influenced by the height-to-diameter ratio (the geometry) of the rock specimen. An additional objective was to investigate the effect of the stiffness of the test equipment on the outcomes of tests.
Behaviour of rock specimens in laboratory tests
Rocks have traditionally been regarded as brittle materials because their maximum load-bearing capacity and the stress at the point of rupture have been observed to be practically the same. In addition, rupture generally occurs in a violent, explosive mode. However, with the advent of improved testing equipment and the development of better testing procedures, it has been observed that the stress at rupture does not necessarily coincide with the stress at strength failure. One such development was the introduction of deformation or strain control instead of load or stress control when applying load to the test specimens. This led to the realization that a uniaxial compression test specimen does not necessarily have zero load-bearing capacity after its strength failure. Cook (1965) concluded that the violent rupture behaviour was due to excess energy stored in the elastic components of the testing machine. As a result of this finding, stiff testing machines were developed, as described by Cook and Hojem (1966), Bieniawski et al. (1969), and Stavrogin and Tarasov (1995, 2001).
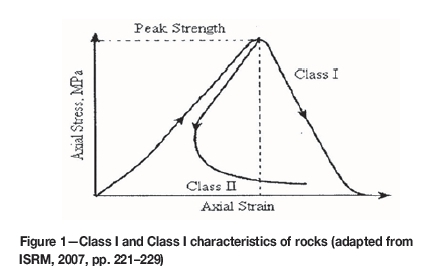
Although the use of stiff testing equipment provided information on the stress-strain behaviour of rocks in the post-peak region, it was still not always possible to trace the complete deformation behaviour. Using loading and rapid unloading cycles, Wawersik (1968) succeeded in obtaining complete stress-strain curves. He observed that for some rock types the slope of the post-peak curves was negative (which he designated as a Class I characteristic), and for other rock types the slope was positive (designated as a Class II characteristic), as illustrated in Figure 1.
The practical implication of these observations is that, even with an infinitely stiff testing machine, it would still not be possible to trace the full stress-strain curves for rocks with Class II behaviour due to the elastic energy stored in the rock specimens themselves (Wawersik and Fairhurst, 1970).
Class I and Class II characteristics
Before dealing with the research results, it is appropriate to set the scene by describing the Class I and Class II characteristic behaviours and associated energy requirements. Class I and Class II behaviours differ fundamentally, the cause being the quantities of elastic energy stored in the test specimens. The graph in Figure 2 illustrates typical Class I deformation behaviour.
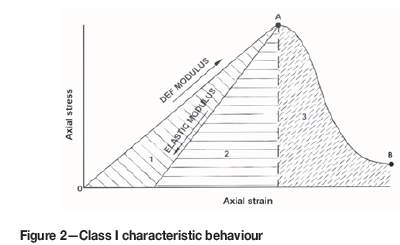
In such tests, energy must be provided to the specimen continuously. If testing equipment with insufficient stiffness is used, it accumulates elastic strain energy, which at A may exceed the energy 'required' by the rock specimen and cause violent rupture of the specimen. However, with a sufficiently stiff testing machine, the elastic strain energy stored will be less than the energy required by the test specimen. The system (test specimen plus machine) is then stable and additional energy must be supplied to continue the test from A to B. Testing machines with sufficient stiffness thus allow the post-peak behaviour of rocks to be traced, exhibiting the Class I characteristic successfully. The significance of the shaded areas in Figure 2 is as follows:
Areas 1+2+3 Total energy supplied by the testing machine to take the test specimen from O to B
Areas 1 + 2 Energy supplied to the test specimen at the peak strength (point A)
Area 1 Non-recoverable energy absorbed by the test specimen during loading (energy required for plastic deformation, crack formation and extension, heat)
Area 2 Elastic energy available in test specimen at point A
Area 3 Additional energy to be supplied by the testing machine to continue the test from A to B.
During typical Class I behaviour, the axial strain increases monotonically from O. Whether the behaviour is of Class I or Class II mode, the lateral strains, not shown on the explanatory diagrams, increase monotonically during the whole deformation process.
In contrast with the above, typical Class II behaviour is illustrated in Figure 3.
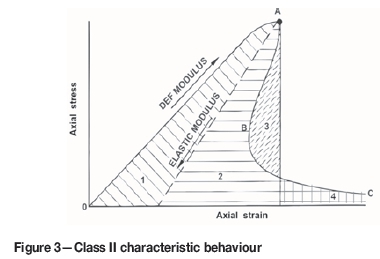
For rocks with a Class II characteristic, in a compression test the axial strain increases from O to A, decreases from A to B, and increases again between B and C. Energy must be provided to the specimen up to point A. Thereafter, some of the energy must be withdrawn, and subsequently energy must be supplied again to continue the deformation process. The energy distribution is explained by means of the shaded areas in Figure 3 as follows:
Areas 1 + 2 + 4 Energy to be supplied by the testing machine to take the test specimen from O to C
Areas 1 + 2 + 3 Energy supplied to the test specimen at the peak strength (point A)
Area 1 Non-recoverable energy absorbed by the test specimen during loading (again, energy required for plastic deformation, crack formation and extension, heat)
Areas 2 + 3 Elastic energy available in the test specimen at point A
Areas 2 + 4 Energy required to continue the test from A to C
Area 3 Excess elastic energy stored in the test specimen, which is the energy available in the specimen, but not required for further deformation. In order to achieve controlled testing from A to C, and to avoid uncontrolled, violent failure, this surplus elastic energy must be rapidly removed by the testing machine. If the rate at which energy can be extracted is sufficiently rapid, failure of the specimen will be controlled; if not, violent failure will take place.
When testing rock specimens with a Class II characteristic, it is essential that excess elastic energy can be rapidly extracted from the test specimen and from the testing equipment. The combination of test specimen and test equipment is referred to as the test system. The elastic energy stored in the test equipment can be minimized by designing the equipment to be as stiff as possible. By using servo-controlled testing equipment, elastic energy can be rapidly extracted. This is dealt with in the next section.
The introduction of servo-controlled testing machines
Further development from Wawersik's work required a new approach to the testing of the post-peak behaviour of rock. Hudson and Harrison (1997) commented: 'Following the pioneering work by Cook, Bieniawski, Fairhurst and Wawersik in the late 1960s, it was realized that such stiff testing machines are inherently cumbersome and functionally inflexible. This led to the introduction of servo-controlled testing machines for obtaining the complete stress-strain curve for rock. It is important to note that the means by which a servo-controlled testing machine is able to follow the post-peak curve is different in principle and implementation from the stiff testing machines'.
The development of stiff, servo-controlled testing machines has greatly improved the chances of successfully investigating Class II behaviour of brittle rock materials. The required test procedure is programmed, and the data acquisition and control are handled by computers with the appropriate software. Feedback signals from transducers monitoring the specimen behaviour are continuously compared with the required testing programme and any deviations are addressed by the signals sent to the rapid-response servo valve system.
Methods of controlling testing machines
Before the introduction of servo-controlled testing machines it was customary to apply load to test specimens at either a controlled loading rate or at a controlled deformation rate. Since the introduction of computerized servo-controlled equipment it has been possible to make use of additional variables, such as quantities measured during the tests, as feedback signals for programming further progress of the tests. Most researchers have used circumferential strain for control of testing machines. The reason for this is that the circumferential strain increases monotonically regardless of whether the specimen behaviour is Class I or Class II. This is the recommended method in the ISRM Suggested Method (ISRM, 2007, pp. 221-229). Alternative methods of control have been suggested by Okubo and Nishimatsu (1985), Okubo et al. (1990), and He et al. (1990).
It is to be noted that, as indicated in ISRM (2007, pp. 221-229), for extremely brittle rock, the available techniques are not sufficient to ensure a successful outcome in uniaxial testing. It is implied that confined state testing and low length-to-diameter ratio specimens may be employed. In this context, a successful test is one for which the full stressstrain curve can be traced. In effect, the implication is that the post-peak behaviour and its determination are not fully understood.
Although the use of servo-controlled test systems is indispensable for tracking stress-strain behaviour in the post-peak region, the role of the stiffness of the equipment should not be underestimated, and this is discussed in the next section.
Stiffness of the test equipment
The mechanical stiffness of the testing machine is a very important factor because the excess elastic energy stored in both equipment and specimen must be extracted. The combination of stiff equipment and rapid-acting servo-hydraulic control systems will therefore maximize the chances of successfully tracing the complete stress-strain curve.
According to Hooke's Law, the stiffness of an elastic body (K) is defined as the force per unit displacement. A testing machine may be regarded as a combination of elastic spring elements. The machine thus reacts like a complex arrangement of springs in series and parallel. Typical components are not only the columns, crossbars, loading platens, and spacers, but also the height of the column of hydraulic oil, the hydraulic pipes, fittings, and even the devices for measuring the hydraulic pressure.
Theoretically, it is possible to calculate the stiffness for a given testing machine, and the combination of all the above elements should result in a constant value for the stiffness. However, personal observations by the first author have revealed that as result of years of handling, the surfaces of, for example, the test machine spacers have developed minute ridges and dents. Such features, as well as mismatches, for example surface flatness and non-parallelism, will influence the effective stiffness of the system and can even result in a non-constant value for the stiffness. Theoretical calculations of the stiffness can therefore, at best, be only approximations. A practical, experimental method for the determination of the actual mechanical stiffness of a testing machine is proposed in the following section.
Proposed practical method for the determination of the actual mechanical stiffness of a testing machine
The results of partially constrained swelling strain tests that were performed previously have been reviewed specifically in the context of the research dealt with in this paper. The behaviour of a specimen in a swelling pressure test can be described as follows.
► During the swelling process the length of the rock test specimen gradually increases, but the increase is restricted by the resistance of the test apparatus
► Due to the restriction offered by the equipment, a swelling pressure develops
► The force resulting from the swelling pressure acts against the equipment and causes it to deform , This allows the test specimen to swell further until equilibrium is reached
► The interaction between the force (resulting in stress) and the equipment deformation (resulting in strain) is proportional to the effective stiffness of the test equipment. Thus the slope of this relationship is a function of the stiffness of the equipment and is not the property of the rock tested. On the other hand, the final asymptotic values for the stress and the strain do represent the properties of the rock
► By calculating the load increment (ΔN) and the increment in deformation (Δm) from the measured stress and strain, the stiffness of the test apparatus can be calculated as K = ΔΝ/Δ/κ.
It is now possible to consider, critically, creep tests and relaxation tests. When performing creep tests, the load on a test specimen is kept constant while the deformation is monitored over time. A creep testing apparatus may thus be regarded as infinitely soft. If a hypothetical, infinitely stiff apparatus were used for creep tests then the load would fall off to zero as soon as the test specimen deforms, and the experiment would come to an immediate end. For relaxation tests, loads (or stresses) are applied to a desired stress level and thereafter no further (external) actions are taken by the test equipment. The relaxation strain over time is then monitored. An example of the observations made during such a test (Bieniawski, 1971) is presented in Figure 4.
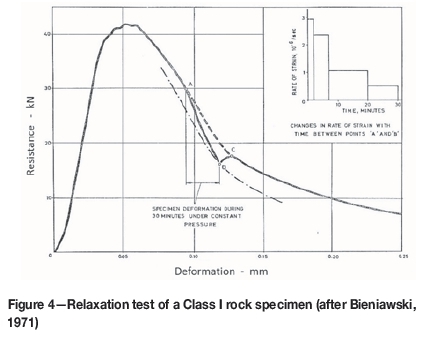
If it is possible to keep piston displacement constant, as is the case with servo-controlled testing machines, then, as was the case with the test reported by Bieniawski (1971) using stiffening columns, the relaxation behaviour can be used to calculate the actual mechanical stiffness of the testing apparatus. The reasoning behind this statement is as follows:
► Unless failure takes place, the force exerted on the specimen is always equal to the resistance force of the specimen
► The deformation of the test specimen due to relaxation allows equal deformation of the testing apparatus, which causes elastic rebound according to its stiffness and thus a reduction in the load applied to the specimen
► The reduced applied load influences further relaxation, which will continue until equilibrium is reached
► The measured relaxation path is linear because it is dictated by the elastic behaviour of the apparatus. From the slope of the load-deformation curve the actual mechanical stiffness of the testing apparatus can be calculated
► Also, from these observations it may be concluded that the rate of relaxation is dependent on the effective stiffness of the equipment used for the tests.
When scaling values from A to B in Figure 4, the changes in load and deformation are 13.4 kN and 0.0243 mm respectively. The calculated, actual stiffness of the equipment, K, is therefore ΔΝ / Δm
= 13.4 x 10⁶ / 0.0243
= 0.55 GN/m.
The proposed method for determining the stiffness of the equipment will work for Class I type behaviour tested in a relatively stiff testing machine. When testing material of Class II type behaviour, or if the stiffness of the machine is insufficient for controlling Class I type behaviour, then instability of the test system will not allow the proposed method. Relaxation tests for the purpose of stiffness calculations may then be performed during the pre-peak loading phase of the tests, regardless of Class I or Class II behaviour. If the specimen is stressed to above the level of the 'onset of unstable fracture propagation' (Bieniawski, 1971), then sufficient data should be generated to perform the calculations.
Experimental investigations
In this section the experiments conducted for investigating the premise stated in the Introduction are documented. From the information provided in the previous section, it is clear that:
► The post-peak strength and deformation behaviour of rock are not fully understood
► The elastic energy stored in the unfailed portions of the test specimen determines the slope of the post-peak curve
► The post-peak behaviour is influenced by the test specimen geometry.
The objective of the experimental programme was therefore to confirm that Class I or Class II behaviour of rock in laboratory testing is partially a test specimen phenomenon and not solely a characteristic of the rock material.
This laboratory investigation was designed to test specimens of the same rock material, with the same diameters but with different height-to-diameter ratios. It was expected that the contribution of the elastic response of the unfailed portions of the test specimen relative to the overall deformation response would result in significant differences in the post-peak behaviour. The slopes of post-peak curves were thus expected to be affected, with the implication that apparently even the brittleness (Tarasov and Potvin, 2013) will be different.
Testing programme
For testing the premise, rock types showing Class I and Class II behaviour were required. The testing programme adopted consisted of three phases as follows:
► Testing a material with Class I type behaviour. A stabilized soil material was found which could be tested in an ordinary 'soft' testing machine
► Selecting a rock material of medium to high strength that would behave in a Class II fashion. Anorthosite was chosen and a preliminary uniaxial test was conducted to confirm its suitability
► Conducting the main series of tests on anorthosite, which involved triaxial tests at a relatively low confining pressure.
Determination of post-peak behaviour of a stabilized soil material
A cement-stabilized soil of granitic origin was used for the tests (Mgangira, 2008). The soil/cement mixture was stamped manually into cylindrical moulds. The length of the moulds allowed for 'standard' size and shape specimens with a diameter of approximately 102 mm and height-to-diameter ratio of approximately 1.15. In addition to specimens with the standard height-to-diameter ratio, a specimen with height-to-diameter ratio of 2.3 was formed by using two standard specimens, one on top of the other; and a further specimen with height-to-diameter ratio of 3.4 was made up using three standard specimens. Although the test specimens were 'hand-made', their densities were remarkably constant. All the specimens were prepared on the same day.
To ensure that all specimens had the same curing age, all tests were performed on the same day. The tests showed that the stabilized soil exhibited Class I behaviour. Owing to the very low strength of the material, it was possible to record the full stress-strain behaviour even when using a very 'soft' type of testing machine with the applied loads controlled manually. In addition, elastic recovery was observed on unloading at the end of the tests.
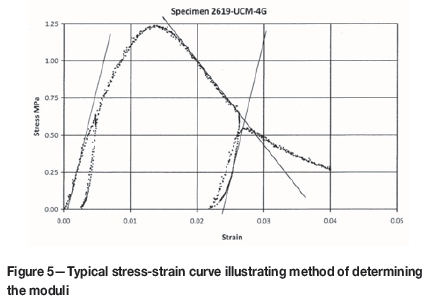
Evaluation and presentation of results
Stress-strain curves were plotted for the data obtained, and an example is shown in Figure 5. Average deformation moduli for the pre-peak region of the curves were calculated, and average values for the post-peak deformation moduli were determined by selecting a linear region of the descending part of the curves. The 'elastic' moduli for the unloading curves of the cycles in the post-peak region of the stress-strain curves were determined as tangent values, calculated at a stress of 0.25 MPa. The results obtained for all the stabilized soil tests are summarized in Table I.
Tests on stabilized soil (Class I)
In this discussion, the term 'elastic modulus' is used for the slope of a curve during unloading. This is because during unloading, the strain recovery as result of the decrease in stress is elastic. Unloading should not be confused with the post-peak reduction of load, the latter being due to the decrease in load-bearing capacity of the, by then, partially fractured specimen. The term 'deformation modulus' is used for the rest of the evaluations because in both the pre-peak and the post-peak regions of the curve, the non-elastic, (non-recoverable) strains influence the slopes of the curves. During the tests the formation of predominantly vertical surface extension cracks was observed, as shown in Figure 6.
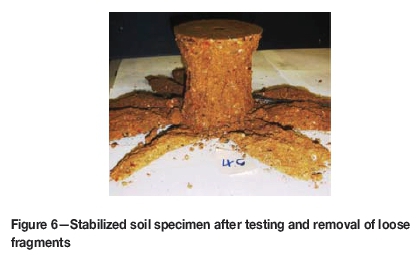
The fragments resulting from the formation of the extension cracks caused a reduction in the effective cross-sectional areas of the tested specimens, which affected the stresses and strains and hence also affected the calculated deformation moduli. However, this does not invalidate the conclusions.
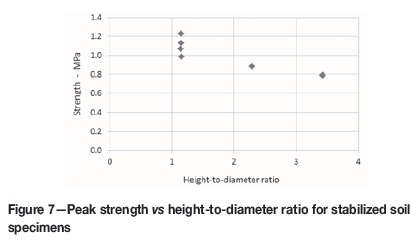
Strength
The strength is the maximum load-bearing capacity of the test specimens and is thus the stress at the peak of the stress-strain curve. Figure 7 shows strengths determined for specimens with different height-to-diameter ratios. The following may be observed from Figure 7.
► The strengths for the four 'standard' sized specimens, i.e. the specimens with height-to-diameter = 1.1, vary from 0.99 MPa to 1.23 MPa, the average strength being 1.10 MPa and the range 0.24 MPa (approx. 22%). The variability is reasonable considering the type of soillike material and the fact that the specimens were formed manually. The variation is unfortunate, however, since only one specimen could be tested for each of the other two height-to-diameter ratios
► The strength shows, as expected, a clear decrease with increasing height-to-diameter ratio, which is in line with findings for rock (John, 1972; Mogi, 1966). In testing of rocks it is commonly accepted that the strength is constant for height-to-diameter ratios of > 2.5. ASTM D7012 recommends an H/D ratio of between 2.0 and 2.5, while the ISRM (2007, pp. 153-156) recommends 2.5 to 3.0.
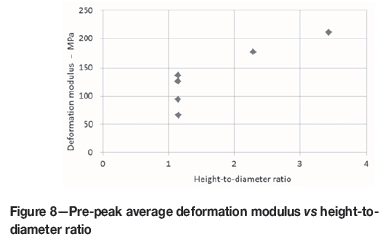
Pre-peak deformation modulus
Figure 8 plots the 'average' deformation modulus against height-to-diameter ratio, and shows that:
► The pre-peak deformation moduli for the four standard size specimens vary between 66 MPa and 137 MPa. The average value is 106 MPa and the range is 71 MPa (approx. 67%). Again, this variation is large, but may be expected considering the variation in strength
► The deformation modulus increases with increasing height-to-diameter ratio. This trend is unexpected, but may be a result of the reduction of cross-sectional area, as mentioned above.
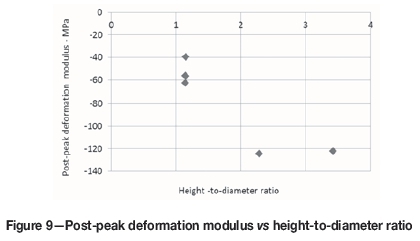
Post-peak deformation modulus
In the post-peak regions of the stress-strain curves, the deformation moduli have been evaluated as average slopes. The post-peak deformation moduli plotted against height-to-diameter ratio (Figure 9) show that:
► Post-peak deformation moduli for the four standard-sized specimens vary between -40 MPa and -63 MPa, the average being -54 MPa and the range 23 MPa (approx. 43%)
► Post-peak deformation moduli for the two specimens with larger height-to-diameter ratios are significantly lower than those for the standard-sized specimens.
► There is thus a definite trend of decrease of post-peak deformation modulus with increasing height-to-diameter ratio. These observations may be explained by means of the schematic diagrams depicted in Figure 10. Note that straight-line trends have been illustrated, although in reality the trends are nonlinear. The effect of time (relaxation, creep) has been ignored.
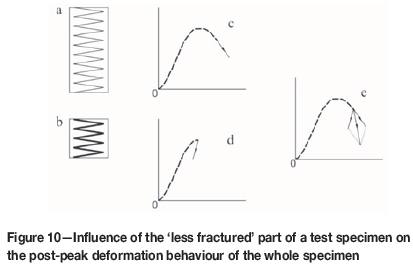
The diagrams in Figure 10 depict the following:
(a) Shows part (say the top part) of the specimen with fractured portions in series with part
(b) (say the bottom part) of the specimen, which is unfractured or less fractured
(c) The top part of the specimen will deform in the standard manner, while on reduction of stress the bottom part
(d) will react elastically in a much stiffer mode. The elastic components of the deformations may be likened to springs with different stiffnesses
(e) For the total (combined) specimen the actual slope of the post-peak curve will be a combination of the modes of deformation of the individual parts.
It may therefore be concluded that the longer the test specimen, the more the angle of the post-peak curve will rotate in a clockwise direction. In case of Class I behaviour, this will result in steeper slopes and thus higher negative values for the moduli calculated.
Elastic modulus on unloading
The shape of the unloading curve of the second, post-peak unloading cycle is continuously nonlinear and concave-shaped. The 'tangent' slopes of the unloading parts of the stress-strain curves were thus all determined at a stress value of 0.25 MPa. Only four such unloading curves were available for evaluation. Figure 11 shows the tangent elastic moduli plotted against height-to-diameter ratio.
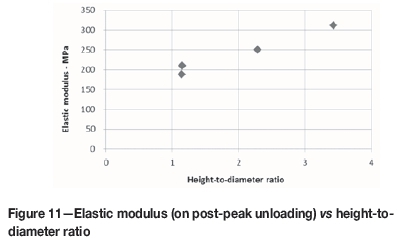
This shows a significant direct relationship of increasing E-modulus with increasing height-to-diameter ratio. Increasing E-modulus means increasing stiffness, which in turn means a smaller negative strain increment for the same stress decrease. The schematic diagrams in Figure 12 illustrate this, with the same explanations as for Figure 10.
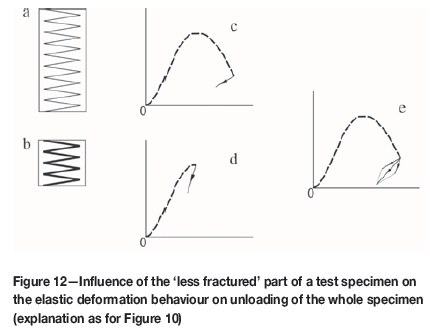
From the above it may be concluded that the longer the test specimen, the more the angle of the tangent to the unloading curve will rotate in an anticlockwise direction. This rotation will result in steeper slopes and thus higher positive values for the elastic moduli. Thus on final, post-peak unloading, there is a significant direct relationship of increasing E-modulus with increasing height-to-diameter ratio.
Angle of predominant failure plane
The following was observed from the test results:
► For the 'standard' specimens, the dominant failure plane is diagonal. The angle between the plane and the axis of the cylindrical specimen is approximately 45°, as illustrated in Figure 6
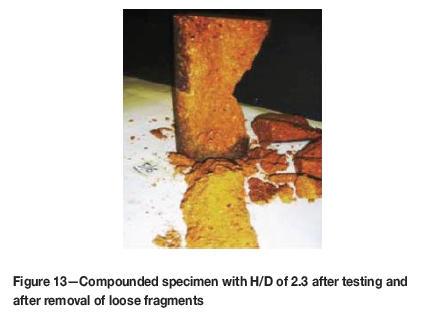
► For the specimen with height-to-diameter ratio of 2.3, the main failure plane is again diagonal. The angle between the plane and the axis of the cylindrical specimen is approximately 24°, as can be seen in Figure 13
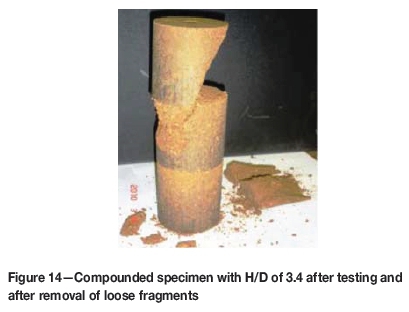
► In contrast with the above two observations, for the specimen with a height-to-diameter ratio of 3.4, the main failure plane is not diagonal, but approximately 21° (see Figure 14)
► It may thus be seen that for specimens with greater height-to-diameter ratios, a relatively larger portion of the total specimen is less fractured than the rest.
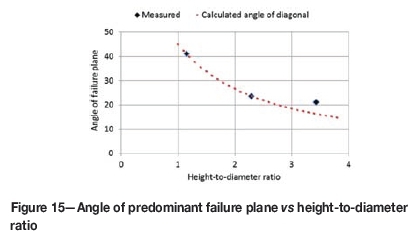
A plot showing the angle of the predominant failure plane against test specimen height-to-diameter ratio is given in Figure 15. For the shorter specimens the angle of failure is equal to the angle of the diagonal of the specimen. For the longest specimen the angle is not equal to the angle of the diagonal, but might have approached a constant value at the height-to-diameter ratio of about 2.5 (as is the case for anorthosite, reported later).
Conclusions from the tests on stabilized soil
From the abovementioned observations the following may be concluded:
► The stabilized soil shows a very typical Class I characteristic
► It has been confirmed that the stress-strain behaviour of the stabilized soil material in the post-peak region is influenced significantly by the geometry of the test specimens
► The behaviour is thus not only a material characteristic, but also a specimen characteristic
► The findings emphasize the importance of standardized test methods to allow assessment and comparison of results of tests
► This type of artificial model material offers possibilities of further studying the post-peak behaviour of Class I type materials, using conventional 'soft' testing machines and simple, inexpensive equipment.
Determination of the post-peak behaviour of spotted anorthosite
For the purposes of testing the premises listed in the Introduction, a rock material capable of delivering repeatable test results was necessary. The requirements for such a rock material may be summarized as follows:
► The rock material has to be reasonably homogeneous so as to provide repeatable results
► The rock should preferably be 'medium strength' to 'high strength': between 50 MPa and 200 MPa, according to the classification by Deere and Miller (1966). It was hoped that a rock material with this strength would exhibit Class II behaviour, but not be too brittle, therefore allowing the available servo-controlled testing equipment to control and trace the complete stress-strain curves
► The rock should have a Poisson's ratio >0.2, to provide sufficient radial expansion for the input signal to the servo-controller of the testing machine.
Anorthosite was chosen for this series of tests. It is relatively easy to obtain since it is present in the Bushveld Complex, and is abundant in the mines in the Rustenburg area. It is a very relevant rock type with regard to platinum mining in the Bushveld Complex. A preliminary test was performed on an anorthosite specimen to ensure that this rock type would be suitable for the main testing programme. The observations made and the conclusions drawn were as follows.
► The strength of the anorthosite specimen tested was 97 MPa, which falls in the upper region of a medium strong rock (Deere and Miller, 1966)
► Load cycling did not significantly influence the subsequent stress-strain behaviour
► The anorthosite showed high lateral strain, as required for feedback control, and it could therefore be expected that the stress-strain behaviour could be successfully monitored in the post-failure region in a servo-controlled testing machine.
The anorthosite was thus accepted for the tests.
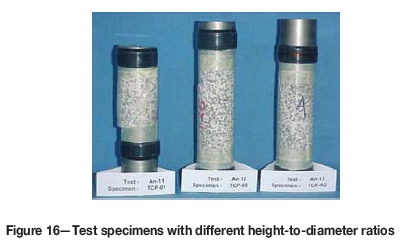
The aim of this series of tests was to determine the influence of the geometry of test specimens on their behaviour. The decision was taken to perform triaxial compression tests rather than uniaxial tests, so as to improve the chances of successfully monitoring the complete stressstrain curves for specimens with non-standard, large height-to-diameter ratios. A relatively low confining pressure of 10 MPa was therefore used for all tests. 10 MPa was considered 'relatively low' because it is only about 10% of the UCS of the anorthosite. The tests were performed in an MTS servo-controlled testing machine. The maximum length of test specimen plus loading platens (end caps) recommended by MTS is 214 mm. Core diameters of 42 mm were chosen and thus the maximum height-to-diameter ratio that could be tested was 3.5, with the nominal range from 1.5 to 3.5. Extra-long and extra-short loading platens had to be manufactured so that the height of test specimen plus applicable loading platens was suitable for the test cell. Figure 16 shows three specimens with different height-to-diameter ratios between loading platens with different heights (photographs taken after testing).
Test procedure
The test procedure adopted is described in detail in the following paragraphs using the axial stress vs time graph for a test specimen. The programme for each test consisted of several phases as illustrated in Figure 17, showing the axial stress vs time curve for the specimen.
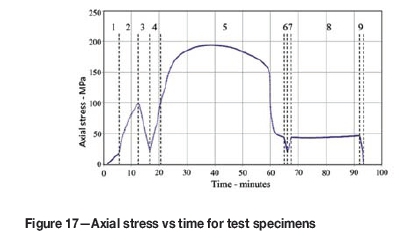
The test phases were as follows.
► Phase 1-Initial phase. After a minor 'zero' load, the confining hydraulic pressure was applied simultaneously with the axial stress. Ideally, as suggested in ISRM (2007, pp. 159-164), the axial stress should be applied in 'hydrostatic' mode, i.e. axial stress σax should be equal to the confining stress (the hydraulic pressure P). In practice it is advisable to ensure that σax > P to prevent the loading piston from losing contact with the specimen. This phase lasted until a hydraulic pressure of 10 MPa was reached
► Phase 2-Application of axial load. The constant confining pressure of 10 MPa was maintained while the axial load was gradually increased. The rate of load application was automatically controlled by the servo-controller in such a way that a circumferential strain rate of approximately 0.36 millistrain per minute was maintained
► Phase 3-First unloading cycle. This unloading cycle commenced automatically at a stress level of 100 MPa. Unloading took place at a rate of 25 kN/min, corresponding with a stress rate of about 18 MPa/min. Unloading from 100 MPa to 20 MPa took approximately 4.5 minutes
► Phase 4-Reloading at the same stress rate of 18 MPa per minute to approximately 100 MPa
► Phase 5-At this stress level of approximately 100 MPa, further load increase was again automatically regulated by the servo-controller at the circumferential strain rate of approximately 0.36 millistrain per minute. This was continued until and beyond the peak stress (strength)
► Phase 6-Second unloading cycle, controlled as during phase 3 unloading. The timing of the second unloading cycle changed during the testing programme, as will be discussed later
► Phase 7-Second reloading cycle, as during phase 4
► Phase 8-Final loading phase, again regulated at approximately 0.36 circumferential millistrain per minute. This phase was continued until the curves were levelling off
► Phase 9-Eventual unloading.
Evaluation of deformation characteristics
From the data-sets, graphs showing the curves were printed. Best-fit tangent lines were drawn by eye to these curves and used to determine the moduli. All the specimens exhibited Class II behaviour. In the case of the slopes in the post-failure regions, the least steep parts of the curves, where the influence of the elastic rebound is at its maximum, were selected.
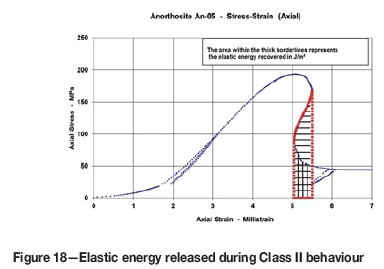
Evaluation of work/energy recovered
The work done or the energy used is equal to the area under the load-deformation curves, whereas the work done or the energy used per unit volume is equal to area under the stress-strain curves. The elastic energy released by the specimen during Class II behaviour is illustrated by means of Figure 18, which shows the elastic energy released per unit volume of the test specimen in the post-failure region of the stress-strain curve. The horizontally shaded area represents the energy released. Part of this energy, the vertically shaded area, is subsequently required for further deformation. The total work done to deform the specimens from zero to a strain of 0.7% (or 7 millistrain) was calculated. Testing proceeded until the stress-strain curves were levelling off, which occurred at values between 5.8 and >8 millistrain. In two cases the tests were terminated prior to reaching the 0.7% target. For purposes of evaluation, the latter curves were extrapolated slightly, which was acceptable because the curves had levelled off in any case.
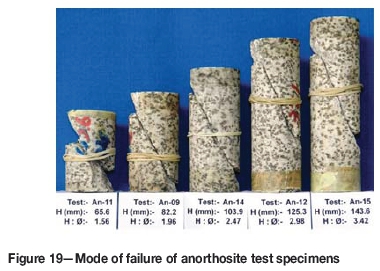
Determination of the angle of failure
Localized failure planes resulted in all the successful tests. All failure planes were single planes and were approximately flat, particularly for the test specimens with height-to-diameter ratios >2. Figure 19 shows examples of single failure planes.
Three methods for measuring the angles of the planes relative to the axis of the test specimens were attempted.
► The specimens were photographed in front of a graduated scale and the angles were estimated
► The angles were measured with a protractor
► The lengths between the points where the failure planes intersected the surfaces of the specimens were measured, and these lengths were used in a simple trigonometric calculation to determine the angles.
The values obtained by the three methods were checked and re-checked until they agreed to within 2°. The two specimens with height-to-diameter ratios of 1.56 and 1.96 showed minor signs of development of cones. The diagonal was, however, the best estimate for the angle of failure. For the rest of the specimens the planes of failure were almost flat.
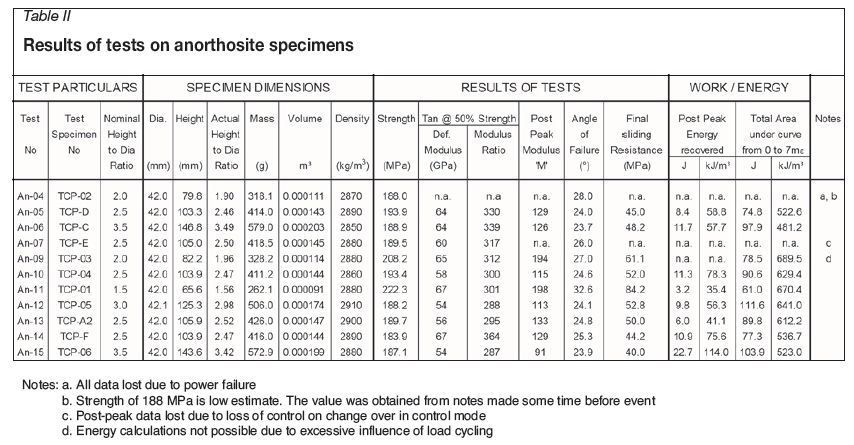
Presentation of test results
The results of the tests are summarized in Table II. For the description of a typical result, the stress-strain curve for one test specimen is used as the example. The axial stress-strain curve for the specimen, together with the dimensions of the specimen, is shown in Figure 20.
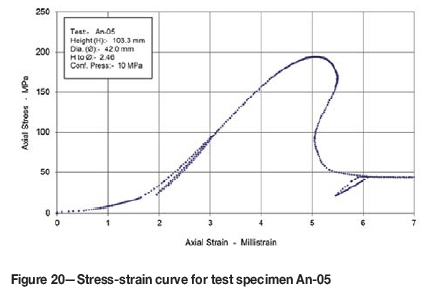
The Class II behaviour of the specimen with height-to-diameter ratio of 2.46 is obvious in Figure 20. The minimum slope of the post-peak curve (M) was found to be 129 GPa. Approaching the peak strength, the stress was near constant, while the axial strain increased and the circumferential strain rate was regulated automatically at the programmed rate of 0.36 millistrain per minute. The failed specimen behaved elastically during the post-peak unloading and reloading cycle.
The curve in Figure 20 shows the individual data-points which were sampled at a fixed, pre-programmed rate. Thus the distance between successive points is an indication of the rate of change in axial stress and axial strain. The number of data-points and the distances between points clearly show that the servo-controlled testing machine was in perfect control of the specimen behaviour throughout the test. Sudden, uncontrolled failure would have resulted in large spacings between points.
Discussion of the results of tests on anorthosite
Effect of height-to-diameter ratio on strength
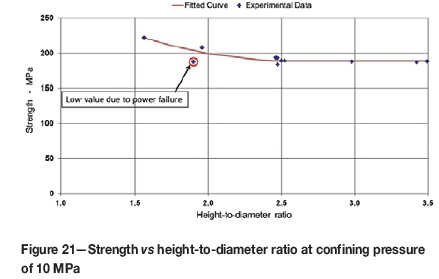
As was expected (John, 1972), the compressive strength was higher for the short specimens, but was practically constant for specimens with height-to-diameter ratios >2.5. John (1972) performed uniaxial tests, but the results of the current series of triaxial tests show the identical trend. This is illustrated in Figure 21 (the result marked with a circle is a low estimate, since the specimen failed prematurely due to a power failure, which caused loss of control). The five results for the strength of specimens with the 'standard' height-to-diameter ratio of 2.5 show only minor variability, illustrating the uniformity of the anorthosite. The curve levels off at a strength of 189 MPa.
Effect of height-to-diameter ratio on the angle of failure
A graph showing the angles of these failure planes is presented in Figure 22, which also shows a line representing the calculated angle of diagonal planes through the specimens.
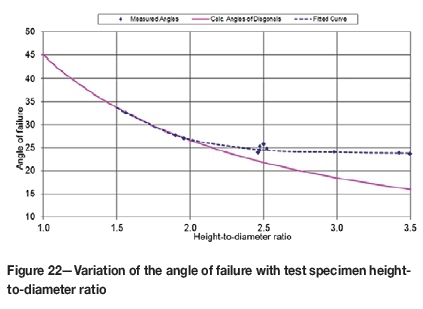
It can be seen that:
► A smooth curve can be drawn through the values for the angles of failure, i.e. there are only very small variations in the results
► The curve for angles of failure appears very similar to the curve for the strength in Figure 21
► The curve levels off for specimens with height-to-diameter ratios >2.5
► For test specimens with height-to-diameter ratios <2.0, the angle of failure is equal to that of the diagonal plane through the specimen
► The curve levels off at an average angle of 24.3°.
Effect of height-to-diameterratio on pre-peak deformation behaviour
The lower curve in Figure 23 shows the values for the 'tangent 50% UCS' deformation moduli (E) in the pre-peak regions of the stress-strain curves. As was to be expected, the deformation moduli in the pre-peak region of the stressstrain curves are almost constant, with an average value of approximately 60 GPa. Only the two specimens with height-to-diameter ratios < 2.5 appear to show a slightly higher value for the deformation modulus. An explanation for this is that the relative influence of the constraints exerted by the loading platens is much larger for short specimens than for long specimens, and thus the stress distribution throughout the test specimen is less uniform. The results confirm that the values of the pre-peak deformation moduli are not affected by the geometry of the tested specimens, i.e. their height-to-diameter ratio, provided that test specimens with 'standard' height-to-diameter ratios >2.5 are tested.
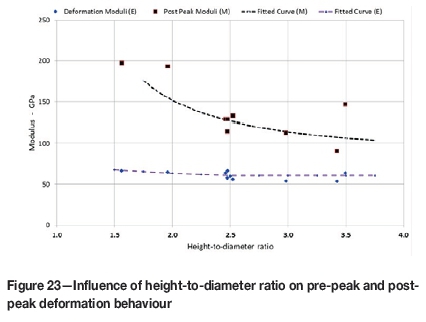
Effect of height-to-diameterratio on post-peak deformation behaviour
The values for the post-peak moduli (M) have been included in Figure 23. These moduli are all positive since all the specimens behaved with a Class II characteristic. In contrast with the pre-peak deformation behaviour, the post-peak deformation behaviour is significantly influenced by the height-to-diameter ratio of the test specimens and hence by the geometry of the specimens. This result is regarded as the most important finding of the research. The explanation for this behaviour is the effect of the elastic properties of the fragments in the failing specimen. The stresses in such fragments are reduced progressively as the test specimen's resistance to load diminishes. The stored elastic strain energy is then gradually released. The released elastic energy depends on the size of the fragments relative to the size of the whole specimen and thus on the geometry of the specimen tested.
Work done or energy required to deform the test specimens
The total quantity of work done to deform the specimens to a strain of 0.7% was calculated. As explained previously, the value of 0.7% strain was arbitrarily selected in order to compare energy calculations for the different specimens (actual experimental values varied between approximately 0.58% and >0.8% strain). The results are listed in Table II, together with all data collected during the evaluation of the test results. Figure 24 shows the total work done to deform the specimen. There is a distinct relationship between the work done per specimen and the increasing height-to-diameter ratio. The correlation coefficient (R2) is a remarkable 0.72 when a straight line is fitted.
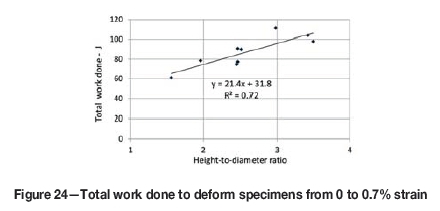
The observed trend is to be expected because with increasing height-to-diameter ratio, the volume of rock to be deformed to a strain of 0.7% increases. Figure 25 shows the work done per unit volume in deforming the specimens to a strain of 0.7%. Unfortunately, the results show significant scatter, and a linear regression resulted in a correlation coefficient (R2) of 0.52.
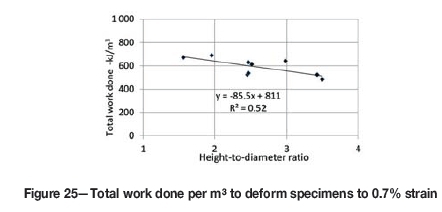
A definite trend of less energy per unit volume for specimens with larger height-to-diameter ratios is obvious. The results do not allow extrapolation, and thus it cannot be stated with certainty whether the trend is linear or not. However, it may be presumed that the curve will eventually level off for specimens with large height-to-diameter ratios.
Energy released by the test specimens in the post-failure region
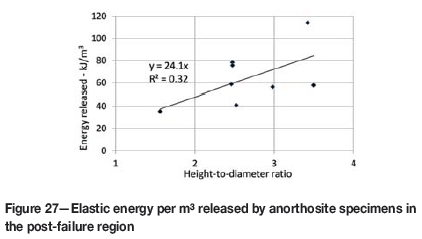
In the case of materials exhibiting Class II behaviour there is, by definition, always a region of the stress-strain curve where the test specimen is effectively expanding while at the same time losing strength. This phenomenon results in a double-negative or, in effect, a positive post-peak slope of the curve. The excess elastic energy in the test specimen has been quantified by calculating the areas under the curves, and the results are presented in Table II and graphically in Figures 26 and 27.
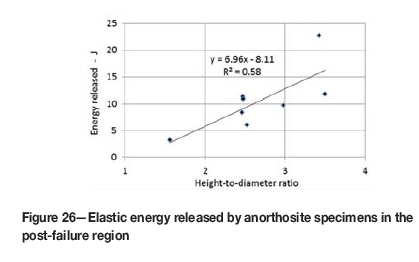
In Figure 26 it is obvious that there is a direct relationship between height-to-diameter ratio and the energy released. This trend was to be expected since the Class II behaviour is ascribed to the elastic energy stored by the specimen. It is interesting to note that, for a specimen with a height-to-diameter ratio of approximately 1, the graph intersects the Y-axis at the zero point and thus there will be no energy released. For this material, and for the testing conditions applied, it appears that test specimens with height-to-diameter ratios <1 will exhibit Class I behaviour.
Although Figure 27 illustrates that the energy released per unit volume also exhibits a direct relationship with height-to-diameter ratio, there is unfortunately a large scatter in the data, R2 being only 0.32.
All the results obtained during the study of work done and of elastic energy released confirm once again that the behaviour is geometry-dependent.
Ultimate resistance to shearing
Figure 28 shows the ultimate resistance to shearing as a function of the height-to-diameter ratio. This value is the stress required for further deformation to 0.7% after the stress-strain curves have levelled off. Here too, as is the case for strength and the angle of failure, the influence of geometry effectively disappears for height-to-diameter ratios >2.5. The ultimate values were measured and these results are included in Table II.
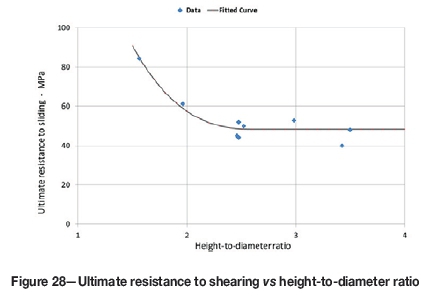
Although the ultimate resistance to shearing is sometimes used to estimate the frictional behaviour of fractured rock, this practice should be used with circumspection because it has been shown above that the results are geometry-dependent. This finding is of particular importance since short specimens are often used for testing in order to improve the chances of obtaining complete stress-strain curves.
Conclusions
The experimental work described in this paper has shown that the post-peak behaviour of the tested materials is not only a material characteristic but is also dependent on the dimensions of the specimens tested. This conclusion was reached after testing cylindrical specimens with different height-to-diameter ratios of two materials, a low-strength material with Class I characteristic, and a medium-strength material with Class II characteristic. The explanation of the observed behaviour is that in the post-peak phase of a test, the elastic energy stored in the unfailed fragments of the test specimen is released, while the load-bearing capacity diminishes. Release of elastic energy caused by compressive forces results in expansive strain which is in a direction opposite to the compressive strain caused by progressive failure. The relative proportions of the unfailed fragments to the total volume of a test specimen differ for specimens with different height-to-diameter ratios and hence the overall deformation behaviour is affected.
An important consequence of this finding is that Class I or Class II behaviour depends on the relative influence of the 'elastic' and the 'inelastic' portions of the test specimen. It is thus possible that the same rock material can exhibit Class I or Class II behaviour, depending on the geometry of the test specimen. A further consequence is that, whether a test specimen fails in a brittle, explosive manner or not, the behaviour is also dependent on the test specimen geometry and is thus equally not only a material characteristic.
The statement in ISRM (2007, pp. 221-229), that force and load, and also displacement and deformation, are synonymous (in the context of inspecting laboratory test results) is fundamentally incorrect for the post-peak part of such curves. In the post-peak region, the test specimens are of a compound nature, consisting of unfailed fragments between cracks and ultimate failure planes. Strains calculated from measured deformations and the numerical values for the deformation characteristics calculated from such strains depend on the method of measurement. Deformation transducers average the deformations over the effective gauge length and thus the position of transducers relative to the failure planes can affect the resulting measurements significantly. In the extreme case, when testing specimens with large height-to-diameter ratios, the measured axial deformations may even represent the behaviour of 'intact' rock during unloading.
A further important consequence of the experimental findings is that the practice of using values for the post-peak stress-strain response as input data for computer modelling without taking cognizance of the shape of the test specimens from which the values were obtained is scientifically incorrect. Therefore, although reporting the results of tests in the post-peak region in the form of stress-strain curves is practical, they should be interpreted with the necessary circumspection. For comparing the post-peak deformation behaviour of different types of rocks it is therefore important that specimens with a standard geometry should be tested.
It was shown that the strength of the anorthosite, tested in triaxial compression with a confining pressure of 10 MPa, was not affected by the test specimen geometry except for short specimens with height-to-diameter ratios <2.5. This behaviour was to be expected and is perfectly in line with the standard recommendation proposed by ISRM (2007, pp. 153156). This conclusion is expected to be valid for other rock types, as well as for different confining pressures.
The deformation behaviour in the pre-peak region of the stress-strain curves is affected by the test specimen geometry for specimens with height-to-diameter ratios < 2.5. This behaviour was also expected and is again in line with the standard recommendation (ISRM, 2007, pp. 153-156).
For all the tests performed on the anorthosite rock, the mode of ultimate failure was that of a single failure plane. An explanation for this phenomenon is that all the excess elastic energy stored in the unfailed parts of the test specimen was effectively removed, leaving only sufficient energy required to continue deforming the specimens at the pre-programmed rate. Such an explanation has not previously been reported and is therefore an important conclusion. A notable consequence of this finding is that the degree of fragmentation depends on the success or otherwise with which any excess elastic energy is rapidly extracted from the test specimen, in addition to extracting the elastic energy stored in the equipment. The phenomenon should be further researched for different types of rock. It is most likely that even when rocks with Class I type behaviour are tested using stiff servo-controlled equipment, the predominant single plane mode of failure will result. This should be confirmed experimentally.
It was shown that the angle of the failure planes is dependent on the geometry of the test specimen for height-to-diameter ratios less than 2.5. For height-to-diameter ratios of 2.5 and greater, the angle for anorthosite was found to be approximately constant at 24°. This finding applies to anorthosite rock material tested in triaxial compression with a confining pressure of 10 MPa. It is expected that the angle may differ for different types of rocks, and also for different confining pressures. This should be further investigated.
Quantifying the total energy and the energy per cubic metre from the areas under the load-deformation curves and stress-strain curves respectively was found to be useful when interpreting the results from post-peak testing. The total energy used in deforming and crushing the rock specimens was found to be dependent on the geometry of the test specimen. While this was to be expected, the energy expended per unit volume was found to be different. The quantity of energy released by the test specimens during Class II behaviour in the post-peak region of the stress-strain curves was also found to be dependent on the height-to-diameter ratio. The findings again confirm the dependence of the specimen behaviour on the geometry, in addition to the material properties.
The expression 'Class II type rock' should be avoided and may be replaced with expressions such as 'rock exhibiting Class II behaviour'. When reporting results of tests, details of the experimental conditions such as specimen shape and size and confining pressure - if any - should always be reported.
The artificial stabilized soil model material offers possibilities for further study of the post-peak properties of materials exhibiting Class I behaviour. Test specimens of such materials can be made to standardized specifications, resulting in uniform, consistent properties which should help to ensure repeatable test results. The model materials may be tested using 'soft' testing machines available in most test laboratories. Simple and inexpensive measuring equipment will be suitable for the tests.
It is recommended that more attention should be given to work and energy determinations. This is expected to provide data allowing explanations for mode of failure and particularly the fragmentation intensity. Furthermore, when inspecting results of cycling tests, the loss or apparent gain in energy should be carefully considered. The loading and unloading curves for perfectly elastic materials, whether linear or nonlinear, are identical and there will be no gaps and no areas between successive cycles indicating that the energy spent and recovered remains constant. If the area of any gaps above stress-strain or load-deformation curves between successive loading cycles is larger than the area enclosed by the cycles, this indicates that less energy is required during cycling tests than during single loading tests. Although the phenomenon of saving energy by cycling is unlikely, it is often observed in actual testing practice. Explanations should be sought in probable experimental errors such as the effect of hysteresis during the measurements.
Acknowledgements
The assistance and contributions of the staff of the CSIR rock testing laboratory and of the Genmin Laboratory of the University of the Witwatersrand are acknowledged. Some of the research on which this paper is based was supported in part by the National Research Foundation of South Africa (Grant-specific unique reference number (UID) 85971). The Grantholder (second author) acknowledges that the opinions, findings, and conclusions or recommendations expressed in any publication generated by the NRF-supported research are those of the authors, and that the NRF accepts no liability whatsoever in this regard.
References
ASTM D26641. Standard test method for triaxial compressive strength of undrained ock core specimens without pore pressure measurements. ASTM Designation D2664 - 6. ASTM International, West Conshohocken, PA. [ Links ]
ASTM D43951. Standard test method for determining the in situ modulus of deformation of rock mass using the flexible plate loading method. ASTM Designation D4395 - 84. ASTM International, West Conshohocken, PA. [ Links ]
ASTM D70121. standard test method for compressive strength and elastic moduli of intact rock core specimens under varying states of stress and temperatures. ASTM Designation D7012 - 10. ASTM International, West Conshohocken, PA. [ Links ]
Bieniawski, Z.T. 1971. Deformational behaviour of fractured rock under multiaxial compression. Proceedings of the Symposium on Civil Engineering Materials. Te'eni, M. (ed.). Wiley-Interscience, Chichester. pp. 589-598. [ Links ]
Cook, N.G.W. 1965. The failure of rock. International Journal of Rock Mechanics and Mining Sciences, vol. 2, no. 4. pp. 389-404. [ Links ]
Cook, N.G.W. and Hojem, J.P.M. 1966. A rigid 50-ton compression and tension testing machine. South African Mechanical Engineer, vol. 16. pp. 89-92. [ Links ]
Deere, D.U. and Miller, R.P. 1966. Engineering classification and index properties of intact rock. Technical Report no. AFWL-TR-66-116. US Air Force Weapons Laboratory, New Mexico. 291 pp. [ Links ]
Fairhurst, C.E. and Hudson, J.A. 1999. Draft ISRM suggested method for the complete stress-strain curve for intact rock in uniaxial compression. International Journal of Rock. Mechanics and Mining Sciences, vol. 36. pp. 279-289. [ Links ]
He, C., Okubo, S., and Nishimatsu, Y. 1990. A study on the Class II behaviour of rock. Rock Mechanics and Rock Engineering, vol. 23. pp. 261-273. [ Links ]
ISRM. 2007. The Complete ISRM Suggested Methods for Rock Characterization, Testing and Monitoring: 1974-2006. Ulusay, R. and Hudson, J.A. (eds). ISRM Turkish National Group, Ankara, Turkey. [ Links ]
John, M. 1972. The influence of the length to diameter ratio on rock properties in uniaxial compression: A contribution to standardization in rock mechanics testing. Geomechanics Internal Report ME 1083/5. CSIR, Pretoria. [ Links ]
Mgangira, M. 2008. Investigating enzyme-based liquid stabilizers in road construction. Science Scope, vol. 3. CSIR, Pretoria. [ Links ]
Mogi, K. 1966. Some precise measurements of fracture strength of rocks under uniform compressive stress. Felsmechanik und Ingenieurgeologie, vol. 4. pp. 41-55. [ Links ]
Okubo, S. and Nishimatsu, Y. 1985. Uniaxial compression testing using a linear combination of stress and strain as the control variable. International Journal of Rock Mechanics and Mining Sciences and Geomechanics Abstracts, vol. 22. pp. 323-330. [ Links ]
Okubo, S., Nishimatsu, Y., and He, C. 1990. Loading rate dependence of class II rock behaviour in Uniaxial and triaxial compression tests - an application of a proposed new control method. International Journal of Rock Mechanics and Mining Sciences, vol. 27, no. 6. pp. 559-562. [ Links ]
Stavrogin, A.N. and Tarasov, B.G. 1995. Some results obtained with high stiffness rock testing systems. International Society for Rock Mechanics News Journal, vol. 3, no. 2. [ Links ]
Stavrogin, A.N. and Tarasov, B.G. 2001. Experimental Physics and Rock Mechanics. (Results of Laboratory Studies). Balkema. [ Links ]
Tarasov, B.G. and Potvin, Y. 2013. Universal criteria for rock brittleness estimation under triaxial compression. International Journal of Rock Mechanics and Mining Sciences, vol. 59. pp. 57-69. [ Links ]
Wawersik, W.R. 1968. Detailed analysis of rock failure in laboratory compression tests. PhD thesis, University of Minnesota. [ Links ]
Wawersik, W.R. and Fairhurst, C. 1970. A study of brittle rock fracture in laboratory compression experiments. International Journal of Rock Mechanics and Mining Sciences, vol. 7. pp. 561-575. [ Links ]
1 The American Society for Testing and Materials (ASTM) publishes their ASTM standards annually. Each standard has a fixed designation number followed by the year of original adoption. Where applicable, the year of re-approval is added.

