


Servicios Personalizados
Articulo
 Inglés (pdf)
 Articulo en XML
 Referencias del artículo
Indicadores

Links relacionados
-
 Citado por Google
 -
 Similares en Google
Compartir

 Permalink
Journal of the Southern African Institute of Mining and Metallurgy
versión On-line ISSN 2411-9717
versión impresa ISSN 2225-6253
J. S. Afr. Inst. Min. Metall. vol.116 no.10 Johannesburg oct. 2016
http://dx.doi.org/10.17159/2411-9717/2016/v116n10a3
GENERAL PAPERS
Investigation of the 'tiger skin' defect on indefinite chill rolls
J. JonckI; J.S. MoemaI, II; J. JoosteIII; P. van TonderIV
IMintek, Randburg, South Africa
IIUniversity of Pretoria, Pretoria, South Africa
IIIVaal University of Technology, Vanderbijlpark, South Africa
IVSouth African Roll Company Pty. Ltd., Vanderbijlpark, South Africa
SYNOPSIS
Hot strip mills (HSMs) are used to roll steel slabs down from their initial size to plate or sheet, which are then used to manufacture a wide variety of goods for various industrial markets. The surface quality of the rolls that contact and deform the strip must be maintained during rolling, as roll imperfections can be imposed onto the strip, affecting the quality. For many years various roll producers have experienced the occurrence of a surface defect, commonly referred to as 'tiger skin' (TS), on indefinite chill (IC) work rolls, but the cause of the defect has not been thoroughly investigated. The characteristics of the TS defects on the roll surface were studied in an attempt to identify the cause and prevent its occurrence. In this paper, the characterization results of the defects are highlighted. Various techniques were utilized in the analysis: visual inspection, chemical analysis, optical microscopy, hardness testing, scanning electron microscopy and X-ray diffraction. The purpose of the testing was to identify any variations in the roll microstructure that could give rise to the surface variation. The results confirmed that the TS defects appeared as a pattern that is not related to a variation in the surface profile, surface cracking, chemical segregation, graphite characteristics, carbide characteristics, primary phase characteristics, bulk hardness, or microhardness. Further investigations are recommended.
Keywords: rolling, mills, hot strip, surface defects, 'tiger skin'.
Introduction
Hot strip mills (HSMs) are used to roll cast steel slabs from their initial size to plate or sheet, which is then used to manufacture a wide variety of goods for various industrial markets. The working rolls that contact and deform the strip are arguably the primary element of the HSM. The surface quality of the rolls must be maintained during rolling as imperfections are imposed onto the strip, affecting the quality. Among these rolls are indefinite chill (IC) work rolls. The general IC roll chemistry and microstructure compares well with traditional white cast iron, except for the sulphur and phosphorus impurity elements, which are kept to lower levels and the presence of some graphite in the microstructure similar to the other cast irons such as gray and ductile cast iron.
Various roll producers have experienced the occurrence of a surface defect on IC work rolls for many years, but the root cause of the defect has not been thoroughly investigated.
The defect has been commonly referred to as 'tiger skin' (TS) or elephant skin (van Tonder, 2012). In this research, the characteristics of the TS surface defect were studied in an attempt to identify and remedy the cause.
Background
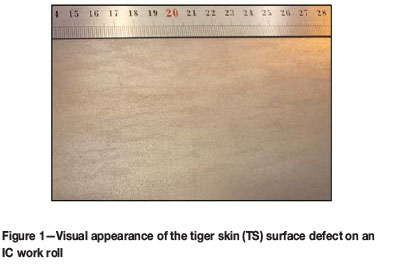
Following discussions with both HSMs and the South African Roll Company (SARCO) in February and March 2012, the opinion was that while the TS defects appeared to be limited to IC work rolls, these were sourced from various reputable global roll producers. The TS defects appear as minor variations in the surface appearance of the roll, which can be difficult to identify, as shown in Figure 1. The TS defect is transferred to the strip during rolling and is classed as an aesthetically undesirable defect by the steel mill. While in service, TS is readily detected on the product by strip surface quality monitoring systems. The TS problem occurs intermittently and does not appear to correspond to specific periods or seasons. TS has been found in both single-stand reversing Steckel mills and multiple-stand continuous mills and at both carbon steel and stainless steel mills (van Tonder, 2012).
SARCO also indicated that the TS appeared within a specific layer of the shell (the outer portion of the composite roll) thickness, which is typically at the roll surface after approximately 70% of the roll's performance life. The TS appears only within the roll area that is in contact with the strip during rolling. The surface can be ground to remove the TS, but the defect commonly reappears when the roll resumes service. If TS is detected on a roll, a sufficient amount of shell material will be removed (based on recommendations from the roll supplier), reducing the roll diameter. The roll will then be returned to service and monitored closely to detect whether the defect reappears. If the defect has not been eliminated, the procedure is repeated until the defect is no longer present. The lost roll material results in loss of production and operational expenses for the mill (Columbus Stainless Steel, 2009). It has been postulated that TS may be related to a variation in graphite distribution over the roll surface. The general assumption was that TS must be roll-related, given the characteristics of occurrence, with the mill type and conditions also contributing to the prevalence (Columbus Stainless Steel, 2009; vander Voort, 1999).
Consultation with roll producers who have experienced TS indicated that, although the source is not clear, the belief was that the TS phenomenon was inherent to the roll casting process. It has also been postulated that TS could be related to the direction of rotation during casting, which is either in, or opposite to, the rolling direction in service. However, this should not be the case in a Steckel mill where the feed direction alternates.
Experimental procedure
Samples from various industrial IC rolls were analysed, including defective newly-manufactured rolls, rolls removed from service that did not show the TS defect, rolls showing the TS defect in service and rolls that had completed their service life without showing the TS defect. Shavings were removed from the roll displaying TS at diameters of 0, 7 and 15 mm (depth below the surface) of the roll, from the drive side and the free side.
The working surface was characterized by visual examination, replication with a 0.1 μm resolution of the surfaces, optical microscopy of replicas and the cleaned surfaces. Scanning electron microscopy (SEM) and etching trials were performed to identify any variation of microstructural features on the working surface related to the TS appearance.
A variety of etchants were used for the etching trials, including 4% nital, 10% nital, 4% picral, alkaline sodium picrate (ASP), Beaujard's solution and a four-step duplex etchant (ASTM, 2003). The optical microscope stage height was recorded to determine the average height difference between the protruding carbides and the primary phase of the light and dark TS areas.
Chemical analysis of metal shavings was done to identify any chemical segregation or differences over the shell depth. The amounts of carbon and sulphur were determined by LECO combustion analysis. The other elements of interest were determined by inductively coupled plasma optical emission spectrometry (ICP-OES) analysis.
The samples were ground and polished to a 1 μm surface finish in the transverse and radial directions at different depths for microscopy. The polished sections were used to evaluate the graphite volume fraction, distribution and morphology, to identify any variations in graphite occurrence which could be related to TS. The samples were etched with 3% nital by swabbing the surface, to reveal the general microstructure. The etchant does not attack any carbides (which then remain white), enabling good contrast between the carbides (primary and secondary carbides) and the darker phases. This ensures accurate determination of the carbide volume fraction by means of image analysis. The samples were then etched with a range of selective carbide etchants to identify the carbide type, or any variation in the carbide type that might be present (specifically related to the TS defect). The etchants considered included an ASP etchant, Murakami's reagent, Groesbeck's reagent, 1% CrO3 and 10% ammonium persulphate (APS) solution. The samples were etched with Beraha's sulfamic acid solution and a sodium metabisulphite (SMB) tint etch in order to identify any retained austenite (RA) within the microstructure. Beraha's tint etchant selectively colours the austenite phase blue. The SMB etchant darkens martensite and does not etch all other phases, including austenite (vander Voort, 1999).
Hardness testing was performed to determine if the TS pattern was related to changes in the bulk hardness or microhardness of individual phases within the microstructure. The bulk hardness was measured using a Rockwell C tester, while the microhardnesses of the carbides and primary phase were individually measured using a Vickers microhardness tester with a load of 200 g and a holding time of 15 seconds.
SEM analysis of the polished samples was performed to identify any microstructural or chemical variations associated with the TS. The chemical analysis was performed using energy-dispersive X-ray spectrometry (EDX) at the centre of the primary phase grains, centre of the primary carbides, interface between the primary phase and the carbides and the regions isolated by the eutectic carbides.
Samples were prepared for XRD using universal sample holders under typical metallography guidelines, followed by a brief final electropolish using chromic-acetic acid and a stainless steel cathode. The samples were examined prior to XRD testing to ensure no pitting of the surface had occurred (vander Voort and Manilova, 2005; ASTM, 2003; Klimek, 1975). XRD was then done to analyse the phases present within the samples. The relative phase amounts (mass %) were estimated using the Rietveld method (Lowe-Ma and Donlon, 2001). The carbide morphologies and quantity data (as determined by microscopy) were used to ensure accurate RA peak identification to avoid erroneous overestimation. A slow scanning rate of 0.5° 2 /min was utilized as low amounts of RA were expected for all the samples.
Results and discussion
Working surface
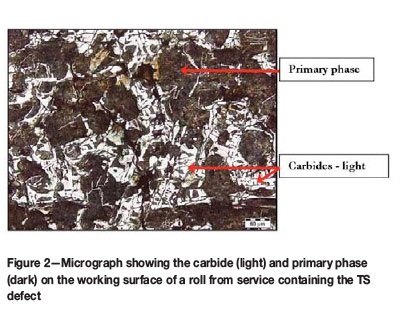
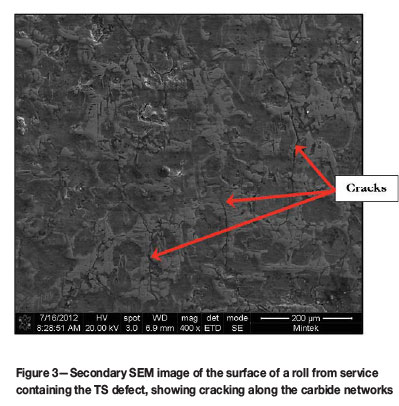
Visual examination showed that the TS defect could be clearly identified as a pattern of alternating lighter and darker shaded areas on the working surface. The difference in surface appearance could not be properly photographed, as none of the macro etchants highlighted the TS defect. Optical microscopy of the cleaned surfaces also showed no significant variation of microstructural features (carbide exposure, carbide distribution etc.) on the working surface related to the TS appearance, as shown in Figure 2. The average height difference between the protruding carbides and the depressed primary phase was not consistently higher or lower when comparing the light and dark TS areas, as shown in Table I.
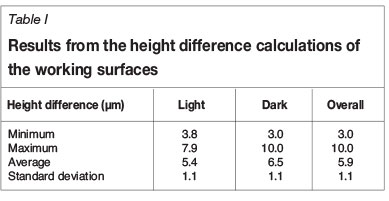
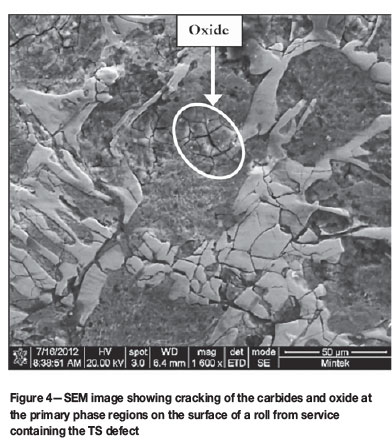
SEM analysis showed widespread cracking of the roll surface which appeared to propagate through the carbide networks, as indicated in Figure 3. The carbides appeared to have been crushed during rolling, as indicated by smaller cracks that were limited to the carbides (Figure 4). However, the cracking did not appear to be related to TS, as the cracking was uniform across both the light and dark areas of all the samples. Oxide was observed on the primary phase, which is expected for a roll taken from service.
Chemical analysis
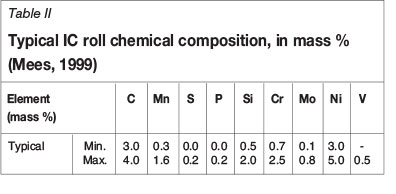
There was little variation in chemical composition across the shell material, except for the silicon content at both ends of the roll, which showed significant variation. The silicon decreases the stability of Fe3C and increases the degree of graphitization of the roll, which could cause variations in graphite content (Craig, Hornung and McCluhan, 1988). However, the variation in silicon content did not appear to be more severe in the TS region compared to the other regions of the shell material and did not seem to be related to TS. No other chemical variations were identified that could give rise to the TS defect. The detailed chemical analysis may not be reported for proprietary reasons, but the typical IC composition is shown in Table II.
Microscopy
The polished sections showed coarse graphite with a uniform distribution and morphology on both the transverse and radial sections of most samples. The only exception was on one of the radial TS samples, where a variation between regions of predominantly fine, well-distributed graphite (Figure 5a) and coarse graphite particles (Figure 5b) was seen. These variations could influence the lubrication effect of the graphite during rolling, leading to variations in friction coefficient and slippage resistance across the roll and thereby cause a surface effect such as TS (Mees, 2002). Unfortunately, as the working surface had already been ground off on the as-received material, it could not be confirmed if the variation in graphite distribution correlated with the TS surface pattern.
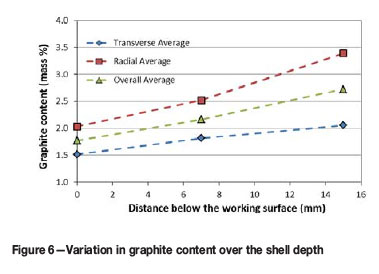
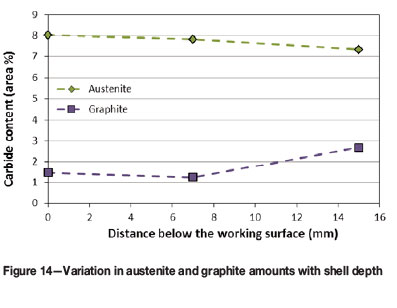
Variation in the measured graphite content was observed between the transverse and radial sections of all the samples. The average graphite content showed a consistent increase with increase in depth below the surface, as shown in Figure 6. The increase in graphite content was probably due to the slower cooling rate associated with greater depths below the surface during solidification.
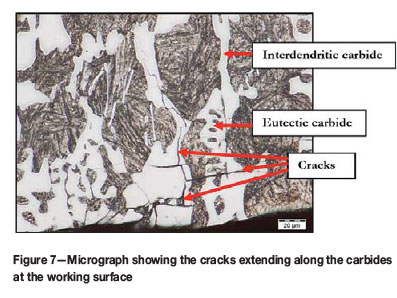
The general microstructures of all the samples were similar, consisting of free graphite and primary carbide networks within a martensitic primary phase. The primary carbide was found as interdendritic and eutectic structures, with the interdendritic being the most abundant. The arrangement of the two carbide structures did not correspond to the TS pattern. Figure 7 shows that the surface cracks propagated predominantly through the carbides, confirming the crushing of carbides identified during SEM analysis. The cracks were mostly limited to a depth of 100 μm below the surface.
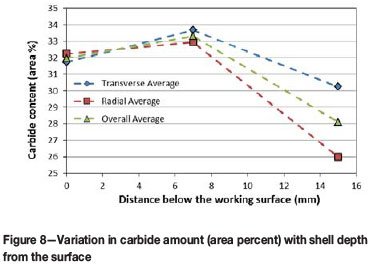
The Nital-etched samples were used to determine the carbide area fraction. The amount of carbide was slightly higher at a depth of 7 mm and lower at a depth of 15 mm than at the surface (Figure 8). The carbide contents of the light and dark areas of the TS were found to be similar.
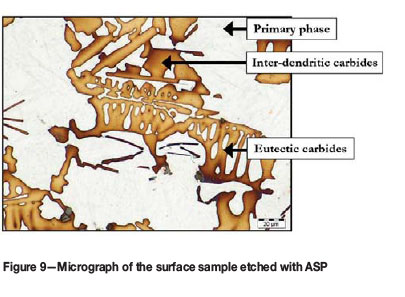
Only two etchants from the range tested were able to distinguish the carbides. The 10% APS etchant outlined the carbides, while the alkaline sodium picrate (ASP) etchant outlined and coloured the carbides, as shown in Figure 9. The combination of the etch response confirms that the carbides are of the M3C type (vander Voort, 1999). The samples showed a uniform carbide type at the three depths examined (0, 7 and 15 mm). Also, no variation in carbide type was found between the light and dark areas of the TS.
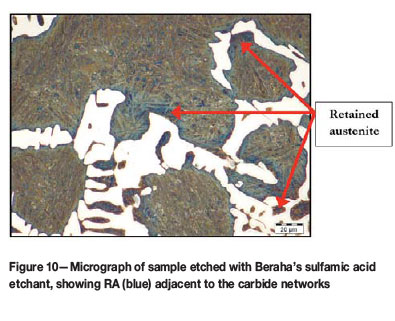
Beraha's sulfamic acid solution tinted traces of RA blue in all of the samples. However, the etchant did not show sufficient contrast between the RA and the martensite to enable accurate quantification. The RA appeared to be concentrated around the carbide networks, especially the eutectic carbides (Figure 10). There was no noticeable variation in the amount of RA between the light and dark TS areas, but quantification could not be performed to confirm the observation. In general, RA is identified only when it is in excess of approximately 10-15%, suggesting that the samples may all contain more than 10% RA (vander Voort 2009). However, it must be noted that the 10-15% RA observation was made on wrought tool steels, which have significantly more homogeneous structures than white cast iron (WCI). The more segregated and inhomogeneous cast structure of the IC rolls could lead to high local amounts of RA, despite bulk RA amounts significantly lower than 10%.
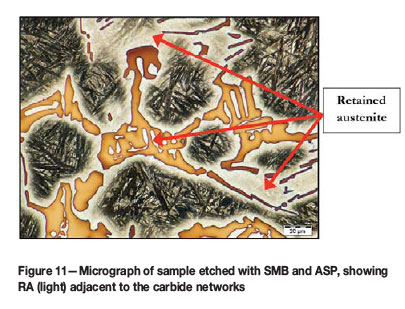
The sodium metabisulphite tint etch also confirmed the presence of RA associated with the carbide networks (Figure 11). The etchant appeared to show larger percentages of RA than Beraha's sulfamic acid etchant. The difference in etch response suggests that SMB may be more sensitive to RA than Beraha's sulfamic acid etchant and could reveal RA at smaller amounts. There appeared to be no difference in the amount of RA between the light and dark areas of the TS, similar to the response with the Beraha's sulfamic acid etchant. However, there was insufficient contrast between the RA and the martensite and carbides to confirm this observation by quantitative phase analysis.
Hardness testing
The bulk hardness was fairly uniform and showed no notable hardness differences through the shell to a depth of 15 mm below the surface, as listed in Table III. No distinct difference in bulk hardness was found between the light and dark areas of the TS defects. The average bulk hardness was within acceptable levels for IC material.
The microhardness results of the primary phase showed a large variation ranging from 362 HV0.2 up to a maximum hardness of 655 HV0.2. The large variation could be an indication of the lack of homogeneity of the structure. The average primary phase hardness was acceptable for IC material (Mees, 1999). No significant variation in primary phase hardness or trend between the light and dark TS regions was found.
The carbide microhardness also showed a large variation, ranging from 808 HV0.2 to 1319 HV0.2. Many carbides cracked during the measurements, so the indentations that caused cracking were excluded from the results. The average carbide hardness of the samples was acceptable for IC material (Mees, 1999). The average carbide hardness did not show significant variation with shell depth from the surface and no significant trend or variation in carbide hardness was found between the light and dark TS regions.
There was no marked difference in bulk hardness between the coarse graphite region at an average of 54.2 HRC and the fine graphite region at an average of 53.9 HRC. Differences in the bulk hardness across the surface also did not correspond with the areas of coarse and fine graphite. However, the primary phase hardness showed a substantial increase of approximately 300 HV associated with the fine graphite regions. It is not clear whether the increase in primary phase hardness was associated with TS. The high primary phase hardness values were not found on any other TS sample other than the specific radial sample.
SEM analysis
The SEM backscattered electron (BSE) images showed no clear distinction between the light and dark TS regions. However, in BSE mode the primary phase regions in the eutectic which were completely isolated by the eutectic carbides were a slightly lighter shade of grey compared to the darker grey remainder of the primary phase, as highlighted in Figure 12. These were the same areas identified by optical microscopy as being rich in austenite and this confirms the association of the eutectic carbides with the retained austenite. The shading variation suggests that there could be a slight compositional variation between these regions. The primary phase also showed needle-like phases, which are probably martensite and austenite, as identified during optical microscopy. The variation was found on all the samples analysed. The results from the EDS analysis showed no measurable variation in chemical composition of the primary phase between the light and dark areas of the TS. There was no measurable variation in chemical composition of the primary phase between the surface and 7 mm below the surface. There was also no measurable variation in chemical composition of the carbides or the primary phase between the light TS area, dark TS area, surface and 7 mm below the surface.
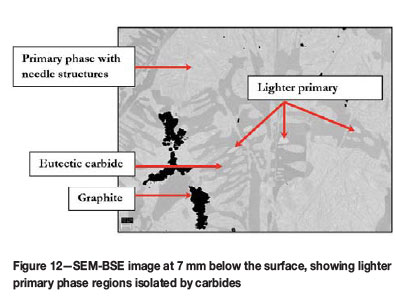
The chemical analyses also indicated that the lighter primary phase areas in the eutectic carbide regions are enriched with nickel, silicon and molybdenum compared to the general primary phase composition. Nickel is a strong austenite former and stabilizer, which typically increases the amount of retained austenite after casting and reduces the hardness (Gundlach, 1988). Enrichment in these elements will also increase the hardenability at these locations and delay martensite formation relative to the rest of the primary phase (Craig et al., 1988).
XRD analysis
The XRD results showed distinct peaks that were clearly distinguished from the background, which ensures accurate analysis. All the samples contained four phases: a' (martensite), cementite (M3C carbide), γ-Fe (austenite) and graphite. The XRD analysis for RA is strongly affected by alloying elements and carbides. Given the high level of alloying elements in the material it should be noted that the accuracy will be less than typically achieved by XRD (vander Voort and Manilova, 2005; Lowe-Ma and Donlon, 2001).
XRD confirmed that the M3C carbide type was in agreement with the EDX results. The amount of retained austenite was consistently above 3%, which is high and was in agreement with the microscopy observations. Higher amounts of RA will typically result in a decrease in roll performance, due to a reduction in hardness (Breyer, 2002). The typical hardness of retained austenite and martensite in IC rolls is approximately 375 HV and 600 HV, respectively (Schleiden, 2002). However, no significant variation in the distribution of RA was found between the different samples showing TS and the samples removed from deep enough below the surface that should not show any TS. Thus, the TS defect was not expected to be associated with high RA contents. However, the TS defect could be caused and/or influenced by a variation in RA content over the roll surface.
There should be sufficient heterogeneity within the cast structure to facilitate variations in RA content even though segregation effects could not be identified by microscopy.
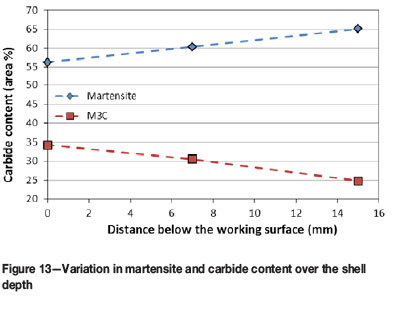
It was generally found that the martensite and graphite content increased with depth below the surface, while the carbide content decreased (Figures 13 and 14). There was no significant variation in the amount of retained austenite from the surface to 15 mm below the surface.
Conclusions
The tiger skin (TS) defect appeared as a pattern of alternating lighter and darker shaded areas on visual inspection of an IC work roll at low magnification. This defect did not seem to be specifically related to variations in: the surface profile, surface cracking, chemical segregation, bulk hardness, or microhardness. There was also no correlation found between the TS defect and phase characteristics, i.e. amount, distribution, size and composition of: graphite, M3C, martensite and retained austenite.
SEM analysis showed widespread cracking of the roll surface which appeared to propagate through the carbide networks. Microscopy confirmed that the carbides had been crushed during rolling, as indicated by smaller cracks which were limited to the carbides.
Further investigation of the casting parameters, solidification process and solidification front is required in order to recommend remedial action to prevent the TS formation. It is also clear that a collective effort between roll manufacturers and the mill end-user would be required in order to resolve the occurrence of TS.
References
ASTM. 2003. Standard practise for X-ray determination of retained austenite in steel with near random crystallographic orientation. ASTM E975-03. ASTM International, Philadelphia, USA. [ Links ]
Breyer, J.P. 2002. The metallurgy of high chromium-molybdenum white iron and steel rolls. Rollsfor the Metalworking Industries. Lee, G.E. (ed.). Iron and Steel Society, Warrendale, PA. pp. 29-40. [ Links ]
Columbus Stainless Steel. 2009. Tiger skin defect on SARCO roll surface. Middelburg, South Africa. Internal report. [ Links ]
Craig, D.B., Hornung, M.J. and McCluhan, T.K. 1988. Gray iron. ASM Handbook: Castings. Davis, J.R., Destefani, J.D. and Zorc, T.B. (eds.). ASM International, Materials Park, OH. pp. 1365-1409. [ Links ]
Gundlach, R.B. 1988. High-alloy white-irons. ASM Handbook: Castings. Davis, J.R., Destefani, J.D. and Zorc, T.B. (eds.), ASM International, Materials Park, OH. pp. 1484-1500, [ Links ]
Klimek, E.J. 1975. A metallographic method for measuring of retained austenite. Metals Engineering Quarterly, vol. 15, no. 1. pp. 55-61. [ Links ]
Lowe-Ma, C.K. and Donlon, W.T. 2001. Comments on determining X-ray diffraction-based volume fractions of retained austenite in steels. Powder Diffraction, vol. 16, no. 4. pp. 198-204. [ Links ]
Mees, J.B. 1999. The metallurgy of indefinite chill cast iron. Rollsfor the Metalworking Industries. Lee, G.E. (ed.), Iron and Steel Society, Warrendale, PA. pp. 41-47. [ Links ]
Nundlall, K. 2008. Memorandum: metallurgical analysis of elephant skin defect on Steckel mill work rolls. Report no. Met. Ref. 200807P01. Columbus Stainless Steel, Middelburg, South Africa. Internal report. [ Links ]
Schleiden, R.F. 2002. The metallurgy of cast iron rolls. Rollsfor the Metalworking Industries. Lee, G.E. (ed.). Iron and Steel Society, Warrendale, PA. pp. 20-28. [ Links ]
Van Tonder, P. 2012. Personal communication, 14 February. South African Roll Company. [ Links ]
Vander Voort, G.F. 2009. Martensite and retained austenite. Industrial Heating, vol. 76, no. 4. pp. 51-54. [ Links ]
Vander Voort, G.F. and Manilova, E.P. 2005. Hints for imaging phases in steels. Advanced Materials and Processes, vol. 163, no. 2. pp. 32-37. [ Links ]
Vander Voort, G.F. 1999. Metallography: Principles and Practices. ASM International, Materials Park, OH. [ Links ]
© This paper was first presented at the AMI Ferrous and Base Metals Development Network Conference 2016 19-21 October 2016, Southern Sun Elangeni Maharani, KwaZulu-Natal, South Africa.

