


Services on Demand
Article
 English (pdf)
 Article in xml format
 Article references
Indicators

Related links
-
 Cited by Google
 -
 Similars in Google
Share

 Permalink
Journal of the Southern African Institute of Mining and Metallurgy
On-line version ISSN 2411-9717
Print version ISSN 2225-6253
J. S. Afr. Inst. Min. Metall. vol.116 n.8 Johannesburg Aug. 2016
http://dx.doi.org/10.17159/2411-9717/2016/v116n8a5
PAPERS - DIAMONDS CONFERENCE
Microdiamond analysis - a method for estimating the size frequency distribution of the macrodiamonds
J. Danoczi; S. Creighton
Saskatchewan Research Council, Saskatoon, SK, Canada
SYNOPSIS
Estimating the size frequency distribution of the macrodiamonds on a new deposit is important for both economic reasons and for the design of the processing plant. Millions of dollars can be lost due to incorrectly sized comminution circuits. This report analyses an alternative methodology for macrodiamond grade estimation using the cumulative results from small parcels of microdiamonds and plotting them on a log-log scale. The method was first evaluated mathematically for diamond populations to assess the confidence for data extrapolation. Macrodiamond size distributions and grades were predicted using microdiamond data from three kimberlites, and the actual macrodiamond grades compared to the the predicted grades. The predicted grades were found to replicate the actual grades closely, showing that a high degree of confidence can be ascribed to the results from this method of analysis. This analysis can be used both for resource estimates and for predicting the diamond size distribution information needed for designing a new operation.
Keywords: diamond resource estimation, microdiamond distribution, macrodiamond grade, probability density function, grade-size plot.
Introduction
Microdiamonds are defined as diamonds having the largest dimension smaller than 0.85 mm; too small for cutting into gemstones. Although these small diamonds are suitable only for industrial purposes, they can provide valuable information during exploration for new diamond deposits. Microdiamond abundance data is used to estimate the macrodiamond size frequency distribution and thus provides information relevant to the deposit's economics, eventual plant design, and equipment selection.
Macrodiamonds are diamonds larger than 0.85 mm that may be suitable for cutting into gemstones, depending on their colour and clarity. Macrodiamond recovery from bulk samples is carried out once the microdiamond tests are positive. Macrodiamond recovery confirms that a kimberlite contains macrodi-amonds.
Determinations of the micro/macro diamond size relationship are typically based on grade-size plots (Ferreira, 2013). However, this method requires a large data-set in order to obtain reasonable confidence in the results. This report analyses an alternative method that does not require such a large data-set, but instead requires microdiamond occurance (data) in at least seven different size intevals to obtain reasonable confidence.
Microdiamond recovery
Microdiamond recovery is carried out to confirm that a kimberlite contains diamonds. The information used in microdiamond analysis is the number of diamonds per size fraction greater than 75 μm that reside in a sample of the ore (McCandless, 2013). The diamonds are recovered from the kimberlite samples by dissolving small quantities of kimberlite, usually <20 kg per sample, in hydrofluoric (HF) acid or molten sodium hydroxide (NaOH) (also known as caustic fusion). Since diamonds are chemically inert (do not dissolve in acids or alkalis), the small amount of residue from the dissolution process includes some poorly soluble oxide and silicate minerals as well as all of the diamonds. Final recovery of the microdiamonds is carried out by hand-sorting under a binocular microscope.
Macrodiamond recovery
If the microdiamond results indicate that the kimberlite is diamondiferous, macrodiamond recovery is undertaken. Macrodiamonds are recovered in bulk sampling exercises ranging from surficial extraction of a few trenches to drill samples and even to small underground mining projects. The bulk samples are crushed and concentrated through a dense medium separation plant capable of processing several tons of ore. The recovered concentrate is then sent to a laboratory for X-ray sorting and grease table recovery. The final recovery is carried out by hand-sorting in a secure facility.
If the results for both the microdiamond analysis and the macrodiamond numbers meet the required economic predictors, a diamond processing plant is built and the deposit is mined.
Microdiamond and Macrodiamond Analysis
Diamond count vs. size data from both the microdiamonds and the macrodiamonds typically defines a quadratic curve on a log-log plot. The mathematical fitting of a quadratic equation can be accomplished with only three points. In principle, these three points can be from the microdiamond abundances, impliying that the macrodiamond grade can be calculated using only three microdiamond data-points. In practice, more than three points of data are required, since the errors in the microdiamond data can be quite large as the diamonds do not populate the ore in a homogeous manner. The accuracy of macrodiamond abundance predictions from microdiamond data can be evaluated by calculating the 'diamond abundance vs. size' curve from the microdiamond data, extrapolating to predict macrodiamond abundance, and comparing the results to the actual recovered macrodi-amonds.
The lognormal probability density function (PDF) and the diamond population
The diamond population of a diamondiferous kimberlite has a typical lognormal distribution. The diamond distribution, or probability density function (PDF), comprises positive real values with the majority of the diamonds occuring in the smaller size fractions, causing the diamond population to be skewed to the smaller sizes. An example of a typical diamond lognormal distribution is depicted in Figure 1.
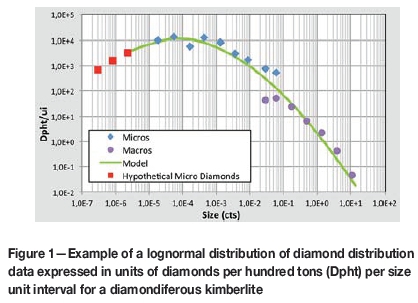
In Figure 1, the blue diamonds depict the number of microdiamonds per hundred tons per unit interval (Dpht/ui), and the purple circles depict the number of macrodiamonds per hundred tons per unit interval (Dpht/ui). The microdiamonds were recovered by caustic fusion (NaOH), ensuring total liberation of all diamonds, whereas the macrodiamonds were recovered by a bulk sampling programme and hence there are inefficiencies (diamond losses) in the number of macrodiamonds recovered smaller than 0.1 carat. The causes of the poor recoveries of the small macrodiamonds include increased the probability of diamond lock-up and plant inefficiencies for this size fraction.
The red squares are the hypothetical estimates of the number of microdiamonds in the kimberlite that are smaller than 75 μπι. The green curve is the mathematical model obtained from only the microdiamond data and extrapolated into the macrodiamond size fractions, and shows how well the microdiamond curve predicts the actual macrodiamond data.
Properties of the lognormal probability density function (PDF)
Figure 2 is an illustration of a set of lognormal PDFs that have been drawn on an X-Y axis with linear scales.
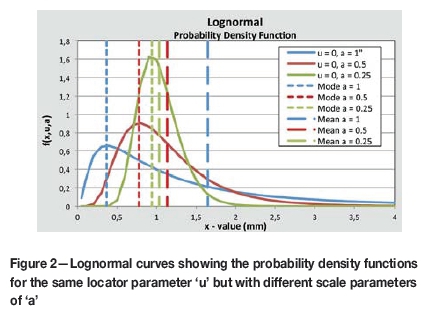
The lognormal formula used to generate these curves is given by Equation [1], where x is the variable and the parameters used are Coefficient = 1, u = 0, and aЄ {1, 0.5, 0.25} (Montgomery, 2011).
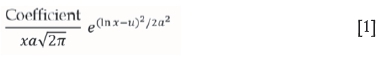
The characteristics of the lognormal curve given in Equation [1] are:
Median= eu
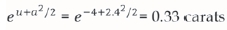
Mean = eu+a2/2
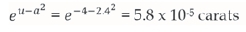
Mode = eu-a2
In Figure 2, the curve most skewed to the left (blue) provides the best representation of a diamond population distribution. This curve also has the highest a-value of the three examples with a = 1. The mode of the PDF for a lognormal curve occurs at an X-value where the function (Y-value) is the greatest and is a different value to that of the mean (average) as illustrated in Figure 2. The long and short dashed lines represent the mode and mean, respectively, for each of the three functions depicted in Figure 2.
The lognormal formula that best represents the diamond population represented in Figure 1 is Equation [1] with the parameters:

and is depicted in Figure 3 as a dark green dashed curve overlain on the diamond data from Figure 1.
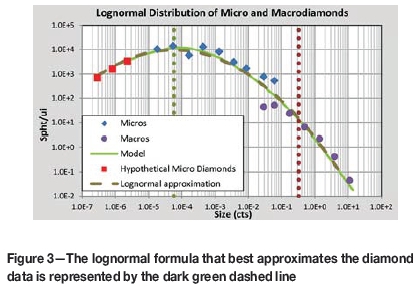
The mode of this diamond population occurs at a size (in carats) where the numbers of diamonds in a unit inteval (UI) is the greatest, and occurs at
while the average size or mean is at
as depicted by the green and brown vertical dotted lines in Figure 3, respectively. This information is useful when comparing different diamond populations and is absent from a grade-size plot.
The lognormal cumulative distribution function (CDF)
The lognormal cumulative distribution function (CDF) is the summation/integral of the data in the PDF from the maximum X-value to the X-value of interest. The CDF is a simpler mathematical progession for modelling of the lognormal data, since the data is always decreasing as X increases and there are no points of inflexion in the graph.
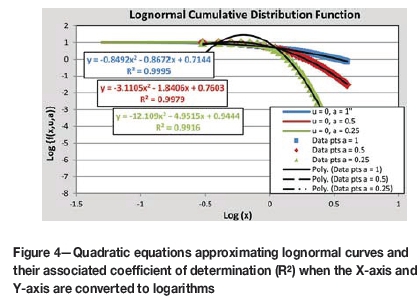
Taking the log of both the X-values and the function values (Y-values) of the lognormal CDF allows the data to be approximated by a quadratic equation with a high degree of confidence, as illustrated in Figure 4. Of importance is the fact that the best quadratic approximation occurs for the lognormal CDF curve with a = 1 (the data in blue). The coefficient of determination (R2) for this quadratic equation is greater than 0.999, illustrating that the lognormal distributions, with scale parameters of 'a' greater than 1 can be approximated by a quadratic equation with a high degree of confidence. The scale parameter (parameter 'a' in Equation [1]) for the diamond population given in Figure 1 was estimated at 2.4, significantly higher than unity. It can therefore be concluded that the CDF for diamond populations can be approximated by a quadratic equation with a high degree of acuracy.
Microdiamond analysis method
Bottom size (75 μm)
Liberating all the +75 μm microdiamonds from a kimberlite sample using HF or NaOH is an expensive and hazardous undertaking. The concentrate from the process has to be neutralized and is then laboriously sorted by hand under a binocular microscope. The cost and time for microdiamond sorting increase in as the size of the microdiamonds decreases. Test work has shown that small diamond losses occur with both the HF and NaOH processes, and the percentage volume loss increases as the diamond size decreases, resulting in errors (Kruger, 2004). From an analytical perspective, analysing only microdiamonds larger than 75 μm ensures that the quadratic approximation of the CDF retains a high coefficient of determination and the level of confidence in the analysis is high. Hence, the accepted lower limit used in microdiamond analysis is 75 μm or 5x10⁻⁶ carats.
Top size (10 carats)
The top size for valuing diamonds from bulk samples is generally 10 carats, which is the limit to which the microdiamond grade data has been extrapolated. The confidence in the extrapolated data decreases as the range of the extrapolation increases, but if macrodiamond data from bulk samples is included, the data can be extrapolated further in order to predict a top diamond size for the diamond population - information that is necessary for plant design.
Unit intervals
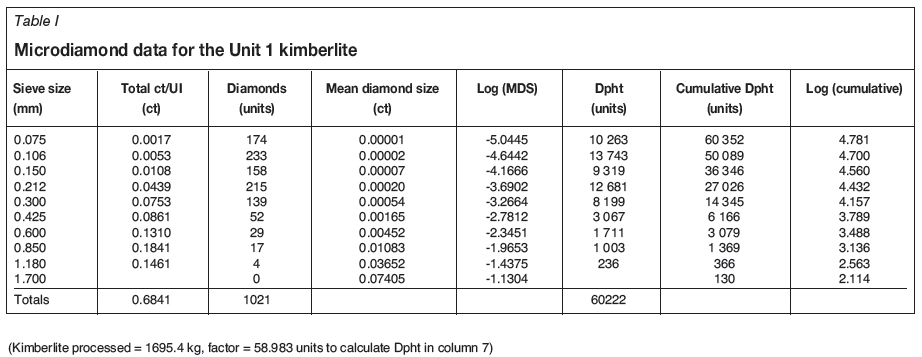
Microdiamonds are sized using a set of progressive sieve sizes, starting ideally at 75 μm and increasing by a factor of up to 1.70 mm. If macrodiamonds are recovered when processing kimberlite using chemical digestion, these diamonds must be included in the analysis in their relevant unit interval (UI). The Uls generally used for reporting diamonds recovered from total chemical digestion processes are given in the first column of Table I.
Analysis of publicly available microdiamond data revealed that different laboratories use different sieve sizes; some start at 75 μm while others start at 106 μm or even 100 μm. Sieving inefficiencies were also encountered when comparing the microdiamond dimensions and mass to the sieve size. For these reasons, the microdiamond data in this study was sorted according to the mass from which the diamond's size was calculated (at the Saskatchewan Research Centre (SRC) all microdiamonds are weighed individually). The diameters of the sorted microdiamonds increase in size by a factor of √2 for subsequent Uls. The microdiamond counts are then normalized to a 100 t sample per UI.
Calculating the mean diamond size per unit interval
The mean diamond size in each unit interval is measured in carats, and is the summation of all the diamond masses in a particular UI divided by the number of diamonds in that UI, as seen in Table I, where column 4 is the mean diamond size (MDS) and is calculated by dividing column 2 by column 3. The MDS provides information on the size of the diamonds in each UI.
Tabulating the cumulative data
The cumulative data is the total number of diamonds that occur in a 100 t sample with sizes ranging from 75 μm (0.000 005 ct) to 10 mm (10 ct). The cumulative data starts adding from the largest UI (9.6-13.6 mm) to the smallest UI (75-106 μm), which is the final value for the smallest UI. This last value is also the sum of all the diamonds. The cumulative data either decreases or stays the same as the UIs increase, as seen in column 7 of Table I. Representing the data in this manner reduces the amount of variation 'noise' in the data, so making it easier to observe trends.
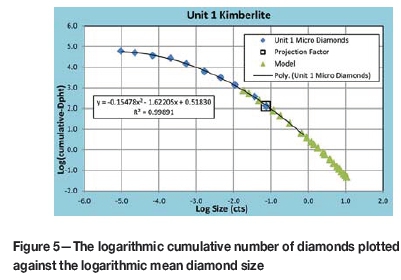
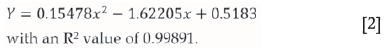
When calculating the cumulative data for a microdiamond population, an estimate is made for the total number of macrodiamonds expected in the kimberlite, known as the 'projection factor'. This projection factor is based on the cumulative distribution of the microdiamonds and the coefficient of determination (R2), which includes the projection factor point. The projection factor is placed in the preceeding UI, as highlighted in yellow in Table I. The projection factor for the Unit 1 kimberlite was; 130 diamonds of size of 1.7 mm and produced an R2 value of 0.99891.
Converting to logarithms and fitting the quadratic curve
In order to analyse the lognormal data in a spreadsheet, both the MDS (in carats) and the cumulative number of diamonds, for each UI were converted to logarithms as shown in columns 5 and 8 of Table I. The data was plotted as denoted by the blue diamonds, including the projection factor, as seen in Figure 5, and a quadratic curve fitted to the data. In the case of the Unit 1 kimberlite, the quadratic formula is:
Applying the quadratic formula to the required macrodiamond distribution
The formula for the quadratic curve seen in Figure 5 and given in Equation [2] was applied to the size intervals for the macrodiamonds as seen in column 3 of Table II. The macrodiamond distribution used was based on the standard size intervals employed for valuing the diamonds. This was feasible since the formula for cumulative data is not restricted to UIs.
To calculate the number of diamonds in each size fraction (column 5), the cumulative logarithmic data (column 3) was first calculated as an exponent of 10, as seen in column 4 of Table II, and the difference between consecutive size intervals was determined, as seen in column 5 of Table II. The grade of each size interval, column 6, was calculated by multiplying the number of diamonds in the size interval by the mass of diamonds for that interval. The summation of column 6 is the macrodiamond grade, assuming 100% recovery.
However, in an operating diamond processing plant not all the diamonds will be fully liberated and recovered. In particular, the smaller the diamond the lower the probability of liberation and recovery. This loss is evident from the fact that the number of the smaller diamonds recovered by the processing plant (24 Dpht) is less than 6% of the number recovered by chemical dissolution method (439 Dpht).
Finally, the estimated production grade is calculated by correcting for the plant losses by subtracting decreasing percentages of subsequent size intervals from the total, starting at 90% for the 1 mm diamonds, 70% for 1.4 mm diamonds, 50% for the 1.7 mm, and 30% for the 2.3 mm diamonds.
The microdiamond and macrodiamond distributions
In this study, natural diamond populations from three prospective deposits were used to evaluate the suitability of the data modelling methodology outlined above for predicting macrodiamond counts.
The macrodiamonds from each of these three propective deposits were recovered via three different methods. The first method was a small underground mining exercise, the second was a large-diameter drill (LDD) programme, and the third method was a high-voltage pulse-power fragmentation process.
Unit 1 kimberlite
The microdiamond grade analysis of the Unit 1 kimberlite is seen in Figure 5 and again in Figure 6. The microdiamond distribution is represented by the blue diamonds, including the calculated 'projection factor' which has a square around the data-point. The modelled macrodiamond distribution is represented by the green triangles and the actual macrodiamond distribution, as obtained from conventional mining processes, by the purple circles. The macrodiamond distribution deviates significantly from the modelled macrodiamond distribution in the smaller size range (1-3 mm) due to inefficiencies in the liberation and recovery of these smaller, low-value diamonds. The list of Unit 1 macrodiamonds recovered in the bulk sample is given in the Appendix.
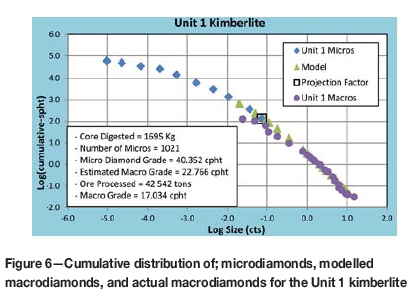
The accuracy of this cumulative methodology to estimate the recovery grade of the Unit 1 kimberlite, is demonstrated by how closely the actual recovery curve tracks the modelled curve. Furthermore, the results predicted that 144 diamonds >1 mm in size with a combined mass of 22.766 ct would be liberated and recovered for every 100 t of kimberlite mined and processed. The actual number of >1 mm macrodiamonds recovered for each 100 t of kimberlite processed was 129, with a mass of 17.047 ct. The results also predicted that at least one 1.8 ct diamond would be recovered with every 104 t processed, while in reality, at least a 1.8 ct diamond was recovered with every 106 t processed - this last observation being the more accurate prediction of the methodology.
Unit 2 kimberlite
The microdiamond grade analysis of the Unit 2 kimberlite is seen in Figure 7. The microdiamond distribution is represented by the blue diamonds, including the calculated 'projection factor' which has a square around the data-point. The modelled macrodiamond distribution is represented by the green triangles and the actual macrodiamond distribution, as obtained from the LDD programme, is represented by the red squares. Again we see the macrodiamond distribution deviate from the modelled macrodiamond distribution in the smaller size range due to inefficiencies in the liberation and recovery of these smaller diamonds. There were also a number of broken diamonds due to the mining process, and this is observed in the deviation of the red squares from the green triangles in the larger size fractions. The list of Unit 2 macrodiamonds recovered in the LDD programme is given in the Appendix.
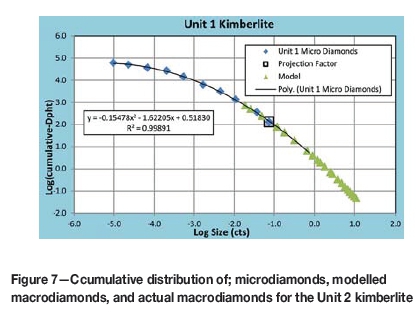
In this example, the predicted number of >1 mm macrodi-amonds that would be recovered for every 100 t of kimberlite processed is 55, with a combined mass of 7.493 ct. The actual number of >1 mm diamonds recovered was 63, with a combined mass of 5.526 ct. The results also predicted that at least one 0.9 ct diamond would be recovered with every 100 t processed, while in reality, 180 t were required for the recovery of a 0.9 ct diamond.
Unit 3 kimberlite
The microdiamond grade analysis of the Unit 3 kimberlite is seen in Figure 8. The microdiamond distribution is represented by the blue diamonds, the modelled macrodiamond distribution by the green triangles, and the actual macrodiamond distribution, as obtained from a highvoltage pulse-power fragmentation process, is represented by the red stars. We note that the high-voltage pulse-power fragmentation process is able to liberate all the diamonds, althugh recovery was still by dense media separation (DMS) and hand-sorting. The list of Unit 3 macrodiamonds recovered is given in the Appendix.
High-voltage pulse-power fragmentation is an expensive process and only 20 t of kimberlite was processed using this technology. In the model, the predicted number of >1 mm macrodiamonds for 20 t of the Unit 3 kimberlite was 194 with a total mass of 36.636 ct. The actual number of >1 mm macrodiamonds recovered from the 20 t sample was 194, with a total mass of 30.695 ct. The results also predicted that at least one 6 ct diamond would be recovered in a 20 t sample, while in reality, a 6.5 ct diamond was recovered.
Discussion
Using the cumulative data ensures that data arrays either always increase, always decrease, or remain constant, thus reducing the amount of variation 'noise' in a data-set. Using cumulative data-sets and quadratic approximations permits the calculation of trends within the microdiamond results, which in turn enables the extrapolation of the data at a higher level of confidence.
An advantage of using the cumulative method for representing the data is that the quadratic formula is independent of the sieve sizes used. The cumulative data can then be used against various size scales such as the valuation scale, the UIs for assessing recovery efficiency, or against the millimetre screen sizes used in the production plant, provided that the start and end sizes are the same.
The microdiamonds were sized into their UIs based on their masses. The UIs were initially a millimetre measurement, but were converted to carats by determining the MDS for the UI. If all the microdiamonds are weighed and the data captured electronically, one should be able to classify the microdiamonds based on their weights in carats directly, without sieving. Sieving requires shaking the diamonds, resulting in diamond-on-diamond contact, potential breakages, and reduced diamond sizes. Lastly, sieving of small particles incurs inefficiencies and errors and is not recommended for such important economic studies.
Conclusions
Arranging the microdiamond distribution data in a cumulative manner, converting the data to logarithms, determining a projection factor by using the quadratic equations with the highest R2 value, and extrapolating this quadratic equation into the macrodiamond region has enabled the macrodiamond grade of Unit 1, Unit 2, and Unit 3 kimberlites to be modelled with a high degree of accuracy.
The same mathematical model established with the microdiamonds can be added to when moving into the bulk sampling phase, and again used in the production phase when plant upgrades are investigated.
From this analysis, the following recommendations are suggested when analysing future data-sets.
► Sizing and tabulating the microdiamonds per UI should be carried out in a simple spreadsheet, according to the mass of the microdiamonds
► The conditions for a microdiamond data-set to be accurately extrapolated are:
- At least 300 microdiamonds in the data-set (though only 200 were used for the Unit 3 kimberite)
- At least seven of the nine UIs to contain microdiamonds
- At least two microdiamonds larger than 0.6 mm to be present in the data-set.
References
Ferriera, J. 2013. Sampling and estimation of diamond content in kimberlite based on microdiamonds. Ecole Nationale Superieure des Mines de Paris. [In English]. [ Links ]
Kruger, L. 2004. Discussions on the advantages and disadvantages of HF and NaOH. Kimberley Micro Diamond Laboratory Pilot Plant project. De Beers. [ Links ]
Limpert, E., Stahel, W.A., and Abbt, M. 2001. Log-normal distributions across the sciences: keys and clues. American Institute of Biological Sciences. BioScience Article, vol. 51, no. 5. May 2001. [ Links ]
McCandless, T.E. 2013. The mystery of microdiamonds. Presentation at UBC Robson Square, Vancouver, 10 April 2013. MCC Geoscience Inc. [ Links ]
Montgomery, D.C. and Runger, G.C. 2011. Applied Statistics and Probability for Engineers. 5th edn. Wiley, New York. [ Links ]
Rombouts, L. 2002. Assessing the Diamond Potential of Kimberlites from Discovery to Evaluation Bulk Sampling. Springer-Verlag. [ Links ]
© The Southern African Institute of Mining and Metallurgy, 2016. ISSN 2225-6253. This paper was first presented at the Diamonds still Sparkling 2016 Conference 14-17 March 2016, Gaborone International Convention Centre.


