


Services on Demand
Article
 English (pdf)
 Article in xml format
 Article references
Indicators

Related links
-
 Cited by Google
 -
 Similars in Google
Share

 Permalink
Journal of the Southern African Institute of Mining and Metallurgy
On-line version ISSN 2411-9717
Print version ISSN 2225-6253
J. S. Afr. Inst. Min. Metall. vol.116 n.8 Johannesburg Aug. 2016
http://dx.doi.org/10.17159/2411-9717/2016/v116n8a4
PAPERS - DIAMONDS CONFERENCE
Using the proportion of barren samples as a proxy for minimum grade in a diamondiferous linear beach deposit - an application of the Nachman model
J. Jacob
Namdeb Diamond Corporation
SYNOPSIS
Over the past 80 years, the Namibian diamondiferous marine placer has been studied extensively to develop solutions for mining and sampling challenges. The types of studies include the statistical modelling of the distributions of the stone counts per sample; investigating the relationship between geology and the grade distribution; assessing the quality potential of the entrapment of the available diamond pulse; using predetermined acceptability of barren samples (zero proportion (Zp) samples) to model distributions; optimal sample sizes; and more. During early-stage project evaluation it is more important to find out if a particular area is likely to be above a specific cut-off grade than to focus on sampling for the purpose of accurate resource estimation. Previous work using mixed Poisson and Sichel distributions to model the abundant onshore diamond data has been very successful in modelling the long-tailed nature of these linear beach deposits. The means of these distributions are, however, sensitive to extreme values. Technical and cost constraints prevent a similar scale of sample collection in an adjacent, geologically equivalent, submerged beach environment. A method not sensitive to extreme values is thus required to make early-stage assessments of the likelihood that the grade of a particular target is above a minimum cut-off grade. The Nachman model describes the functional relationship between the mean population density and proportion of barren patches ( Zp) in a patchy environment. A prerequisite for using the Nachman model is that the underlying data must be modelled using a negative binomial distribution (NBD). The case study data is from an analogous area adjacent to the exploration target and meets the NBD requirement. It is thus appropriate to apply the Nachman model. The Nachman model provides an opportunity to use the observed Zpto predict the mean grade for an area at the very early stage of an exploration project. In future, early-stage exploration data from a homogenous geological zone exhibiting characteristics of the Nachman model assumptions can thus be used to rank and target those areas that show potential to be above the minimum required grade cut-off for follow-up sampling and inclusion in the mine planning cycle.
Keywords: diamond sampling, marine placer, diamond distribution, Nachman model.
Introduction
Diamond mining of linear beaches along the southwestern coast of Namibia has been carried out since the early 1930s. The onshore raised beaches, stretching 100 km north of the Orange River mouth, have been virtually mined out. Mining of the extension of the raised onshore beaches continues below present-day sea level using a process of beach accretion (Jacob et al., 2013).
Between the 1930s and the 1960s some 26 000 samples were collected during the initial delineation of the diamondiferous raised beach deposit along the 100 km coastal strip north of the Orange River mouth. The delineation took the form of 1 m wide coast-perpendicular trenches sampled at 5 m intervals, resulting in a sample support size of 5 m2 (1 m x 5 m). These trenches are mostly spaced 500 m apart along the coast (Figure 1). Detailed logging and record keeping of the exact locations where diamonds were found are preserved in hand-drawn trench sections. During this delineation trenching campaign, six raised beaches, A- to F-beach, were identified, with the A-beach closest to the present-day shoreline and the F-beach the furthest inland.
Overview of previous statistical work on diamondiferous marine placers
The Namibian diamondiferous marine placer has been studied extensively over the past 80 years to develop solutions for mining and sampling challenges. The types of studies include (a) statistical modelling of stone count distributions per sample; (b) using mixed distributions to describe the occurrence of diamonds in trapsites; (c) investigating the relationship between geology and sample grade; (d) determining an optimal sample size using a preselected sample zero proportions (Zp); (e) determining optimal sample sizes, and more. A summary of these studies is given below.
Statistical modelling of the stone count per sample
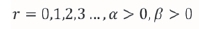
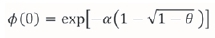
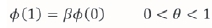
The grade valuation of diamond populations is governed by two aspects: the number of individual stones per sample and the size distribution of the individual stones. Sichel (1973) derived a distribution function that could successfully model the number of stones per sample using a mixed Poisson probability distribution. This distribution is especially useful in modelling populations with a high Zpand a long positive tail.
Sichel's distribution function (Sichel, 1973) for the number of stones is given by:
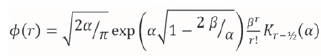
with Κγ (.) the modified Bessel function of the second kind of order γ, with  , and
, and
 and
and
 and
and

where  is the average number of stones per sample.
The expected frequencies are calculated from the recurrence formula:
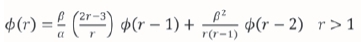
starting with the first two frequencies:
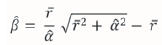
Sufficient samples are required to define the parameters of the distribution in order to determine the estimated proportion of barren samples,  , and the mean r with reasonable confidence. Once such a distribution has been fitted, the mean and associated confidence limits can be determined.
Using mixed distributions to describe the occurrence o fdiamonds in trapsites
Diamond (discrete particle) concentration in a marine placer environment is influenced by the quality of diamond pulses available to be concentrated and the quality of the trapsites. A concept of regionalized potential described by Kleingeld (1987) combines the impact of dependent factors influencing diamond concentration. The geological processes at play during diamond deposition are complex. One scenario could be that a diamond pulse containing a relatively high proportion of diamonds is deposited over an area with poor trapsites. A different scenario could be that a high diamond content pulse of gravel is deposited over an area with good trapsites, but that subsequent marine reworking processes could have removed diamonds from these trapsites. The model developed by Kleingeld (1987) makes use of the hypothesis that the number of particles within any region is considered to be a sum of Poisson pockets, with the particles per trapsite randomly distributed.
Kleingeld (1987) used 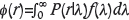 with
with  a Poisson and ƒ(λ) a gamma distribution function, to model the number of particles per sample and the distribution of the trapsites. Kleingeld concluded that when applying Sichel's model,
  can be estimated with some degree of accuracy only by using large numbers of samples so that a good statistical chance exists for encountering the richer trapsites. Also, through exhaustive testing, Kleingeld determined that using the Zpof samples and the mean to determine the Sichel distribution parameters is far superior to using the method of moments.
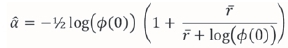
With  the sample mean and
  the sample Zp,
  and
and  be determined from:
For early-stage exploration decisions, when only a few data points are available, it will be challenging to model the Sichel distribution with confidence.
Relationship between geology and sample grade
The complexity of diamondiferous marine placer geological models cannot be overstated. Oosterveld et al. (1987) made an attempt to determine the relationship between the geology and statistical parameters obtained from diamond sampling for the diamondiferous marine placer of southwestern Namibia. It was found that those highly complex geological controls influencing the distribution of diamonds could only be described in broad terms by the statistical parameters. For this reason, blocks up to 5 km in length along the coast were estimated (Oosterveld et al., 1987). The large blocks were subsequently sub-blocked into 500 m lengths situated between 1 m trenches and 100 m to 300 m widths perpendicular to the coast. Two smoothed parameters of the Sichel distribution are used as follows: the contribution is associated with the quantity of trapsites and the  contribution with the abundance of diamonds in trapsites (i.e. the quality of trapsites). Oosterveld et al. (1987) stabilized the term by smoothing
  along the coastline with a moving average, based on groups of at least 50 samples. The parameter is calculated with
  fixed a priori. The estimation of Sichel's mean (Sichel, 1973) is log-transformed into:
where
and

Oosterveld et al. (1987) related the smoothed parameters to broad-scale geological observations, diamond pulse, and footwall conditions determining the abundance of trapsites. It was concluded that the highly complex geological controls influencing the spatial distribution of diamonds could only be modelled in broad terms by the statistical parameters (Figure 2).
Determining an optimal sample size using a preselected sample Zp
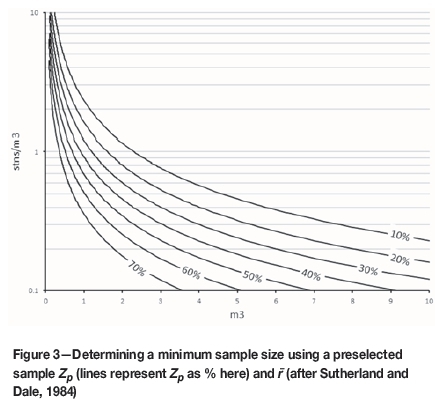
A challenge that exists prior to the modelling of the individual stone data is the decision about an appropriate sample support size for data collection. In determining a sample size, Sutherland and Dale (1984) developed an approach based on Sichel's mixed Poisson distribution, where an acceptable sample Zpis preselected. Based on assumptions about the underlying probability distribution and mean number of stones per sample, a minimum sample size can be determined. In early-stage resource exploration, prior to sufficient number of samples being available, it is difficult to quantify the mean value f of the target. If, however, a reasonable value for fcan be determined early on in a project, then Figure 3 (after Sutherland and Dale, 1984) is very helpful in determining a minimum sample size. This approach does not, however, guide early-stage decision-making regarding continuing with or abandoning an exploration target when there is still insufficient data available and the mean and tail of a target's distribution have not yet been well established.
Determining an optimal sample size using Pierre Gy's sample theory
The application of Pierre Gy's sampling formula to express the sampling error when a volume of material is considered is used by Royle (1986) in an alluvial diamond deposit example. The formula makes use of the physical characteristics of the material being sampled, with the mean squared sampling error expressed as:
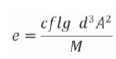
with c = Dm/a, Dmthe density of the mineral, a the proportion of the mineral, ƒ a shape factor, l expressing liberation, g a size range factor, d the mesh size, A the mean value of the sampled material, and M the mass of the sample. Royle (1986) outlines detail regarding values to be used for these constants.
From an indication of the expected grade of a deposit, or making use of a minimum economically required cut-off grade, the sample error can be determined. By changing the sample volume and making use of an assumed 1.96 , the error variance can be used to adjust and express 95% confidence limits for the mean value of the material.
Royle (1986) notes that Gy's formula gives an order-of-magnitude sample size and that, if possible, larger samples would be better. Of utmost importance, however, is the fact that no mathematical or statistical procedure can improve poor quality samples. All effort should be focused on ensuring sample integrity and minimizing the introduction of sample error.
Problem statement
Technical and cost constraints will always be present in exploration efforts targeting diamondiferous submerged beaches. During early-stage project evaluation it is more important to find out if a particular area is likely to be above a selected cut-off grade than to focus on sampling for the purpose of accurate resource estimation. Previous work on statistical distributions of diamonds was based on abundant onshore data, which has been used very successfully in modelling the long-tailed nature of these linear beach deposits. Technical and cost constraints militate against using a similar sampling campaign in a geologically equivalent submerged beach target environment. A method not sensitive to the occurrence of extreme values and reliant on less data is thus required in order to make early-stage assessments as to the likelihood that the grade of a particular target is above a certain cut-off grade.
Proposed method of applying the Nachman model to diamond occurrences
Description of the Nachman model
Nachman (1981) described the functional relationship between the mean population density and the proportion of unoccupied (mite-free) patches (Zp) in a patchy environment, as initially applied to mite counts observed on cucumbers in glasshouses. The Nachman model assumes that the underlying population follows a NBD distribution. Plotting the following transformations against each other shows a linear relationship between the mean discrete counts and the zero proportion.
Zero proportion (Zp) transformation:
Mean number of occurrences (m) transformation: log (m) This linear relationship can then be plotted and used to predict the mean of the data based on the observed Zp.
Case study
As discussed previously, the Sichel distribution fits the long-tailed linear beach data reasonably well. Looking at the 26 000 sample results per trench spaced at about 500 m intervals along the 100 km long coastal strip (discarding any grouping containing fewer than 30 samples, where a grouping represents a section of the beach covered by a trench), the two-parameter NBD also shows a reasonable good fit to the data (Figure 4).
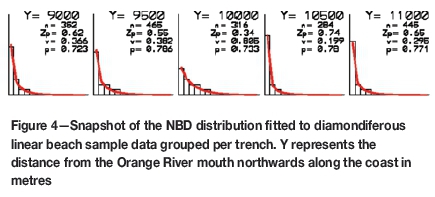
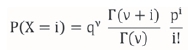
The two-parameter NBD depends on parameters ν and p (Kleingeld, 1987) with the probability density function given by:

The mean m and variance σ2can be determined from its moments (Kleingeld, 1987):
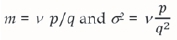
from which
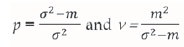
The assumption required for using a Nachman model, that the data can be modelled by a NBD, is thus valid. For this reason it is thus reasonable to use the Nachman model to guide exploration effort based on the Zp of data collected.
Results
Recognizing that there would be measurement error in both Zpand the mean, a Deming regression (Deming, 1943) is fitted to the Nachman-transformed data (Figure 5a). The regression line is subsequently shifted by changing the y-axis intercept in such a way that 95% of the data falls above it (Figure 5a). The back-transformed Deming regression line (Figure 5b) illustrates that if, for example, Zpis equal to 0.60 then 95% of the data will be above a mean of 0.67 stones per 5 m2. Based on these results it is perhaps thus not surprising that more than 95% of the onshore diamondiferous raised beach deposit along the 100 km strip north of the Orange River mouth has been mined out to date, because it is above the cut-off grade of 0.05 stones per 5 m2. An application of this method applied to limited submerged beach data is shown in the Appendix.
Discussion and conclusion
Previous publications (Sichel, 1966; Sutherland and Dale, 1984;, Sichel, 1987; Kleingeld, 1987; Oosterveld et al., 1987) described diamond distributions using variations of the mixed Poisson model. The means of these distributions are, however, sensitive to extreme values and many data points are needed to stabilize the results.
The Nachman model (Nachman, 1981) describes the functional relationship between the mean population density and proportion of unoccupied patches (Zp). In the case study, the available analogous data from an area adjacent to the exploration target can be modelled using a NBD. It is thus reasonable to apply the Nachman model. The Nachman model approach provides an opportunity to use the proportion of barren samples to predict the mean grade for an area during the very early stage of an exploration project. In future, early-stage exploration data from a homogenous geological zone exhibiting characteristics associated with the Nachman model assumptions can thus be used to rank and target those areas that show potential to be above the minimum critical grade cut-off for follow-up sampling and inclusion in the mine planning cycle.
Comparing Sutherland's approach for determining a minimum sample size using a preselected sample Zpand mean (Figure 3) and the outcome of applying the Nachman model (Figure 5), the following is observed:
► A Zpof 0.60 (according to the Nachman model) predicts a minimum grade of 0.67 stones per 5 m2 or 0.134 stones per m2
► Considering a diamondiferous gravel thickness of 1 m, Sutherland's model based on Sichel's distribution at a 5 m2 support predicts a grade of 0.10 stones per m2 for Zpequal to 0.60
► The minimum grade predicted by the Nachman model is higher than that by Sutherland's theoretical model based on the Sichel distribution. Since the Nachman model results are based on actual empirical data, it is deemed more appropriate compared to the theoretical Sichel model results. This affirms the reasonableness of using the Nachman model's Zpto predict a potential minimum grade based on samples obtained from a single geological zone.
Acknowledgements
The author gratefully acknowledges the assistance of Chris Prins (Anglo American Corporation/ University of the Witwatersrand) in preparing this paper. The author would like to thank the De Beers Group of Companies, Anglo American Corporation, and Namdeb Diamond Corporation Mineral Resource Departments for their support, providing access to data and permission to publish this work. The research presented in this paper forms part of a greater resource development project, also incorporated in a PhD study 'Contextualized risk mitigation based on geological proxies in alluvial diamond mining using geostatistical techniques' at the University of the Witwatersrand. The author appreciates the comments and helpful suggestions from the reviewers.
References
Deming, W.E. 1943. Statistical Adjustment of Data. Wiley, New York. [ Links ]
Jacob, J., Prins, C., and Oelofsen, A. 2013. Determination of sampling configuration for diamondiferous gravel occurrence using geostatistical methods - applied to a probe drill platform. Proceedings of Sampling and Analysis: Best Practice in African Mining, Misty Hills, Mulderdrift, Gauteng, South Africa, 4-6 June 2013. Southern African Institute of Mining, Johannesburg. [ Links ]
Kleingeld, W.J. 1987. La géostatistique pour des variables discrete. PhD thesis, School of Mines, Paris. [ Links ]
Nachman, G. 1981. A mathematical model of the functional relationship between density and spatial distribution of a population. Journal of Animal Ecology, vol. 50, no. 2. pp. 453-460. [ Links ]
Oosterveld, M.M. 1972. Ore reserve estimation and depletion planning for a beach diamond deposit. Proceedings of the Tenth International Symposium on Application of Computer Methods in Mineral Industry. South African Institute of Mining and Metallurgy, Johannesburg, South Africa. pp. 65-71. [ Links ]
Oosterveld, M.M., Campbell, D., and Hazell, K.R. 1987. Geology related to statistical evaluation parameters for a diamondiferous beach deposit. Proceedings of APCOM 87: Geostatistics. 87. Proceedings of the Twentieth International Symposium on the Application of Computers and Mathematics in the Mineral Industries. vol. 3. Lemmer, I.C. (ed.). South African Institute of Mining and Metallurgy in association with the Council for Mineral Technology, Johannesburg. pp. 129-136. [ Links ]
Royle, A.G. 1986. Alluvial sampling formula and recent advances in alluvial deposit valuation. Transactions of the Institution of Mining and Metallurgy Section B: Applied Earth Science. pp. B179-B182. [ Links ]
Sichel, H.S. 1966. The estimation of means and associated confidence limits for small samples from lognormal populations. Proceedings of the Symposium on Mathematical Statistics and Computer Applications in Ore Evaluation. South African Institute of Mining and Metallurgy, Johannesburg. pp. 106-122. [ Links ]
Sichel, H.S. 1973. Statistical valuation of diamondiferous deposits. Journal of the South African Institute of Mining and Metallurgy, vol. 73. pp. 235-243. [ Links ]
Sichel, H. S. 1987. Some advances in lognormal theory. APCOM 87: Geostatistics. 87. Proceedings of the Twentieth International Symposium on the Application of Computers and Mathematics in the Mineral Industries. Vol. 3. Lemmer, I.C. (ed.). South African Institute of Mining and Metallurgy in association with the council for Mineral Technology, Johannesburg. pp. 3-8. [ Links ]
Sutherland, D.G. and Dale, M.L. 1984. Method of establishing the minimum sample size for sampling alluvial diamond deposits. Transactions of the Institute of Mining and Metallurgy Section B: Applied Earth Science, vol. 93. pp. B55-B58. [ Links ]
This paper was first presented at the Diamonds still Sparkling 2016 Conference 14-17 March 2016, Gaborone International Convention Centre.
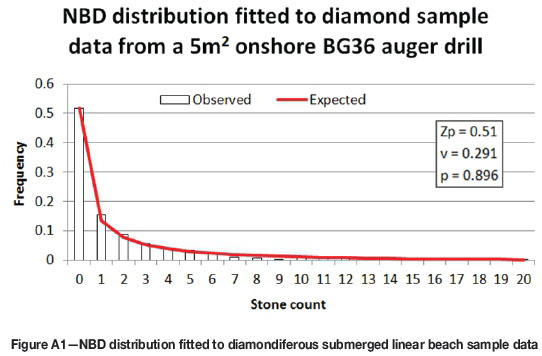
Owing to a process of beach accretion (Jacob et al., 2013), areas previously not accessible for sampling could recently be sampled. Figure A1 shows a NBD distribution fitted to 613 sample results from beach accretion areas. The 613 sample results are spatially grouped into 13 groups. Each group contains a minimum of 40 samples (Figure A2a).
► A Zpof 0.60 (according to the Nachman model) predicts a minimum grade of 0.80 stones per 5 m2 or 0.16 stones per m2 (Figure A2b)
► In this example the minimum grade predicted by the Nachman model of 0.16 stones per m2 is higher than Sutherland's theoretical model prediction of 0.10 stones per m2 based on the Sichel distribution (Figure 3). Since the Nachman model results are based on actual empirical data, it is deemed more appropriate compared to the theoretical Sichel model results. This affirms the use of the Nachman model's Zpto predict a potential minimum grade based on samples.
As more sample data become available the application of the Nachman model to predict a potential minimum grade will be assessed and used.


