


Servicios Personalizados
Articulo
 Inglés (pdf)
 Articulo en XML
 Referencias del artículo
Indicadores

Links relacionados
-
 Citado por Google
 -
 Similares en Google
Compartir

 Permalink
Journal of the Southern African Institute of Mining and Metallurgy
versión On-line ISSN 2411-9717
versión impresa ISSN 2225-6253
J. S. Afr. Inst. Min. Metall. vol.116 no.7 Johannesburg jul. 2016
http://dx.doi.org/10.17159/2411-9717/2016/v116n7a3
PAPERS - DANIE KRIGE GEOSTATICAL CONFERENCE
The practical implementation of uniform conditioning at AngloGold Ashanti African Operations, and a case study as applied for potential underground mining at Nyankanga pit, Geita gold mine, Tanzania
V. Govindsammy
AngloGold Ashanti
SYNOPSIS
The use of uniform conditioning (UC) as an estimation technique to produce robust recoverable resource models has been implemented across various operations within the AGA Continental Africa Region. This paper outlines the relevance of using UC as an estimation technique to provide a robust estimate for use in underground mine planning and published Mineral Resource statements. The change-of-support model forms the basis on which planning and financial decisions are made, and it is therefore imperative that appropriate validations and checks against 'reality' are carried out prior to implementation. The process and validation techniques employed for UC will be discussed using a case study from the Nyankanga orebody at Geita gold mine in Tanzania. The deeper portions of the orebody constitute potential underground mining areas, and by using appropriate reconciliations it can be shown that the UC model, in spite of the inherent lack of local spatial accuracy, can be used to estimate the potential underground stopes with a lower error of estimation than other techniques.
Keywords: discrete Gaussian model, selective mining unit, dispersion variance, population variance, block support correction, information effect
Introduction
The successful implementation of uniform conditioning (UC) requires a good understanding of both project-scale and local-scale geological controls on mineralization. On a project scale, orientation of the mineralization as well as the nature of ore/waste contacts, together with an understanding of size and distribution of high- and low-grade ore blocks, forms a key component of the UC process. Any geological feature that disturbs the main mineralization must also be understood and modelled correctly. In addition to the basics of any estimation technique like proper database protocols, quality assurance and control (QA/QC) for both laboratory and drilling practices, and sound geological models, UC is heavily reliant on proper domaining and robust kriged estimates. This differs from some statements in the literature, that UC performs well when domains are not strictly stationary (in theory, loose domaining can be used, but experience has found that this is not the case in practice). UC is a variation of Gaussian disjunctive kriging that is better adapted to situations where stationary is not very good (Vann, 1998). The change-of-support model for the Nyankanga project uses a drill pattern of 40 x 40 x 1 m for Indicated Resources and 40 x 80 x 1 m for Inferred Resources to produce grade-tonnage relationships on a support size of 10 x 10 x 3.33 m. The behaviour of this grade-tonnage relationship is a reflection of the local geological controls on mineralization. Practical reconciliation studies have shown that improvements in the geological and statistical domains of the Nyankanga orebody results in better local accuracy while still preserving the global accuracy that comes with a UC model. This allows for the UC model to be used for both underground and open pit mine planning scenarios.
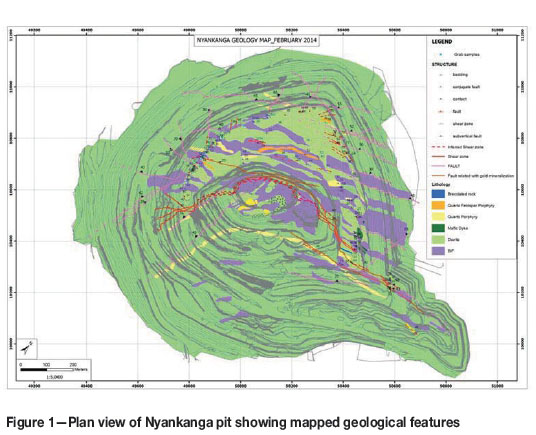
The Nyankanga deposit forms the southwestern limit of the current known resources along the Geita central trend and suboutcrops in low ground below 10 to15 m of barren, transported laterite cover. The main orebody ranges up to 100 m in thickness in the central part of the deposit and dips subparallel to the stratigraphy. Two phases of syn- to post-mineralization dykes occur throughout the deposit and are thought to represent late felsic evolution of the intrusive system at Nyankanga. Initial emplacement of en-echelon felsic porphyry (FP) dykes 50 to 100 m apart occurred dominantly along preexisting joint sets dipping 40 to 50 degrees in a northwesterly direction with some dilation parallel to the ore zone where they crosscut the stratigraphy. A barren, final-stage quartz porphyry (QP) dyke crosscuts and displaces all lithologies and mineralization and has been emplaced along similar joint-related structures.
Another late-stage QP dyke dips 70 to 80 degrees to the southeast. All dykes follow the same sigmoidal drag-folded pattern as the bedding and orebody (Figure 1).
On a local scale, the mineralization model follows a complex interplay between structure and lithology. The higher grade mineralization occurs mostly in the banded iron formation (BIF) and lower grade mineralization mostly occurs in the microdiorite (MD) units. High-grade mineralization can traverse into the MD unit manifested as brecciated zones. The felsic intrusive that cuts through the orebody is mostly barren, but some high-grade samples occur in the contact areas due to remobilization of gold.
The initial UC model for the Nyankanga deposit at Geita gold mine was produced in 2006 (Gaunt, 2006) with guidance and technical support provided by V.A Chamberlain from the corporate office. Mineral Resource models created prior to this used deterministic wireframes of the ore zones that were subdivided into BIF and MD type mineralization. Kriged block models with block sizes generally much smaller than the drill-hole spacing were used as a basis for the annual published Mineral Resource and mine planning processes. Over the last 7 years, numerous geologists worked on gaining a better understanding of the local geological controls and the Resource model using UC as a primary technique evolved through regular analyses of reconciliations, allowing for continuous improvements in the practical implementation of this technique.
Key checks prior to UC
Statements like 'UC does not work' are common in the industry, and learning experience from Geita has shown that insufficient time spent on data validation, QA/QC checks, improper domaining, and substandard optimization of kriging parameters can lead to poor-quality or biased kriged estimates, resulting in poor reconciliations between the UC and grade control models.
During the exploratory data analysis stage it is important to ensure that all drill-hole information is representative (i.e. sampled across the entire orebody width) and sample intervals reflect the variability at an appropriate width. Compositing of sampling data was done on a 1 m interval since this was the accepted sampling interval that represents the local grade-lithological relationships.
Is your deposit suited for UC?
Two basic models exist that describe the spatial distribution of the variable to be estimated - the mosaic- and diffusion-type models. In a mosaic-type model the edges of the high-grade material are not systematically lower than central areas, while in a diffusion-type model, high and low grades are separated by intermediate grade material (Deraisme, 2012). Gaussian-based methods like the discrete Gaussian model (DGM) are applicable when the orebody displays characteristics of the diffusion model.
When using UC a Gaussian distribution is employed. The Gaussian transformed grades, however, have to show properties of bi-Gaussianality. This simply means that linear combinations of data pairs separated by a vector h follow a normal distribution. This is an important assumption when using UC, since the DGM change of support assumes that point values within a block are correlated with the block values (Deraisme, 2012).
In addition to the test for bi-Gaussianality one should initially test for normality of the transformed variable (Harley, 2009). This is conveniently done using a normal probability plot, which must show that the standard Gaussian data-set has a mean close to zero and standard deviation close to unity. These tests were conducted in Isatis and confirmed that UC is an appropriate estimation method.
Domaining: a key component of exploratory data analysis
The histograms of samples together with the corresponding variograms and the subsequent DGM change-of-support model from points to blocks are fundamental to the UC process. Effective domaining is therefore critical, since the characteristics of each population (in the form of histograms and semivariograms) can be adequately determined. The local geology at Nyankanga is complex and hence numerous domains have been constructed for the entire project. The domaining process considered all geological features on strike of the orebody as major domain boundaries. Subdomains to reflect the local geological variation were then created by analysing grade variation in relation to local geological features. This step is critical to ensure that robust kriged estimates are achieved.
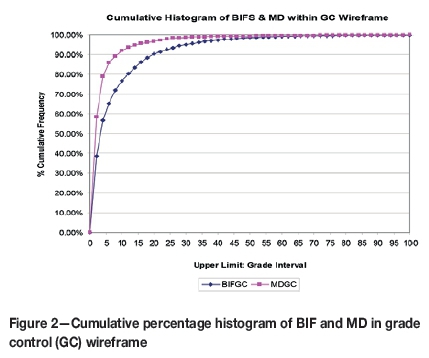
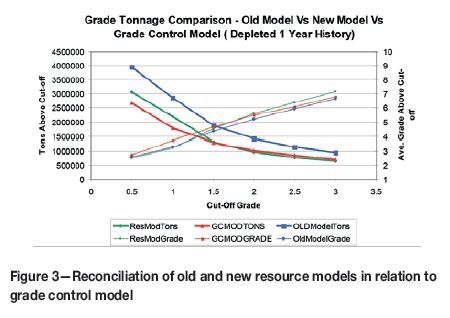
Strong relationships between lithology and grade were identified, and by conducting trend analyses across the three dimensions of the orebody suitable subdomains were created. The orebody limit was chosen at 0.5 g/t (boundary of ore wireframe). This corresponded in some instances with a structural contact along a thrust surface. The grade rapidly decreases to below 0.5 g/t as one move across the orebody limit. Subdomains are then created based on BIF- and MD-hosted rock types, since the grade signatures within these units are significantly different (Figure 2). This key aspect of domaining forms an integral part of separating high- and low-grade units of the orebody, which aids in planning for underground mining scenarios (Table I). Historical reconciliations to grade control models were poor when these domains based on BIF and MD was not created. Analyses of these reconciliations showed a significant overstatement of high-grade tonnages (Figure 3). In Figure 3, 'Old Model' refers to combined BIF and MD domains and 'ResMod' refers to the new resource model where BIF and MD were treated as separate domains. 'GC MOD' refers to the grade control model that was generated after close-spaced drilling.
Statistics within the domains
Table I shows significant differences in mean grade and variance between the BIF and MD units. The coefficient of variation is also significantly high, suggesting highly skewed distributions. The high-grade tails form a significant portion of the gold above the economic cut-off. The orebody is up to 100 m wide in the central portion and therefore multiple cutbacks are planned to access the deeper portions of the ore. The economic viability of these cutbacks depends on large amounts of capital spending and the relatively higher grade of ore to pay back this capital and generate profits. UC was therefore deemed an appropriate technique to estimate these high-grade units from relatively widely spaced drill-holes (40 x 40 x 1 m). It was therefore deemed important to validate the change-of-support model that translates point distributions as shown in Figure 2 to mineable block units.
Validation of the kriged estimates
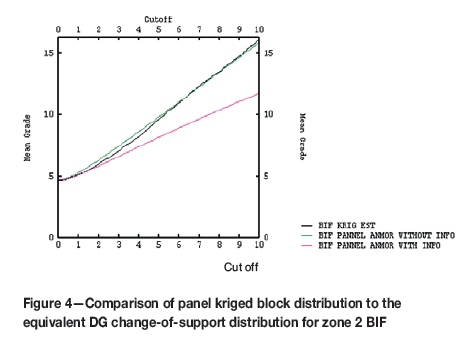
A robust semivariogram, optimal kriging parameters, and a validated data-set may be used to produce panel estimates per geological/geostatistical homogenous zone. The standard checks like stepping through sections and comparing kriged estimates to sample information, checking the effect of high-grade outliers (especially in poorly informed blocks), and comparing local kriged estimates with local sample averages were performed. In addition to this, the DGM change-of-support distribution was validated against the distribution of panel kriged blocks. An example of this validation is shown for one of the domains. The change of support using the point variogram and declustered sample point file was conducted to produce a global grade-tonnage relationship on the same support as the panel kriged blocks. The global distribution which shows the downside risk due to information effect closely resembles the kriged distribution on 40 x 40 x10 m panel support (Figure 4).
Deviations in the above relationships can be due to a number of reasons and hence this forms a good validation technique. Practical issues that could contribute to such deviations are summarized as follows:
1. Significant nugget effect and ranges that may be shorter than the panel size to be estimated. Kriged panel size is much smaller than the drill-hole spacing
2. Poor choice of search neighbourhood and number of samples used to estimate panels
3. Closer and wider spaced drill-hole areas being estimated with the same estimation parameters (block size, minimum/maximum number of samples, block size, search neighbourhood)
4. In areas of wider spaced drill-hole information, the presence of a few high-grade outliers causes significant smearing of grade in the kriged distribution.
Prior to the adoption of UC, all of the above were checked and modified if necessary to produce robust kriged estimates of panel grades. This ensures that the local accuracy of the kriged estimates has not compromised the equivalent global accuracy.
Uniform conditioning
UC was first developed to relax the hypothesis of strict stationarity needed for disjunctive kriging and conditional expectation (Rivorard, 1994). In practice, however, it was observed that effective application of domaining resulted in improved reconciliations (Figure 3).
UC is performed for each domain and requires:
1. Gaussian anamorphosis modelling on point support, which requires a normal-score transformation
2. A change-of-support correlation (or coefficient) is determined for a selective mining unit (SMU) support (r). During this stage it is also possible to account for the information effect resulting from the final estimates of the SMU
3. A change-of-support coefficient at a panel support (R) is determined from the panel dispersion variance and Gaussian variance properties of the anamorphosis model.
Gaussian anamorphosis modelling on point support
Knowing a representative histogram of point samples allows prediction of the recoverable resources by applying a cut-off grade. A model of the distribution with an appropriate change of support is needed to compute the global recoverable resources for any cut-off. Isatis uses the discrete Gaussian model (Poisson, 2008).
1. This model corresponds to a diffusion type of model
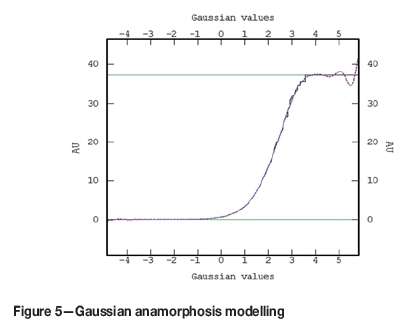
2. Grade distributions are rarely Gaussian. The raw distribution Z(x) is transformed into a Gaussian distribution Y(x): this transformation is called Gaussian anamorphosis and is noted: Z(x) = (Y(x)), as presented in Figure 5
3. The anamorphosis is bijective and invertible: knowing the anamorphosis is equivalent to knowing the histogram, hence recoverable resources may be computed by applying a cut-off on the Gaussian distribution
4. The Gaussian grades need to be bi-Gaussian. Checks for this have been discussed in the preceding section.
The following practical issues need to considered and implemented effectively.
1. Point samples should be declustered to prevent misrepresentation of population histogram characteristics. Drilling data occurs within grid patterns of 20 χ 20 m and 40 χ 40 m for Indicated Resources at Geita; hence a declustered mean was obtained at these drill spacings and compared with the ordinary kriged estimate. On a global basis, the mean grades of point samples and panels are in close agreement (Table II)
2. The declustered mean and variance of the raw data should be in close agreement with the mean and variance of the model fit, and in Gaussian space these should be close to 0 and 1 respectively
3. The tail end of the distribution is modelled up to an acceptable upper limit that represents the domain. In this instance an outlier analysis should be performed and the upper value modelled accordingly. This upper value is further validated after the change of support is performed.
Discrete Gaussian change of support
The theory behind the change of support as used in the discrete Gaussian model is covered in detail by Neufeld (2005). The change-of-support model is applied after the anamorphosis of point data. During this process a function defined by Hermite polynomial expansion is fitted to the data, which provides a mapping of the point variable Z to the Gaussian variable Y and vice versa: (z (x) = Φ(y(x))).
The change of support was conducted for BIF and MD as part of zone 2 in the Nyankanga resource model (Table III). Outlier analyses were performed on these point distributions and 80 g/t and 100 g/t were chosen as appropriate top capping limits for the BIF and MD respectively. Maximum values of 496 g/t and 378 g/t occur within the sampled distributions of BIF and MD respectively.
An error variance associated with the 'future' estimates of SMU in the absence of grade control drilling was computed by applying the information effect. This was determined by using the same semivariograms and realistic grade control drill patterns.
The distributions of SMUs obtained from UC were compared to the global (DGM) distribution obtained from the points to SMU and were found to be in close agreement.
Uniform conditioning - change of support from panel to SMU
As explained above, a change-of-support correlation (r) from points to blocks (SMU) can be computed, and in a similar manner a change-of-support correlation (R) from points to panels is computed. In both instances the variance of SMUs and panels are used and therefore it is important to ensure these variances are accurate.
In areas with wider spaced drill-hole information, the variance of panel estimates (VarZ*, or shown as Bvar in Figure 6) tends to be lower due to the smoothing effect of kriging. In this instance it is advisable to use appropriate dispersion variance (Var ZV*, or shown as Dvar in Figure 6) grouped per geographical areas. In Isatis this can be achieved by using two or three intervals of dispersion variance, and in this case the SMU distributions are accordingly computed to reflect the appropriate dispersion variance (Figure 6).
Checking the dimension of SMU for open pit mining
The risk of selection of the SMU dimensions must, given its importance, be quantified by conducting a selectivity study that takes into account the spatial structure of the mineralization, the size of the SMU, and the data spacing (Chamberlain, 2009).
The SMU is defined as the smallest block that could be mined by the mining fleet, and an ore block marked out in the field will often consist of a number of contiguous SMUs. The equipment fleet used or being evaluated, as well as practicalities like finding maximum value by comparing economic factors against the orebody geometry with minimal dilution, need to be taken into account when defining the SMU.
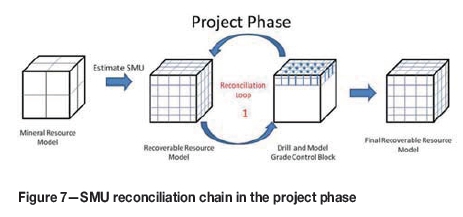
During the initial project phase (Figure 7), the SMU can only be determined empirically. However it is critical that during the latter stages of the Pre-feasibility Study or early ir the Feasibility Study a representative volume of up to one year's production volume is drilled out to grade control spacing. This will allow for a reconciliation of the initial Recoverable Resource model and a further adjustment to reflect the reality of additional information. It will also serve to significantly reduce the level of risk in the early mining phase.
A 10 x 10 x 3.33 m SMU was used in the resource model The current mining fleet at Geita is capable of mining to a selectivity of 10 x 10 x 3.33 m, and larger mining perimeters are normally made up of a series of 10 x 10 m SMUs based on the orebody shape and grade distribution.
Validating the selectivity used for underground mining (UG) Mineral Resources
The current resource model is constructed on a 0.5 g/t resource envelope (wireframe). A kriged block model (40 χ 40 χ 10 m) is sub-celled within this wireframe. Each kriged block is informed with a grade-tonnage curve depicting the grades and tonnages of smaller mineable units (10 χ 10 χ 3.33 m). This is computed using UC. This model is appropriate for open pit planning since complete benches are planned and mined. Ore (according to the various cut-offs, where marginal cut-offs are in the order of 0.9 g/t and the high-grade ore cut-off in the order of 1.1 to 1.3 g/t) and waste are identified via grade control drilling to a 10 χ 5 m spaced grid. All mined material is then appropriately stockpiled. Reconciliations to the original SMU resource model are reasonable and acceptable when done over an annual mined volume for open pit mining.
In the underground mining scenario, mining is carried out according to a higher cut-off (3-4 g/t). From a planning perspective, larger stopes will have to be designed on the higher grade kriged blocks. However since the current resource model is based on a 0.5 g/t resource envelope and 40 m spaced data in the underground areas, the kriged estimates tend to under-represent the variability of the higher grade stope-scale mineable units and the full underground potential may not be realized if kriged blocks are used to identify the higher grade zones. This becomes more evident in the wider portion of the orebody, where a mixture of low-and high-grade blocks tends to result in an average kriged block estimate. In order to assess whether the current UC model is adequate to predict the higher grade tonnage behaviour as can be expected from underground stopes, a study was conducted in a relatively closer-drilled area (Robins, 2010). The placement of the underground stopes will be based on a deterministic high-grade wireframe using 20 x 20 m spaced drilling. Although this still forms part of the open pit mining area, the geological characteristics are expected to extend into the underground mineable portion. The process followed in this study area can be summarized a follows.
1. Based on mapping and drilling information, structural wireframes were computed. Using all relevant geological information, a high-grade (5 g/t) wireframe was generated
2. The high-grade wireframe was then used to guide the string interpretation and produce a resource envelope that geologically holds potential high-grade mineable blocks. The cut-off for which the kriged resources contain all the high-grade material is seen at approximately 2 to 2.5 g/t
3. The resource envelope (produced by 20 χ 20 m spaced drilling) was then estimated using appropriate ordinary kriging parameters. The grade and tonnages were reconciled to the grade control model (produced by 10 χ 5 m spaced drilling) and the UC model (produced by 20 x 20 m to 40 x 40 m spaced drilling).
Generally, the geological model was used to infer continiuty according to the directions of the structural features.
The exploration data was extracted within the 2 g/t resource envelope. A variogram was generated, and using optimized kriging parameters relevant to 20 χ 20 m spaced drilling the envelope was estimated using ordinary kriging into 20 x 20 x 10 m parent block sizes (Figure 8). This mode' was then reconciled to the grade control and original UC models.
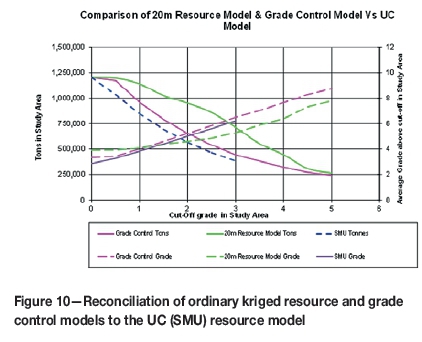
As can be seen in Figures 8 and 9, the grade control model is more variable than the 20 m high-grade resource model. Both of the above models were then reconciled to the original UC model in the mined-out volume (Figure 10).
Description of underground mining method
The planned mining methodology is bottom-up longitudinal stoping, and backfilling with a combination of cemented rock fill (CRF) and loose rock fill (LRF). The CRF negates the need to leave pillars. Slot rises would be excavated either by using airleg mining techniques or longhole drill-and-blast rises with uphole production drilling. (Rees, 2013)
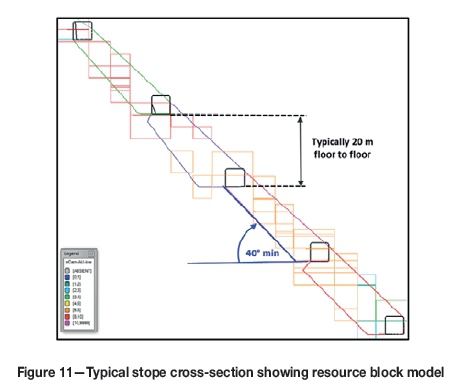
A typical cross-section of the stope design is shown in Figure 11. To ensure a practical mining shape the footwall angle has been maintained at a minimum 40°. It is possible to mine stopes with footwall angles less than 40° but in practice this results in ore being left on the footwall (lower mining recovery).
Based on the above study, which represents a wider portion of the orebody (up to 80 m wide), the following salient conclusions were established.
1. Using all geological information it is possible to delineate relatively higher grade wireframes based on 20 m drill spacing. The shapes of these wireframes are coherent enough to mimic larger underground stopes (1.2 Mt, which represents an annual volume of underground mining, was delineated in this exercise)
2. During the wireframing process the core high-grade units (5 g/t) occur within a broader envelope of >2 g/t material. This process of modelling the lower grade halo around the core high-grade envelope is subjective, and the geological controls on mineralization at this scale are complex and cannot be easily correlated using 20 m spaced data. Closer spaced information is required, as can be seen in Figures 8 and Figure 9
3. Due to the above geological complexities a portion of the internal waste zones tends to be modelled with the high-grade envelope, and the amount of this material is known after grade control has been applied in these areas. Also, the contact of the high-grade stopes tends to more variable than that delineated by using 20 m spaced data. In addition, due to the differences in block support size between the ordinary kriged (20 χ 20 χ 10 m) and the grade control blocks (10 χ 10 χ 3.33 m), a poor correlation in the shapes of the grade and tonnages can be expected between these two models. Therefore incorporating an ordinary kriged model into these high-grade wireframes does not reconcile well with the grade control model and an overstatement of gold of up to 25% at a 2.5 g/t cut-off occurs, as seen in Figure 10
4. The UC model performs better, with closer grade and tonnage reconciliations to grade control. It is therefore suggested that the potential underground stope areas be drilled to a 20 χ 20 m grid as per the original drilling strategy. Higher grade stopes can then be wireframed using the same principles as used in this exercise. Care should be taken, however, to incorporate the lower grade halo (up to 2 g/t) around the high-grade core. This will ensure that all potential high grades are captured. A UC model can then be used for estimating the grade-tonnage relationship. The exact shapes of the high-grade stopes will have to be determined by mapping and drilling information obtained from underground development crosscuts across the width of the orebody
5. The uncertainty in the UC estimate can be quantified based on the reconciliation to grade control. Appropriate planned ore loss and dilution factors can be computed using this reconciliation and applied appropriately in the mine planning process. An alternative to this approach would be to conduct a simulation study and quantify the uncertainty.
Conclusions
The geological nature of the orebody at Geita is conducive to the usage of uniform conditioning (UC) methods, and historical reconciliations have shown this to be a robust technique to produce recoverable resource models for quantifying published Mineral Resources and for use in both medium- and long-term planning. Planning in the open pit environment implies a free selection of the SMU, while that ii the underground environment implies a fixed selection of the SMU. The spatial positions of high-grade units are important for underground planning, and reconciliation studies for the Nyankanga deposit have shown that a tighter drill spacing will be required to indicate the position of these high-grade units. The accuracy of local predictions of the grades and tonnages within these high-grade wireframes is better if a U model is used rather than a deterministic ordinary kriged model.
The importance of the geological model, understanding o local grade variation, and improved domaining between the banded iron formation (BIF) and microdiorite (MD) units have been highlighted in this paper. This assisted in improving local SMU accuracy to aid in the underground evaluation of stopes.
The highly positive skewed sample distribution present in the Geita orebodies was adequately represented in the UC model, and this ensured that the total orebody potential was captured prior to any financial decisions to start new and capital-intensive cutbacks or underground development decline systems. Appropriate underground mine planning modifying factors can be computed from the reconciliation study and used in the Resource conversion process. This potential could have been easily under- or overestimated if linear kriging methods were employed based on the initial wide-spaced exploration data.
Acknowledgements
The contributions of AngloGold Ashanti employees V.A Chamberlain, T. Gell, S. Robins, and A. Sissoko in developing the UC processes and reconciliation methodologies at Geita gold mine are gratefully acknowledged. The validation of SMU for both open pit and underground mining was guided by V.A Chamberlain and S. Robins.
References
Chamberlain, V.A. 2009. Determination of the selective mining unit size for surface mining. Internal guideline report, AngloGold Ashanti. [ Links ]
Chamberlain, V.A. 2008. Senior Vice President, AngloGold Ashanti. Personal communication. [ Links ]
Deraisme, J. 2012. Mining geostatistics - advanced mining geostatistics. Training presentation, Johannesburg, South Africa, October, 2012. [ Links ]
Gaunt, J. 2006. Mineral Resource Statement and Competent Persons Report. Internal report, AngloGold Ashanti. [ Links ]
Harley, M. 2009. Nonlinear estimation. Anglo American Corporate Office. Personal communication [ Links ]
Krige, D.G. 1996. A practical analysis of the effects of spatial structure and data available and accessed, on conditional biases in ordinary kriging. Proceedings of the Fifth International Geostatistical Congress, Geostatistics Wollongong '96. Baafi, E.Y. and Schofield, N.A. (eds.). Springer. pp 799-810. [ Links ]
Neufeld, C. 2005. Uniform conditioning. Centre for Computational Geostatistics, University of Alberta. [ Links ]
POISSON, J. 2008. Isatis advanced training. Training presentation, Johannesburg, South Africa, June 2008. [ Links ]
Rees, C. 2013. Nyankanga underground exploration drive business case report. Internal report, AngloGold Ashanti. [ Links ]
RIVOIRARD, J. 1994. Introduction to Disjunctive Kriging and Nonlinear Geostatistics. Clarendon Press, Oxford. [ Links ]
ROBINS, S. 2010. Geology Manager, Geita gold mine. Personal communication. [ Links ]
Vann, J., Jackson, S., and Bertolli, O. 2003. Quantitative kriging neighbourhood analysis for the mining geologist - A description of the method with worked case examples. Proceedings of the 5th International Mining Geology Conference, Bendigo, Vic., 17-19 November 2003. Australasian Institute of Mining and Metallurgy, Carlton, Vic. [ Links ]
Vann, J., Guibal, D., and Harley, M. 2000. Multiple indicator kriging - is it suited to my deposit? Proceedings of the 4th International Mining Geology Conference, Coolum, Qld., 14-17 May 2000. Australasian Institute of Mining and Metallurgy, Carlton, Vic. [ Links ]
Vann, J. and Guibal, D. 1998. A review of non-linear estimation. Proceedings of Beyond Ordinary Kriging: Non-Linear Geostatistical Methods in Practice, Perth, 30 October 1998. Geostatistical Association of Australasia. [ Links ]
This paper was first presented at, The Danie Krige Geostatistical Conference 2015, 19-20 August 2015, Crown Plaza, Rosebank.

