


Services on Demand
Article
 English (pdf)
 Article in xml format
 Article references
Indicators

Related links
-
 Cited by Google
 -
 Similars in Google
Share

 Permalink
Journal of the Southern African Institute of Mining and Metallurgy
On-line version ISSN 2411-9717
Print version ISSN 2225-6253
J. S. Afr. Inst. Min. Metall. vol.116 n.6 Johannesburg Jun. 2016
http://dx.doi.org/10.17159/2411-9717/2016/v116n6a9
PAPERS - COOPER COBALT AFRICA CONFERENCE
Ivanhoe Mines' giant Kamoa copper discovery in the DRC - a metallurgical perspective
V.L. Nkuna; T. Naidoo; S.R. Amos
Ivanhoe Mines, Johannesburg, South Africa
SYNOPSIS
Ivanhoe Mines' Kamoa copper project is a recently discovered high-grade copper sulphide deposit in the Katanga Province of the Democratic Republic of Congo. The mineralization identified to date within the resource is typical of sedimentary-hosted stratiform copper deposits and comprises three distinct units: supergene, mixed, and hypogene mineralization. Since 2010, various metallurgical test work campaigns have been conducted on drill core from different areas within the deposit in line with resource expansion. The most recent bench-scale flotation test work has shown positive repeatable results. The work was conducted on a composite sample of drill core from the southern part of the Kamoa resource. The sample is representative of the first four to five years of planned production, when Ivanhoe Mines intends to produce clean, high-grade copper flotation concentrate. A detailed test work roadmap developed from first principles for the campaign led to an optimum flow sheet for treating the Kamoa mineralization. Copper recoveries of 88.3%, at a concentrate grade of 39.0% copper, were achieved using a composite sample - an improvement on the previously published 85.9% life-of-mine average copper recovery indicated in the November 2013 Kamoa Preliminary Economic Assessment.
Keywords: Kamoa copper project, copper, sulphide, mineralogy, mill-float, hypogene, supergene, circuit development, integrated flow sheet, copper recovery, fine grained, bornite, chalcopyrite, chalcocite
Introduction
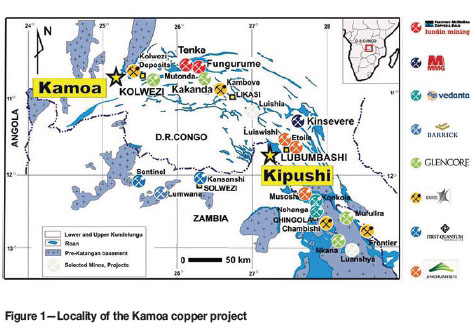
The Kamoa project is a newly discovered, very large, stratiform copper deposit with adjacent prospective exploration areas within the Central African Copperbelt, approximately 25 km west of the town of Kolwezi in the Democratic Republic of the Congo (DRC) and about 270 kilometres west of the provincial capital of Lubumbashi. Ivanhoe Mines holds its 95% interest in the Kamoa copper project through a subsidiary company, Kamoa Copper SA Limited SPRL, and DRC government owns 5%. The project location is indicated in Figure 1.
In January 2013, a new independent mineral resource estimate ranked Kamoa as Africa's largest high-grade copper discovery and the world's largest undeveloped high-grade copper discovery. At this time, Ivanhoe Mines had estimated discovered Indicated Mineral Resources of 739 Mt grading 2.67% copper, containing 43.5 billion pounds of copper, and Inferred Mineral Resources of 227 Mt grading 1.96% copper, containing 9.8 billion pounds of copper, as demonstrated in the Preliminary Economic Assessment (PEA) (AMC, 2013). A 1% copper cut-off grade and a minimum vertical mining thickness of 3 m were applied in each classification.
The project execution is planned in two phases, the first phase being a 3 Mt/a mine and concentrator producing approximately 100 000 t/a copper in concentrate for sale, while the second includes a mine and concentrator expansion and the construction of a smelter producing approximately 300 000 t/a of blister copper.
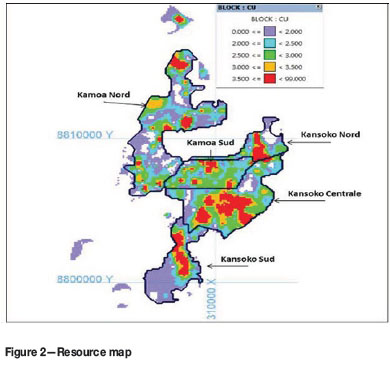
A series of metallurgical test work campaigns (comminution and flotation) on the Kamoa mineralization has been carried out since 2010 using drill cores from different areas within the deposit in line with the resource development and expansion. Figure 2 represents a grade-thickness map of the Kamoa resource with the underground mining areas included; grade-thickness refers to copper grade in per cent multiplied by the thickness of the mineralization in metres.
The Kamoa deposit differs from other copper deposits in the DRC as it is predominately a copper sulphide deposit with negligible cobalt and copper oxide mineralization. The copper sulphide mineralization consists predominantly of bornite (Cu5FeS4), chalcopyrite (CuFeS2), and chalcocite (Cu2S). The copper minerals are fine-grained with average grain sizes ranging from 6 μm to 14 μηι. The flow sheet development incorporates finer than normal primary grind targets and extensive re-grinding in order to sufficiently liberate the copper sulphide minerals and achieve acceptable copper recoveries and concentrate grades. The flow sheet development, based on first principles, resulted in a mill-float (MF1) circuit which yielded positive results, with copper recoveries of 88.3% at a concentrate grade of 39.0% copper. The concentrate produced is generally low-energy with Fe/SiO2 ratios in the region of 1.1 and is suitable for processing using the Outotec Direct to Blister technology or blending with higher Fe/SiO2 concentrates. The concentrate contains very low arsenic levels of around 0.01%, which makes it suitable for toll smelting.
Metallurgical test work background
A total of six test work phases have been completed to date on mineralized material from the Kamoa deposit. All test work was conducted at the Mintek laboratory in Johannesburg and the Xstrata Process Support (XPS) Laboratory in Sudbury, Ontario.
The previously developed mill-float mill-float (MF2) circuit achieved good performance, as reported in Table I. The circuit was developed to partially liberate the coarse copper sulphide minerals at 80% passing 75 μm and subject the material to primary rougher flotation. The primary rougher tailings were milled in a secondary ball mill to a finer grind of 80% passing 38 μπι. The secondary mill product was then floated in the secondary rougher flotation. Further regrinding of primary and secondary rougher concentrate to 15 and 10 μηι, respectively was required to liberate copper-bearing minerals to achieve the desired copper concentrate grade. This circuit, known as the 'Frozen Flowsheet', became the benchmark and was published in the 2013 PEA.
Phase 6 circuit development
With the development of the mine production schedule published in the November 2013 PEA, high-grade, shallow copper areas that had been discovered further south in the resource were targeted for early production. A sampling campaign was carried out in line with the new developments to include the high-grade Kansoko Sud and Kamoa Centrale areas, which represent the initial mining areas.
The test work was separated into two phases.
Phase 6A - A master composite sample (23% supergene and 77% hypogene) and reference supergene and hypogene representing the first four years of mining and two preproduction years was tested. Kansoko Sud and Kansoko Centrale are predominantly mined during this time. This phase of the project assumes the sale of copper concentrate to a third-party smelter and represents the project payback period
Phase 6B - This composite sample represents years 5 to 15 of mining and involves owner-smelting. Kansoko Centrale. Kamoa Sud. and Kansoko Sud are predominantly mined during this time. Reference supergene and hypogene samples were also composited from these areas.
Material from the different areas could potentially be metallurgically different and it is thus important to characterize and test both composite samples. The majority of this paper is assigned to the flow sheet development associated with the Phase 6 sample.
Flotation test work sample selection and composition
Intersections from 16 drill core wedges (8 for Phase 6A and 8 for Phase 6B) were selected and sent to XPS for the Phase 6 test work programme. Samples were selected incorporating the following criteria:
The average copper head grade from the mine schedule
The average ratio of hypogene to supergene
The required mining cut
Spatial considerations to cover specific mining zones
The average mass ratio from the various mining areas.
Feed mineralogy
Mineralogical investigations were conducted on the Phase 6A and 6B composite samples, together with their respective hypogene and supergene reference composite samples. Test charges of 2 kg were milled to a product P80 size of 212 μm and prepared for mineralogical investigations, i.e. bulk mineralogy, copper deportment and association, as well as in situ grain size.
The Phase 6A and 6B composite bulk mineralogy was found to be similar to previous metallurgical samples from Phases 2, 3, and 5, with feldspar, mica, quartz, and chlorite being the dominant gangue minerals.
The copper deportment analysis indicated that the major copper minerals present in the Phase 6A master composite were bornite (38%), chalcopyrite (29%), and chalcocite (20%), with minor amounts of covellite (6%) and copper oxides with some native copper (3%). For the Phase 6B composite, the major copper minerals were chalcopyrite (41%), bornite (38%), and chalcocite (16%), with minor amounts of covellite (0.8%) and copper oxides with some native copper (0.6%).
In situ grain size distributions were measured at a feed grind size P80 of 212 μm and indicate a combined copper sulphide P80 of approximately 50 μm for both the 6A and 6B master composites. Chalcopyrite tends to be coarser grained, while bornite and chalcocite are finer grained.
MF1 versus MF2 circuit
Two sets of MF2 flotation tests using the Phase 6A sample with grinds set at 75/38 μm and 106/38 μm, respectively, were performed and results compared to the MF1 rougher kinetic test with the primary grind set at 38 μm (Figure 3).
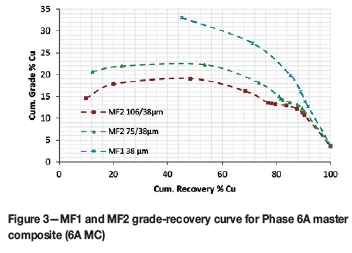
The MF1 test resulted in superior performance compared with the MF2 tests for both copper recovery and grade, at a lower mass pull. The MF1 circuit was thus carried through to the cleaner circuit development, with no further development of the MF2 circuit.
Rougher kinetics on Phase 6 composites
Rougher rate tests were performed on the Phase 6A master composite at various primary P80 grind sizes; viz., 150, 106, 75, 53, and 38 μm at up to 40 minutes' rougher flotation time. The results are summarized in Figure 4.
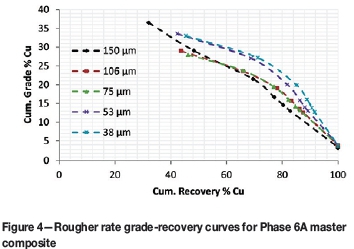
There is a clear benefit in grinding finer with respect to the grade and recovery of the rougher concentrate. Overall recoveries from the MF1 platform ranged from 82.9% for the 150 μm grind to 92.7% for the 38 μm grind.
On the basis of the MF1 results, the 38 and 53 μm tests were selected for further development. The concentrate and tailings samples were analysed using Quantitative Evaluation of Minerals by Scanning Electron Microscopy (QEMSCAN) to inform the cleaner circuit development. Rougher kinetics tests were also performed on the 6B composite, which similarly indicated a clear benefit in grinding finer with respect to the copper grade and recovery to rougher concentrate.
Rougher concentrate and tailings mineralogy
Mineralogical test work was performed on timed rougher concentrates (five samples taken at different intervals) and tailings from the Phase 6A master composite (38 and 53 μm grinds) and also the Phase 6B master composite (38 μm grind) to determine copper mineral liberation, grain size, and silica association.
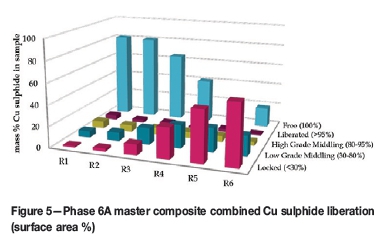
The liberation distribution of copper sulphides with respect to total copper sulphides in the feed indicated that, regardless of primary grind for both composites, almost all liberated material had floated after approximately 10 minutes (R1 to R3 in Figure 6). The implication of this is that a portion of this rougher concentrate could report directly to final concentrate and achieve saleable concentrate grades.
This is referred to as the 'high-grade flash cleaner circuit'.
Mineralogy results (XPS, 2014a) demonstrated that from approximately 10 minutes onwards, there is a switch from liberated sulphide flotation to middlings sulphide flotation (R4 to R6 in Figure 5). These concentrates require fine re-grinding to liberate the copper sulphides and reduce gangue, mainly silica, content in final concentrate.
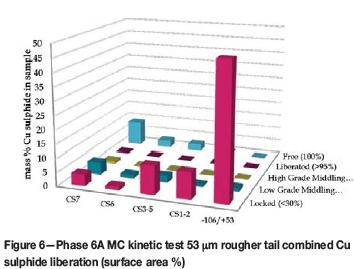
The rougher tailings mineralogy for the different primary grind tests consistently indicates that locked copper sulphides are present in the coarse size fraction, as shown in Figure 6. This highlighted an opportunity in that the rougher tailings could be scalped/screened and the coarse fraction re-ground and re-floated.
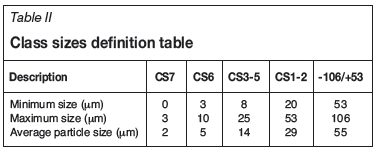
The class sizes used in Figure 6 are illustrated in Table II.
Cleaner circuit development
Based on mineralogical results from the Phase 6A timed rougher concentrates and tailings, cleaner circuit development was carried out on both the 53 μm and 38 μm grinds in the three areas detailed below:
High-grade flash cleaners. This section upgrades the fast-floating high-grade rougher concentrate collected during the first few minutes of rougher flotation into saleable concentrate and bypasses the concentrate re-grind circuit. A 5- to 7-minute rougher concentrate was upgraded in two cleaning stages and consistently achieved copper recoveries of between 65% and 75% at copper grades above 36% for both primary grinds (38 and 53 μm)
Medium-grade cleaners. This section treats the subsequent partially liberated middlings rougher concentrate and recycled high-grade cleaner tailings. The circuit consists of a concentrate re-grind to further liberate the copper sulphides locked in gangue minerals to a P80 of between 10 μm and 15 μm prior to a dedicated cleaner flotation circuit to produce increments of saleable concentrate. Cleaner kinetics were also investigated to determine the optimum residence time with minimal gangue recovery
Tailings scalp circuit. The relatively high-grade coarse size fraction of the tailings was treated by scalping and re-grinding prior to flotation. This achieved between 3% and 5% additional copper recovery to saleable concentrate, depending on the primary grind.
The inclusion of the tailings scalping circuit was further investigated and a number of integrated flow sheet configurations were successfully tested for both the 53 μm and 38 μm primary grinds. These flow sheets are discussed below.
Integrated flow sheet 1 (IFS 1)
This circuit configuration is an MF1 platform with a mainstream target grind of 38 μm Milled slurry is subjected to the 40-minute rougher flotation residence time; high-grade (HG), or fast-floating and medium-grade (MG), or slower floating concentrates are collected separately. HG rougher concentrate is upgraded in two HG cleaning stages without further re-grinding to produce a HG increment to final concentrate. The MG rougher concentrate is combined with the HG cleaner tailings and re-ground to a P80 of 15 μ!! before being cleaned in two stages. Rougher tailings are scalped and the oversize (+38 μm) is re-ground to a P80 size of 15 μm, and then scavenged in a 5-minute float to produce a discard tail and a scavenger concentrates. The latter is retreated in the MG re-cleaner bank together with the MG cleaner concentrate.
Integrated Flow sheet 2 (IFS 2)
The IFS 2 is identical to the IFS 1 circuit, with the exception that the MG rougher concentrate and HG cleaner tails are combined with scalped tailings oversize as feed to the re- grind mill.
Integrated Flow sheet 3 (IFS 3)
This circuit is the same as IFS 1, with the exception being that the primary grind is 53 μm.
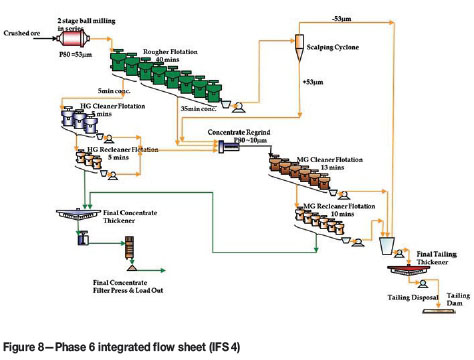
Integrated Flow sheet 4 (IFS 4)
This circuit is the same as IFS 2, with the exception being that the primary grind is 53 μm.
Integrated Flow sheet 5 (IFS 5)
The circuit configuration is an MF1 platform with a mainstream target grind of 53 μm Milled slurry is subjected to the 40-minute rougher flotation residence time; high-grade (HG), or fast-floating and medium-grade (MG), or slower floating concentrates are collected separately. HG rougher concentrate is upgraded in two HG cleaning stages without further re-grinding to produce a HG increment to final concentrate. The MG rougher concentrate is re-ground to a P80 of 10 μm before being cleaned in two stages. Rougher tailings are scalped and the oversize (+53 μm) is combined with the MG rougher concentrate and re-ground to a P80 of 15 μm. It is then cleaned in two stages with the MG rougher concentrate.
The grade-recovery curve comparison for these flow sheets is presented in Figure 7.
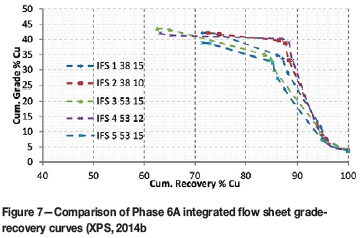
From Figure 7, it is clear that IFS 2 and IFS 4 perform the best. IFS 4 achieved the best results at 88.3% copper recovery and 39% copper concentrate grade. Upon further investigation of the results from IFS 4 and IFS 2, it was determined that the re-grind mill produced a P80 of 12 and 10 μm, respectively, i.e., finer than the target size of 15 μm. This finer grind translates to better liberation, which improved the MG cleaner flotation performance. Based on these results, it was concluded that a target re-grind P80 of 10 μm was required to improve the copper grade for improved transport costs.
A mainstream target grind of 38 μm (IFS 2) was deemed risky compared to a target grind of 53 μm (IFS 4). An alternative technology to ball milling is required to achieve the finer grind, viz., tower mills. Thus, IFS 4 in Figure 8 was selected as the preferred circuit as it was deemed a lower risk circuit and produced marginally better performance than IFS 2.
Further tests were conducted with the IFS 4 flow sheet with a target grind of 10 μm, which provided similar results, indicating that the results are repeatable.
Baseline flotation test (Phase 2 'Frozen Flowsheet')
Phase 6A development master composite was tested with the published PEA MF2 'Frozen Flowsheet'. The result is compared with the Phase 6 integrated IFS 4 circuit in Figure 9.
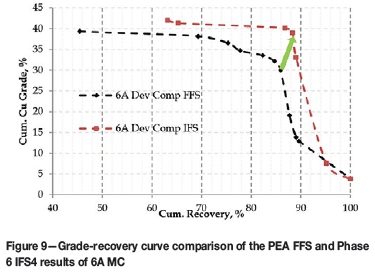
The 6A development composite achieved 88.3% copper recovery at a concentrate grade of 39.0% copper using the integrated Phase 6 flow sheet, an improvement from 85.9% copper recovery and 30.0% copper grade from the 'Frozen Flowsheet'. The 6B development composite (not shown) achieved 92.3% copper recovery at a concentrate grade of 37.0% copper through the integrated Phase 6 flow sheet, an improvement from 89.7% copper recovery and 27.5% Cu concentrate grade through the 'Frozen Flowsheet'. The Phase 6 integrated circuit, IFS 4, achieved superior results for both composites compared with the 'Frozen Flowsheet' circuit.
Preliminary variability
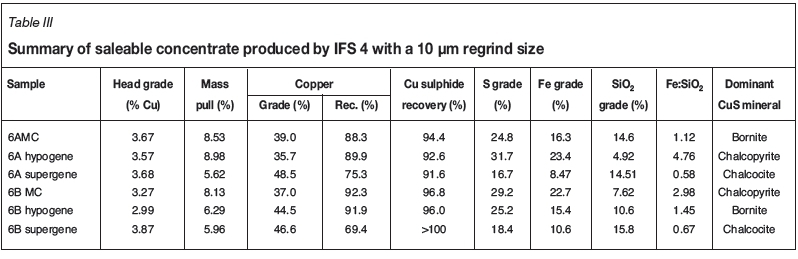
Preliminary variability flotation tests on the Phase 6 hypogene and supergene composites, representing up to year 15 of the PEA mine production schedule, have been conducted using the Phase 6 'integrated flow sheet', IFS 4 (10 μm target re-grind). The results in Table III indicate that the copper recoveries and concentrate grades are in line with the copper feed mineralogical compositions for each composite.
This illustrates that the IFS 4 (10 μm) flow sheet developed using the 6A master composite is suitable for treating the various composites up to year 15 of the PEA mine production schedule. Possibly, blending of supergene and hypogene may be required to achieve a concentrate specification for offtake agreements.
Conclusions
A viable circuit has been developed for the Kamoa resource to successfully treat composites representing different project phases (payback period and up to 15 years of mine life) and the different mineralization; i.e., hypogene and supergene composites. The IFS 4 circuit developed with 6A master composite has proven suitable for treating the various composites and individual geometallurgical units. The Kamoa copper minerals are finely grained, hence the flow sheet development incorporated finer than typical primary grinding to a mainstream product size P80 of 53 μm and intensive re-grinding to a target size P80 of 10 μm to sufficiently liberate the copper sulphide minerals and achieve optimal copper recoveries and concentrate grade. The integration of the coarse copper-containing tailings fraction provided an additional recovery benefit of 3 to 5% Cu.
Acknowledgements
The authors would like to thank the senior management at Ivanhoe Mines for permission to publish this work. We sincerely thank Dr N.O. Lotter and the team at Xstrata Process Support for the diligent work and input throughout the test work campaigns. We also thank Mintek's team for the contribution to the comminution and flotation test work. Their efforts, interpretations, and input are highly appreciated.
References
AMC Consultants Pty Ltd. 2013. Kamoa Preliminary Economic Assessment. [ Links ]
XPS. 2014a. Rougher kinetic flotation tests: Phase 6A1 development composite. Internal report from XPS to Ivanhoe Mines, 15 May 2014. [ Links ]
XPS. 2014b. Kamoa Phase 6 flow sheet development composite. Internal report from XPS to Ivanhoe Mines, 14 November 2014. [ Links ] ♦
This paper was first presented at the, Copper Cobalt Africa Conference, 6-8 July 2015, Avani Victoria Falls Hotel, Victoria Falls, Livingstone, Zambia.

