


Services on Demand
Article
 English (pdf)
 Article in xml format
 Article references
Indicators

Related links
-
 Cited by Google
 -
 Similars in Google
Share

 Permalink
Journal of the Southern African Institute of Mining and Metallurgy
On-line version ISSN 2411-9717
Print version ISSN 2225-6253
J. S. Afr. Inst. Min. Metall. vol.116 n.5 Johannesburg May. 2016
http://dx.doi.org/10.17159/2411-9717/2016/v116n5a6
PAPERS - SLOPE STABILITY CONFERENCE
Reconciliation of the mining value chain - mine to design as a critical enabler for optimal and safe extraction of the mineral reserve
M. Bester; T. Russell; J. van Heerden; R. Carey
Anglo American Kumba Iron Ore, South Africa
SYNOPSIS
In order to reach the goal of optimal and safe extraction of the mineral reserve, the mining industry is increasingly focusing on reconciliation across the mining value chain to ensure that the mining process occurs in a progressively more predictable manner. This will consequently improve the understanding of mine plans and their associated implementation risks, ultimately leading to increased investor confidence. In terms of geotechnical engineering, mine to design performance assessment is a critical aspect of mine to plan adherence focusing on the complex aspects influencing slope performance. A mine to design reconciliation process therefore needs to systematically track implementation and geotechnical aspects in order to review or update slope design criteria and pit layouts according to the mine planning cycle as the mine is developed. This paper describes the development and implementation of a standardized mine to design reconciliation system for operations utilizing laser scanning technology, analysis tools, as well as associated key performance indicators. Performance is evaluated on final pit boundaries in terms of geometry achieved as well as blast performance evaluation of face conditions. These aspects as well as the resulting catch berm capacity should be captured in an information system, enabling longer term trend analysis and detailed root cause analysis where unsatisfactory outcomes occur. Adverse outcomes should subsequently be incorporated into the mine's risk management process informing risk mitigation measures including blast design adjustments, slope design changes, or rockfall protection measures.
Keywords: mining value chain, mine to design, reconciliation, slope management
Introduction
In order to reach the goal of optimal and safe extraction of the mineral reserve, the mining industry is increasingly focusing on reconciliation across the mining value chain to ensure that the mining process occurs in a progressively more predictable manner. This will consequently improve the understanding of mine plans and their associated implementation risks, ultimately leading to increased investor confidence. In terms of geotechnical engineering, mine to design performance assessment is a critical aspect of mine to plan adherence focusing on the complex aspects influencing slope performance. A mine to design reconciliation process therefore needs to systematically track implementation and geotechnical aspects in order to review or update slope design criteria and pit layouts according to the mine planning cycle as the mine is developed.
The role of mine to design in mining value chain reconciliation
The mine value chain (MVC)
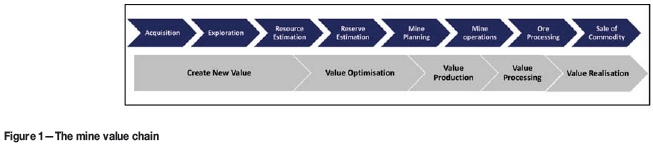
Most mining operations typically follow a similar process, referred to as the mine value chain (MVC). Figure 1 illustrates the MVC graphically, where the top row represents high-level processes along the value chain and the bottom row represents value.
The realization of value generated along the MVC is directly dependent on accurate planning and the controlled execution of all the different processes supporting the value chain.
An approach to MVC reconciliation
An example of a business operating model is the Business Process Framework (BPF), which essentially consists of three phases, namely planning, work management, and feedback. The feedback phase of BPF includes the measurement of performance to support analysis and improvement. It is therefore critical that the correct key performance indicators are identified and tracked to enable accurate analysis of performance and trends. Timely and correct information facilitates solid decision-making leading to optimized performance.
Table I summarizes MVC reconciliation processes in terms of mine planning/design vs execution. Both the mining and waste dumping processes can be reconciled in terms of spatial compliance to design (x, y, and z position) and temporal compliance to design (time period).
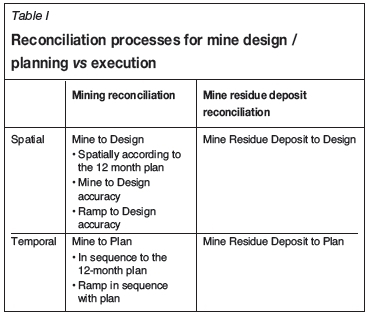
Although the successful implementation of the mine plan is equally dependent on adhering to slope design as well as following the planned mining sequence, the reconciliation of mine to design as a critical aspect of slope management will be discussed further.
Development of a mine to design reconciliation process
Effective mitigation of slope failure and rockfall hazards that typify an open pit mine requires final pit slopes to be mined to design in terms of both bench width and overall design angle. Achieving design slope angles and bench widths has proven to be challenging at times, with several factors contributing to unsatisfactory compliance with the slope design and the development of poor-quality faces on final pit boundaries. In order to improve pit wall control and ultimately mine to design performance, a mine to design reconciliation system should be developed to track the performance of the mining production team on a monthly basis. This system can progressively develop into a proactive reporting tool that will measure mine to design during the mining process.
The reconciliation process discussed in this paper utilizes a laser scanning system to scan final pit boundaries that have been exposed over a given period of time. Subsequently, actual toe/crest line positions are extracted from laser scanning data to carry out a spatial analysis of the actual versus design toe/crest line positions. Maptek I-Site Studio software can automatically perform discrete minimum distance measurements between the design and actual toe/crest line positions along the length of the final pit boundary. Analysis of these individual measurements allows for the percentage of the toe/crest lines falling within distance ranges from design to be calculated. This can be compared with predefined criteria, set as key performance indicators (KPIs) for the final pit boundary compliance with design.
Data acquisition
Data acquisition for the mine to design reconciliation process initially involves the identification of final pit boundaries that have been exposed over the time period in question. Reporting on a monthly basis can be used as a starting point.
Subsequently, a plan should be sent to the survey department indicating which areas need to be scanned for the final pit boundary reconciliation in a given month. A practical consideration to enable accurate analysis is that scanning should be done from a working level that ensures line of sight of the toe and crest positions in question.
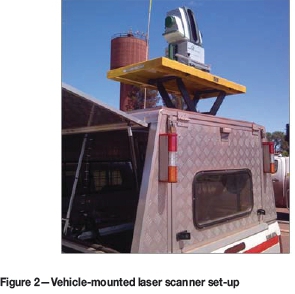
I-Site 8810 laser scanners were used for data acquisition. The scanning unit is vehicle-mounted and is operated from inside the vehicle via a wi-fi connection using a Toughbook tablet device (Figure 2). All scans can be carried out over a horizontal range of between 0 and 360 degrees with a fixed vertical range of 80 degrees. In terms of distance the scanner has ranges of 500 m, 1000 m, and 1400 m for surfaces with low reflectivity (10-40%), medium reflectivity (40-80%), and high reflectivity (>80%) respectively. In practice, scans are usually done within 200 m of the target surface, with several scans from different scanning positions making up the overall scan image for larger areas. Laser scans are taken in conjunction with a high-resolution panoramic photograph that is tied in with the laser scanning data to provide a photographic image overlay in the analysis software.
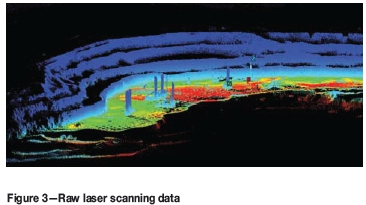
The areas scanned by the mine survey department can then be imported into I-Site Studio software for analysis. An example of raw scan data of a final pit boundary is illustrated in Figure 3. Note that several scan positions are utilized to compile a single composite scan of the highwall. This is necessary for not only georeferencing the scan data, but also to reduce shadows in areas not visible to the scanner at a specific position.
Data analysis
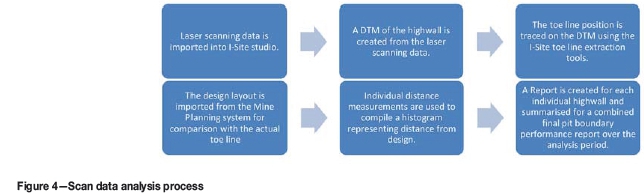
Raw laser scanning data can be processed and analysed following the process outlined in Figure 4.
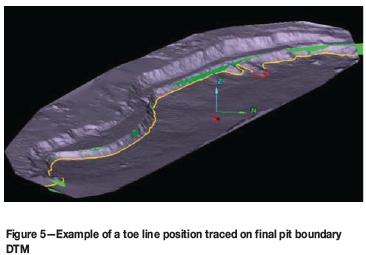
I-Site Studio software utilizes various filtering functions to process the raw scan data to allow for conversion into a digital terrain model. From the digital terrain model the toe line position can be traced using a combination of a visual assessment of the DTM surface and the in-built I-Site Studio toe/crest line assessment functions (Figure 5). Essentially, toe and crest lines can be automatically extracted using the maximum angle of curvature between the horizontal surface of the bench and the slope of the highwall.
For comparison of design to actual toe/crest line positions, the design toe/crest lines need to be imported and overlain on the trace representing the actual toe/crest line. For toe/crest line analysis, final limit block designs from the mine's planning system can be imported into I-Site Studio. Alternatively, the design pit layout can be imported and overlain over the actual toe/crest line positions.
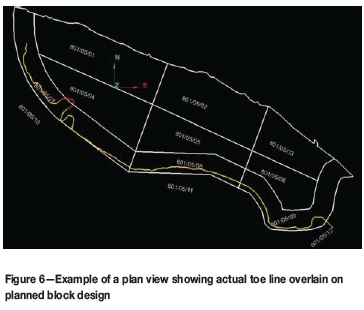
The design versus actual positions can be compared using the 'Colour by Distance from Object' function in I-Site Studio. The function essentially applies a colour scheme to the extent of one surface or line based on the distance from a second 'base' object. In the case of toe line analysis the design toe line represents the base object to the actual toe line. Distance measurements are taken at discrete points along the toe line (0.2 m intervals are currently used as standard) where the absolute distance to the closest point in 3D space to the base object is measured. A colour scheme is set up to colour the actual toe line (or crest line) according to the criteria set to measure mine to design performance. For illustrative purposes, portions of a toe line falling within 3 m of design are indicated in green, portions within 4 m of design are indicated in yellow, and areas falling outside of 4 m are coloured red. Figure 6 illustrates an example of a plan view of the actual achieved pit boundary overlain on short-term planning block designs coloured according to the abovementioned criteria.
The 'Colour By Distance From Object' function in I-Site Studio allows for raw measurement data to be exported as CSV values providing the coordinates and distance measurement at each individual point along the toe line. The exported distance values are then imported into Microsoft Excel, where the following is done for reporting purposes:
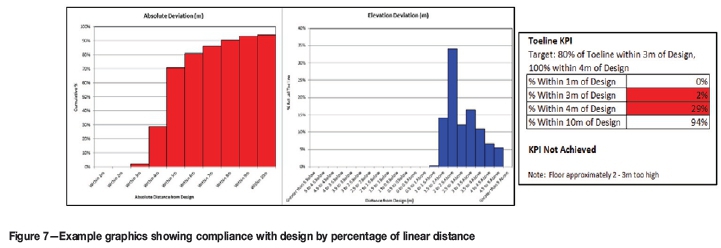
► A cumulative histogram is utilized to represent the distribution of distance measurements between design and actual toe line positions (Figure 7)
► A histogram showing deviation from design elevation is produced by comparing the actual Z-elevation of each analysis point with the design elevation of the level being analysed
► Percentages of the actual toe line falling within each of the predefined limits are calculated and reported.
Following the same process, a crest line analysis can be performed to assess crest positions according to set criteria.
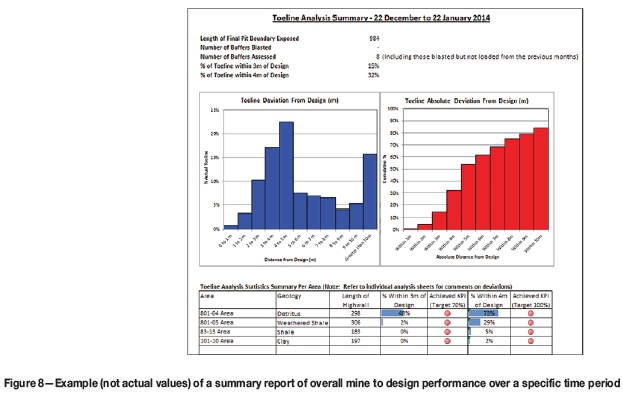
Each section of highwall exposed during the analysis period is assessed separately; however, data can also be combined to run an overall assessment of mine to design performance per area of responsibility or separate pits for the period under assessment. This allows for broader trends in mine to design performance to be assessed over a given period of time (Figure 8). These reporting functions can be automated utilizing current survey software applications.
Key performance indicator (KPIs)
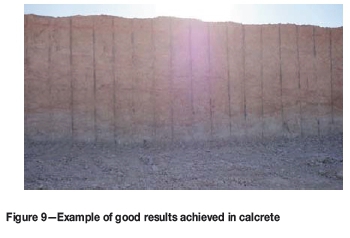
In order to measure performance regarding final pit boundary compliance, it is essential to select KPIs that take into account industry best practice as well as practical considerations. For the purpose of explaining the process and based on acceptable results achieved (refer to Figure 9), final pit boundary compliance was measured according to the percentage of final boundary length toe positions within 3 m of design. The initial target was set at 80%.
Subsequent to implementing a mine to design reconciliation process and allowing a sufficient period of data capture, trend analysis and reporting, KPIs will need to be further developed for each individual mine taking into account practical considerations and area-specific rock mass constraints. This will typically include toe and crest performance per rock mass type as well as actual catch berm capacity.
Final pit boundary performance evaluation
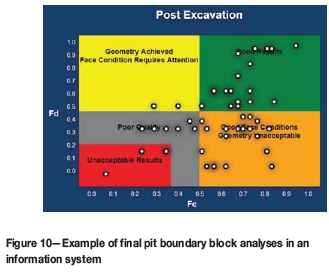
According to Read and Stacey (2009), several systems are available to evaluate bench design achievement. A general matrix system evaluating geometry and face conditions is discussed here.
Evaluation ofgeometry and catch berm capacity
The following weighted components can be evaluated based on actual geometric data obtained from laser scanners and the reporting process described above:
► Bench face angle
► Bench width
► Toe position.
Positive results according to these components ensure slope design is achieved, ultimately leading to the realization of committed value.
Evaluation of face conditions and blast performance
The following weighted components for face conditions can be evaluated by geotechnical engineers on final pit boundaries and are indicative of blast performance:
► Half barrels visible
► Intact rock breakage
► Open joints
► Loose material on face
► Face profile
► Crest conditions.
Good performance in terms of blasting in conjunction with achieving design slope geometry results in effective catch berm capacity, which is critical in successful rockfall risk management.
Data capture in an information system
As discussed earlier, the feedback phase of the Business Process Framework (a business operating model) includes the measurement of performance to support analysis and facilitate improvement. Information management systems play a key role in supporting decision-making in the slope design process through the conversion of data into information, empowering specialists with knowledge to make informed decisions, ultimately enabling improvement. It is therefore critical to implement a fit-for-purpose information system where all related data is stored. All final pit boundary blocks evaluated by geotechnical engineers according to the abovementioned parameters should be captured in a central system or database (Figure 10) that allows for the upload of photographs and any other relevant data per block.
Conclusion
The paper discussed the development of a standardized mine to design reconciliation system utilizing laser scanning technology, analysis tools, as well as associated key performance indicators. Performance is evaluated on final pit boundaries in terms of geometry achieved as well as blast performance evaluation of face conditions. These aspects, as well as the resulting catch berm capacity achieved, should be captured in an information system enabling longer term trend analysis as well as detailed root cause analysis where unsatisfactory outcomes occurred. Adverse outcomes should subsequently be incorporated into the risk management process, informing risk mitigation measures including blast design adjustments, slope design changes, or rockfall protection measures.
Acknowledgement
Our thanks to Anglo American Kumba Iron Ore for the opportunity to present this paper.
References
Dunne, A. and Laurens, P. Not dated. Obstacles in a mining operation and value chain. Department of Geology, University of the Free State. [ Links ]
Maptek (Pty) Ltd. 2013. Maptek I-Site 8810 Operator Manual. [ Links ]
Read, J, and Stacey, P. 2009. Guidelines for Open Pit Slope Design. CSIRO, Clayton, Victoria, Australia. 313 pp. [ Links ]
Van Heerden, J. 2014. Kumba Iron Ore technical requirement document for value chain reconciliation. Anglo American Corporation, South Africa. [ Links ]
Vorster, A. 2001. Planning for value in the mining value chain. Journal of the South African Institute ofMining and Metallurgy, vol. 100, no. 9. pp. 61-65. [ Links ]
© The Southern African Institute of Mining and Metallurgy, 2016. ISSN 2225-6253./
This paper was first presented at the, International Symposium on Slope Stability in Open Pit Mining and Civil Engineering 2015, 12-14 October 2015, Cape Town Convention Centre, Cape Town.

