


Services on Demand
Article
 English (pdf)
 Article in xml format
 Article references
Indicators

Related links
-
 Cited by Google
 -
 Similars in Google
Share

 Permalink
Journal of the Southern African Institute of Mining and Metallurgy
On-line version ISSN 2411-9717
Print version ISSN 2225-6253
J. S. Afr. Inst. Min. Metall. vol.116 n.5 Johannesburg May. 2016
http://dx.doi.org/10.17159/2411-9717/2016/v116n5a5
PAPERS - SLOPE STABILITY CONFERENCE
A comparison of slope stability analyses in two and three dimensions
D. Wines
Itasca Australia Pty Ltd
SYNOPSIS
Slope stability analyses have traditionally been undertaken in two dimensions assuming plane strain conditions. Although three-dimensional analysis techniques are widely available and used routinely for open pits, two-dimensional analyses are still more common due to the relative ease of model construction and the relatively rapid simulation times.
Two-dimensional analyses will often produce different results to three-dimensional analyses for the same slope. It is generally thought that two-dimensional analyses will produce more conservative results. The main reason for the differences is the ability of three-dimensional analyses to account for the three-dimensional nature of the various model inputs, including the slope geometry, the distribution of soil and rock mass domains, the orientation of geological structures with respect to the excavation face, the orientation of the in situ stresses, and the distribution of pore pressure. In some cases, for a long, straight slope in basic geological conditions, two-dimensional analyses can provide a reasonable representation of the problem. However, in many cases, the inability of a two-dimensional analysis to represent the true three-dimensional nature of the problem will lead to unrealistic analysis results.
This paper discusses the reasons, as detailed above, for the differences in two-dimensional and three-dimensional analysis results. Work by others is summarized, and additional numerical analyses are performed to provide an improved understanding of the effects of slope geometry, structural orientations, and in situ stresses on predicted stability. Case studies are presented for both stable and unstable slopes, and the behaviour of these slopes is related to the three-dimensional nature of the slope geometry and geology.
The previous work, the new analyses performed here, and the case studies show that it is often important to provide a realistic representation of the slope in three dimensions in order to obtain reasonable stability analysis results. This is particularly true for hard rock environments where structurally controlled failure mechanisms are most likely. The paper also highlights the fact that back-analysed properties obtained from one analysis technique are not necessarily applicable to forward analyses using another technique.
Keywords: slope stability, numerical modelling, two-dimensional, three-dimensional
Introduction
Various methods exist to analyse the stability of natural and man-made slopes. These include limit equilibrium techniques and numerical techniques such as the finite difference and finite element methods. Both two-dimensional (2D) and three-dimensional (3D) approaches can be used when performing limit equilibrium or numerical slope stability analyses. Where 2D numerical analyses are undertaken, plane strain analyses are generally performed, whereby strains can occur only along the analysis plane (i.e. out-of-plane strains are not considered). Axisymmetric analyses can also be performed, whereby it is assumed that the excavation is rotationally symmetric about an axis. This allows some representation of a 3D geometry in a 2D analysis.
In the early 1980s, in the 3rd edition of their book Rock Slope Engineering, Hoek and Bray (1981) stated that all methods of stability analysis treated slopes two-dimensionally, whereby it is assumed that the section of slope under consideration is part of an infinitely long straight slope. 2D analysis techniques are still widely used today due to the relative ease of model construction and the relatively fast model run times.
Lorig and Varona (2007) state that 3D analyses were uncommon prior to 2003; only by 2007 had advances in personal computers allowed 3D analyses to be performed routinely. Further advances in computing and software packages since that time have significantly improved our ability to construct and run 3D models for slope stability analyses. In many cases, the time and effort required to construct and run a 3D model may be less than that required to construct and run several 2D models for the same slope.
Different analysis methods will often produce different results for the same slope. For example, a limit equilibrium analysis may produce a different result to a numerical analysis. Furthermore, a 2D analysis will often produce different results to a 3D analysis. For example, Gitirana et al. (2008) performed both 2D and 3D back-analyses for the Lodalen Landslide in Oslo using limit equilibrium techniques, and the results were found to be different. It is often stated in the literature that 2D analyses are more conservative than 3D analyses (Cheng et al., 2005; Nian et al., 2012; Leong and Rahardjo, 2012). However, based on analyses of landslides in soils, Bromhead (2004) states that 3D analyses can sometimes produce lower safety factors compared to 2D analyses.
Huang and Tsai (2000) and Cala (2007) state that 2D slope stability analysis often leads to oversimplification of the problem. Nian et al. (2012) claim that 2D analysis may lead to incorrect evaluation of the potential failure mechanism. Zettler et al. (1999) state that, in many cases, a 3D problem cannot be solved with a 2D analysis. According to Lutton (1970), 3D representation is required to undertake adequate analysis of a slope.
The main reason for the differences in the results of 2D and 3D analyses is the ability of 3D analysis to provide an accurate representation of the problem, which will always be 3D in reality. In particular, a 3D analysis can accurately represent:
► The 3D slope geometry, which may be concave or convex in plan. This curvature can have a significant influence on stability (Lutton, 1970; Piteau and Jennings, 1970; Hoek and Bray; 1981; Hoek et al., 2000; Bromhead, 2004; Cala, 2007; Lorig and Varona, 2007; Azocar and Hazzard, 2015)
► The 3D distribution of soil and rock mass domains (Zettler et al., 1999; Bromhead 2004; Cala, 2007; Lorig and Varona, 2007; Wei et al., 2009)
► The 3D orientation of geological structures with respect to the orientation of the excavation face (Lorig and Varona, 2007; Azocar and Hazzard, 2015). Lorig and Varona (2007) recommend that if the direction of the principal geological structures or material anisotropy does not strike within 20-30° of the strike of the slope, 3D analysis is required
► The in situ stress magnitude and orientation (Lorig and Varona, 2007; Azocar and Hazzard, 2015)
► The distribution of pore pressure (Bromhead, 2004).
It is often not possible to provide a reasonable representation of these items in a 2D model.
The main factors affecting the results of 2D and 3D analyses are discussed in more detail below. Work by others is summarized, and additional numerical analyses are performed to provide an improved understanding of the effects of concave and convex geometries and in situ stresses on predicted stability. Case studies are also presented.
This paper is applicable to man-made and natural slopes excavated in soil and/or rock. However, particular emphasis is placed on open pit slope stability in a hard rock environment.
Slope geometry
As discussed, performing 2D plane strain analysis requires the assumption that the slope is long and straight. However this is often not the case for actual slopes, which may be either concave or convex in plan. Open pits will always include concave slope geometries. In a long and narrow pit, the walls at each end of the pit will be concave. In a circular pit, essentially all walls will be concave. Convex geometries will also exist in natural slopes and open pits. 'Bullnose' geometries are often created in pits due to reasons such as complex orebody distribution, the existence of ramp switchbacks, and the difficulties associated with smoothly transitioning a new cutback into existing walls.
The effects of concave and convex slope geometries on slope stability are discussed separately below.
Concave slopes
Previous analyses
A review of the literature indicates general acceptance that a slope that is concave in plan will be more stable than a straight slope (assuming the same geology, stresses, etc.). Hoek and Bray (1981) state that the restraint provided by the material on either side of a potential failure will be greater if the slope is concave. Piteau and Jennings (1970) studied the influence of plan curvature on slope stability at five large diamond mines in South Africa. They state that steeper slopes could be created in concave walls when the radius of curvature was smaller. Armstrong and Stacey (2003) state that for a hard rock environment, the radius of curvature influences the maximum volume of wedges that can fail.
Several researchers have assessed the influence of curvature on slope stability. Lorig and Varona (2007) performed axisymmetric analyses using FLAC (Itasca, 2001) to assess the effects of slope curvature on the factor of safety (FoS) for a 500 m high dry slope with a face angle of 45° excavated in an isotropic homogenous material. The safety factors obtained from these analyses were greater for a concave slope than for a straight slope, and the FoS increased as the radius of curvature decreased. These results are intuitive, and are consistent with the theory that a concave geometry will provide additional lateral support.
The analyses performed by Lorig and Varona (2007) were for a circular-type failure in a homogenous material. Azocar and Hazzard (2015) also performed a series of analyses to assess the effects of curvature on rock slope stability; however, their main focus was on the effects of concave slope geometry on the stability of a jointed rock mass. Their initial analyses, which assumed no explicit jointing, produced results very similar to those reported by Lorig and Varona (2007). That is, the FoS increases with decreasing radius of curvature, and the effect of curvature decreases as the friction angle increases. The jointed rock slope analyses were performed using 3DEC (Itasca, 2014), which allows explicit representation of a large number of joints. Analyses were performed for sliding, flexural toppling, and block toppling failure mechanisms, and as for the homogenous analyses, the FoS increased as the radius of curvature decreased for all three failure mechanisms. Also, the rate of change in FoS was highest for larger radius of curvature values, and tapered off as the radius became smaller.
Several others have performed limit equilibrium and/or numerical analyses to assess the effect of concave geometry on soil slope stability (Xing, 1988; Zettler et al., 1999; Jiang et al., 2003; Suarez and Gonzalez, 2003; Cheng et al., 2005; Cala, 2007; Totonchi et al., 2012; Zhang et al., 2013). In all cases, the analyses indicated that a concave slope will be more stable than a straight slope.
Some limited work has also been performed to assess the influence of in situ stresses on the effects of concave slope curvature. For their base case analyses, Azocar and Hazzard (2015) assumed that the in situ stress was lithostatic with a k value of unity. One additional model was run with a k value of 0.5, and this produced a lower FoS compared to the model with a k value of unity. Based on axisymmetric limit equilibrium analyses, Xing (1988) concludes that the effect of plan curvature on stability increases as the lateral pressure coefficient increases. These results indicate that the effect of slope curvature may differ depending on the in situ stresses.
Additional analyses
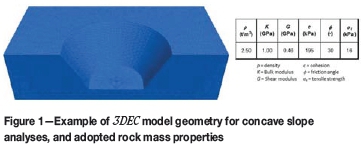
Additional analyses for concave slopes were performed for this paper using 3DEC based on a 60 m high slope with a 60° overall slope angle. An example model is shown in Figure 1. The analyses were performed for various radii of curvature, with the radius being measured at the toe of the pit. The slope was assumed to be made up of an isotropic, homogenous, and dry rock mass with the properties shown in Figure 1. The rock mass was represented using a linear elastic-perfectly plastic Mohr-Coulomb constitutive model with tensile strength cut-off. To assess the potential effects of in situ stresses on the influence of slope curvature, analyses were performed with horizontal to vertical pre-mining stress ratios of 0.5:1, 1:1, and 3:1. The safety factors for each analysis were determined using 3DEC's built-in FoS calculation capability, which is based on the shear strength reduction technique described by Dawson et al. (1999).
The results of the 3DEC analyses for concave slopes are presented in Figure 2. To be consistent with previous work by others, the results are presented on a chart showing the relation between the normalized FoS (the FoS for a concave slope divided by the FoS for a plane strain analysis) and the ratio of slope height to radius of curvature. Therefore the actual FoS values are not shown. This is to avoid the results being used directly by practitioners for slope design. The results are unique to the assumptions made for these particular analyses, therefore it is considered unwise to use the results to develop 'rules of thumb' for actual curved slopes.
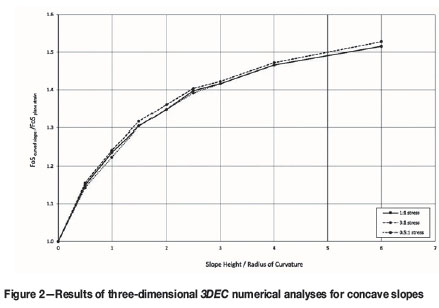
The following comments are based on these analysis results:
► In general, the results are consistent with previous work. There is a clear increase in the calculated FoS as the radius of curvature decreases. The rate of change in FoS is highest for larger radius of curvature values
► The adopted in situ stresses are seen to have some effect on the analyses results. The FoS is generally slightly higher as the horizontal in situ stress is increased. The increased horizontal stress may increase the confining effects provided by a concave slope. Despite this conclusion, the adopted stresses do not have a significant effect on the resulting safety factors. For these analyses, the difference between the safety factors produced by the analyses with different in situ stresses (with all other inputs the same) is always less than 0.05
► As discussed, the analysis results were normalized for presentation in Figure 2 to avoid the results being used directly by practitioners for slope design. To provide some idea of the change in FoS caused by the change in plan curvature, for these particular analyses, it is noted that the FoS increased by approximately 0.4 when comparing a straight slope to a concave slope with a radius of curvature of 60 m.
The analysis results shown here and the findings of others in relation to concave slopes are intuitive. It makes sense that the confinement provided by a concave slope will provide an increase in stability. As an extreme example, in a hard rock environment, vertical boreholes can be drilled several hundred metres deep without significant stability issues in the borehole walls. This is due to the confinement associated with the small area of the opening. If a vertical open pit wall were to be excavated in the same material to the same depth, instability is clearly more likely due to the relative lack of confinement.
Convex slopes
Previous analyses
The axisymmetric analyses presented by Lorig and Varona (2007) also included analyses for convex slopes. The safety factors for convex slopes were higher than those for a straight slope. This is consistent with Cala (2007), who performed numerical analyses for a soil slope and predicted higher safety factors for a convex slope. Both Lorig and Varona (2007) and Cala (2007) found that, for a given radius, the effect of curvature is greater for a concave slope compared to a convex slope. Jiang et al. (2003) performed limit equilibrium analyses for soil slopes, and also found that a convex slope produced a higher FoS than a straight slope. Gomez et al. (2002) performed 2D, axisymmetric, and 3D numerical analyses for waste dumps at Chuquicamata mine in Chile. The axisymmetric and 3D analyses assumed a convex waste dump geometry, and these analyses produced higher safety factors than those produced by the 2D plane strain analyses.
Not all analysis findings reported in the literature are consistent with those discussed above. Based on the results of numerical analyses for soil slopes, Zettler et al. (1999) found that the FoS for a convex slope was slightly less than for a straight slope. Limit equilibrium analyses performed by Cheng et al. (2005) for a soil slope also produced lower safety factors for the convex case compared to a straight slope. Cala (2007) suggests that these results are misleading.
Anecdotal evidence suggests that convex slopes may be less stable than straight or concave slopes, particularly in a hard rock environment. Hoek and Bray (1981) state that the restraint provided by the material on either side of a potential failure will be less if the failure is situated in a 'nose' which has freedom to expand laterally. They discuss the slopes at an open pit in Tasmania, and state that two convex noses showed serious signs of instability, while the remaining slopes, which were straight or concave, were stable. Hoek et al. (2000) state that rock 'noses', or slopes that are convex in plan, are less stable than concave slopes due to the lack of confinement in convex slopes and the beneficial effects of confinement in concave slopes. Narendranathan et al. (2013) state that convex profiles or 'bullnoses' are notorious for initiating planar/wedge-type sliding instabilities. They discuss some failures in a pit in the Pilbara region of Western Australia where anisotropic rock masses are encountered. They state that, in the majority of cases, instabilities were noted to initiate on slightly convex profiles, and it was noted that the lateral extents of the instabilities were sometimes defined by the change in concavity of the slope. Kayesa (2006) discusses a multi-bench failure at the Letlhakane mine in Botswana, which occurred in a convex bullnose geometry located at the boundary between two mining areas.
The majority of analyses detailed in the literature indicate that a convex slope will be more stable than a straight slope. These results may seem counter-intuitive, given the information provided in the paragraph immediately above. For their waste dump analyses, Gomez et al. (2002) suggest that the increased FoS with reducing radius of curvature can be explained by a reduced volume of material being available to be mobilized as the radius decreases. They note that the depth of the failure surface determined in all analyses was similar; however, a slope with a finite radius provides less material than the equivalent infinite (plane strain) slope.
Lorig and Varona (2007) state that their results for convex slopes are not consistent with observed experience in rock slopes. They note that the analyses assume that the slope is formed in isotropic homogenous material, and the reason that noses are often less stable in reality may be related to the fact that they are more exposed to structurally-controlled failure mechanisms. Structures were not explicitly defined in their analyses, therefore structurally controlled failures were not represented.
Additional analyses
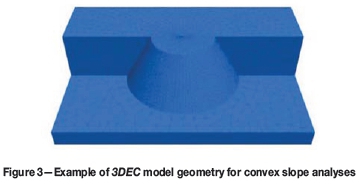
Additional analyses were performed for this paper using 3DEC to investigate the effects of a convex geometry on slope stability. The adopted parameters are the same as those used for the concave analyses discussed above (in terms of slope height and angle, material properties, and in situ stresses). The analyses were performed for various radii of curvature, with the radius being measured at the crest of the slope. An example 3DEC model is shown in Figure 3.
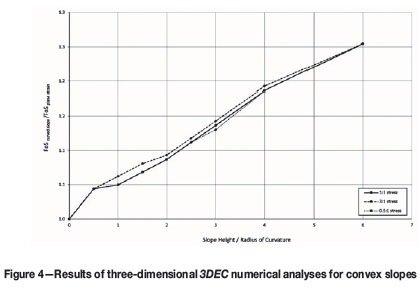
The results of the 3DEC analyses for convex slopes are presented in Figure 4. The following comments are based on these analysis results:
► The FoS increases as the radius of curvature decreases
► The adopted in situ stresses are seen to have some effect on the analysis results. The FoS is generally slightly higher as the horizontal in situ stress is increased, which is consistent with the results of the concave slope analyses. Despite this conclusion, the adopted stresses do not have a significant effect on the resulting safety factors. For these analyses, the difference between the safety factors produced by the analyses with different in situ stresses (with all other inputs the same) is always less than 0.05
► The analyses suggest that the effect of slope curvature on stability for a convex slope is less than that for a concave slope
► As for the concave analyses, normalized values are presented for the convex slope analyses, therefore the absolute values are not shown. To provide some idea of the change in FoS, for these particular analyses, it is noted that the FoS increased by approximately 0.1 when comparing a straight slope to a convex slope with a radius of curvature of 60 m.
The results are consistent with those produced by several others, including the results of the axisymmetric analyses performed by Lorig and Varona (2007). The increased stability for a convex slope compared to a straight slope is somewhat counter-intuitive given the lack of lateral confinement in a convex slope. A likely reason for these results is that, for a given failure shape, the failure will involve less volume for a convex slope when compared to a straight slope, and therefore the driving forces will also be less, resulting in a higher FoS. This is consistent with the hypothesis provided by Gomez et al. (2002) based on their waste dump analyses.
Note that the 3D isotropic, homogenous analyses performed here for both concave and convex slopes assume an idealized slope geometry, whereby the slopes are assumed to be perfectly symmetric. This is also the case for most of the previous 3D and all of the axisymmetric analyses performed by others. These idealized geometries provide a significant improvement in the predicted stability produced by the analyses. The idealized geometries would rarely occur in reality, and small perturbations to these geometries may lead to a reduction in the benefits provided by the concave and convex slopes. The effects of this difference in actual versus assumed slope geometries may be more important for 3D and axisymmetric analyses than for plane strain analyses.
Case study
The increase in stability indicated by the analysis results presented above is not consistent with the observed behaviour of convex slopes. As suggested by Lorig and Varona (2007), this is probably because these analyses assumed isotropic and homogenous rock mass conditions, while instability associated with convex slopes will often be structurally controlled, particularly in a hard rock environment.
An example of a failure that may have been influenced by the convex wall geometry is shown in Figure 5a. This failure occurred in an open pit gold mine in Western Australia in June 2011. The failure mechanism was a wedge controlled by two steeply-dipping structures on the sides and a flatter structure below. It can be seen in the photograph that the failure occurred within a convex 'bullnose' geometry, and it is thought that the lack of lateral confinement created by this geometry probably made instability more likely at this location. The orientation of the main controlling structures in relation to the pit face is shown in Figure 5b. The failure occurred soon after a blast was fired close below. The failure did not result in any equipment damage or injuries.
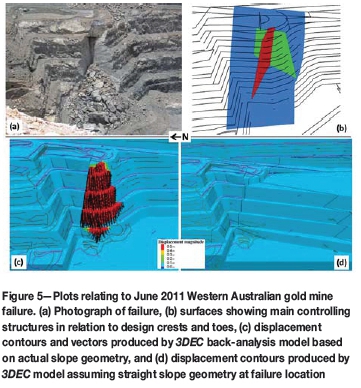
The failure was successfully back-analysed using 3DEC. The purpose of the back-analysis was to provide an understanding of the failure mechanism, and to refine the fault and rock mass properties for use in forward analyses for other slopes at the mine. The displacement contours and vectors produced by the back-analysis model are shown in Figure 5c.
To assess the influence of slope geometry on the wall behaviour, the original 3DEC back-analysis model was reconstructed assuming that a straight wall existed at the failure location. The model was then rerun using the same material properties that were developed as a part of the initial back-analysis, and in this case, failure was not predicted by the model. Displacements produced by the rebuilt model (with the straight wall geometry) are presented in Figure 5d. It is seen that the lateral controlling structures still daylight in the pit face. Based on strength reduction analyses, for the initial back-analysis, the FoS was slightly less than 1.0, increasing to greater than 1.5 when the wall was assumed to be straight. This indicates that the bullnose geometry may have been a significant contributing factor in this instability.
In this particular case, the bullnose geometry made release of the unstable blocks more likely due to the reduced lateral restraint.
Orientation of geological structures
Often, the orientation of geological structures with respect to the pit wall is a very important factor in the stability of that wall. A 3D representation of the slope and the structures is generally required in order to provide a realistic representation of the problem, particularly when the strike of the structures is oblique to the excavation face. A 2D analysis running perpendicular to the slope will represent the apparent dip of the structures, which will not be the actual dip if the strike of these features is oblique to the strike of the wall. In this case, the apparent dip will always be less than the true dip. A 2D analysis will also assume that the location of the structures in relation to the excavation face is constant along strike, and this will not be the case unless the structures strike parallel to the wall.
Another case study is provided here to illustrate these effects. In October 2011, a failure occurred on the east wall of a gold mine in Western Australia, as illustrated in Figure 6a. The instability was controlled by a large structure that dips steeply to the west-northwest at the back of the failure, and a flat-lying structure that dips into the pit at the base of the failure. Lateral release occurred through the rock mass and other smaller structures at the northern end of the failure. Mining of the failure area occurred several months prior to the slip, therefore the wall stood for a considerable time before failure. Failure occurred after a very significant rainfall event. The failure did not result in any equipment damage or injuries.


The orientation of the two main controlling structures in relation to the pit face is shown in Figure 6b. This general failure mechanism is common in hard rock open pit mines. The dip of the flat-lying structure at the base of the failure (blue surface in Figure 6b) is approximately 27°. Because this is significantly less than the inter-ramp slope angle, this structure daylights in the wall. The steeper structure at the back of the failure (red surface in Figure 6b) strikes oblique to the pit face. The pit face dips to the west, while this structure dips at approximately 67° to the west-southwest. The angle between the strike of this structure and the strike of the wall is approximately 18°. Because this structure strikes obliquely to the pit face, it is further behind the wall with increasing distance to the north, therefore some 'rock mass' failure was required at the northern end of the instability for slope failure to occur.
To provide an improved understanding of the failure mechanism, and to refine fault and rock mass properties for use in forward analyses, the failure was successfully back-analysed in 3D using 3DEC. Displacement contours and vectors produced by the back-analysis model are provided in Figure 6c. The same model was cut down to represent a 2D (plane strain) analysis for a section through the middle of the failure zone. The resulting displacement contours and vectors produced by this 2D model are shown in Figure 6d.
For the 3D back-analysis model shown in Figure 6c, the FoS was approximately 1.0. Using the same inputs, the FoS produced by the 2D analysis shown in Figure 6d was approximately 0.65. This is mainly because the 3D analysis accounts for the requirement for some breakout through the rock mass at the northern end of the failure. For the 2D analysis, based on the adopted section location, slope failure can occur in the model simply due to movement along two structures, without any requirement for lateral release to the north or south of the analysis section. The 2D analysis assumes that the location and orientation of the structures in relation to the pit face is consistent along the slope. This shows that the results of 2D and 3D analyses can differ significantly for the same slope when the same inputs are adopted. This highlights that the properties obtained from back-analyses using one analysis technique may not be applicable to another analysis technique. In this case, the resulting properties obtained from the 2D back-analysis could not be confidently used as inputs for a 3D analysis.
It is likely that different results would also be obtained if the June 2011 failure shown in Figure 5a was to be analysed in both 2D and 3D, because the geometry of wedge failures, which are very common in open pits, is clearly three-dimensional. This is why the most widely-used software for wedge analyses, such as Swedge (Rocscience, 2015) provide a 3D representation of the controlling structures.
Distribution of soil and rock mass domains
If soil or rock mass domains with differing strength properties exist along the strike of a slope, it may be impossible for a 2D analysis to provide a reasonable prediction of stability. If the selected section passes through the weaker materials, the resulting FoS may be too conservative, and if the section passes through the stronger materials, the FoS may be non-conservative.
Zettler et al. (1999) performed 2D limit equilibrium and numerical analyses, as well as 3D numerical analyses, for a slope consisting of two different materials. These were referred to as 'competent' and 'incompetent' materials. They found that the FoS from the 3D analyses was in between the FoS produced by separate 2D analyses using the competent and the incompetent material properties. They concluded that a 3D problem cannot be solved with a 2D analysis. They stated that taking the competent material properties for the whole slope will over-estimate the FoS, while taking the incompetent properties for the entire slope will lead to conservative results.
A clear example of how the distribution of rock mass domains can affect the analysis results is provided here based on numerical analyses performed for the Porgera open pit mine in the Enga Province in the highlands of Papua New Guinea. The mine produces both gold and silver and is operated by Barrick Gold Corporation. The existing pit is approximately 500 m deep. The pit walls encounter materials of variable strength, ranging from relatively weak mudstones to significantly stronger diorites. Prior to 2012, only 2D slope stability analyses had been performed for the mine, including both limit equilibrium and numerical analyses. Since 2012, 3D numerical analyses have also been performed for all parts of the pit.
Some of the 2D analysis sections passed through the southwest corner of the pit. A photograph of the southwest wall is provided in Figure 7a. 2D analyses were performed for these sections using both limit equilibrium and numerical techniques, and all analyses identified the potential for a deep-seated global failure mechanism after final pit excavation. Note that the limit equilibrium safety factors were greater than unity, and failure occurred in the numerical analyses only when the strength properties were reduced below best-estimate values. An example of the mechanism produced by strength reduction analyses using UDEC (Itasca, 2011) is provided in Figure 7b, while the adopted rock mass domains for this 2D analysis are shown in Figure 7c. It can be seen that, at this particular section location, global failure is able to occur through the relatively weak brown mudstones and black sediments domains.
Three-dimensional analyses were also performed for the wall using 3DEC, and the resulting FoS was more than 0.5 higher than that produced by the UDEC analyses. A north-south cut through the 3DEC model around the location of the final pit toe, showing the exposed rock mass domains after final pit excavation, is shown in Figure 7d. The 2D section location is also shown on this figure. The figure shows that stronger materials (diorite and calcareous sediments) exist to the north and south of the 2D section, respectively. These materials are significantly stronger than the brown mudstones and black sediments. The 'bridging' effect provided by these stronger materials results in more favourable 3D modelling results. Because of the 3D distribution of the rock mass domains, the failure mechanism produced by the 2D analyses is highly unlikely. The failure produced by the UDEC analyses is greater than 450 m deep. As shown in Figure 7d, this would need to 'squeeze' through a zone of less than 150 m wide if it were to occur in the brown mudstones and black sediments only. The stronger materials on each side of the 2D section have no effect on the results of the 2D analyses, because they are not intersected by this section. In reality, these stronger materials probably have a significant effect on the stability of the slope. The concave geometry of the southwest wall may also have contributed to the improved FoS produced by the 3D analyses.
Conclusions
The results of 2D and 3D analyses for the same slope will often be different for several reasons. The main reason for the differences in results is the ability of 3D analyses to account for the 3D nature of the various model inputs.
Based on a review of the literature and additional analyses performed for this paper, it is shown that slope geometry can have a significant influence on wall stability. A concave slope will be more stable than a straight slope due to the additional support associated with the lateral confinement provided by the concave geometry. Assuming an idealized geometry and isotropic, homogenous soil or rock mass conditions, analyses also indicate that a convex slope will be more stable than a straight slope. However, in reality, particularly where potential failures are structurally controlled, convex slopes will often be less stable due to the reduced lateral restraint.
The location and orientation of geological structures in relation to a slope, and the distribution of different rock mass domains along the strike of a slope, are also important factors that can affect analysis results. In particular, in a hard rock environment, where most failure mechanisms are structurally controlled, a true representation of the 3D nature of the structures is often critical in providing realistic stability estimates.
In some cases, for a long, straight slope in basic geological conditions, 2D analyses can provide a reasonable representation of the problem. However, in many cases, the inability of a 2D analysis to represent the true 3D nature of the problem will lead to unrealistic results. In these cases, 3D analysis is required to provide confidence that the potential failure mechanisms can be represented in the model.
Acknowledgements
The author would like to thank the Porgera Joint Venture and Barrick Gold Corporation for permission to present the Porgera case study shown in this paper.
References
Armstrong, R. and Stacey, T.R. 2003. A review of information on the influence of plan curvature on rock slope stability and its effect on the volume of wedge failures. Proceedings of the 10th International Society for Rock Mechanics Congress - Technology Roadmapf or Rock Mechanics, Johannesburg, South Africa. South African Institute of Mining and Metallurgy, Johannesburg. [ Links ]
Azocar, K. and Hazzard, J. 2015. The Influence of curvature on the stability of rock slopes. The 13th International ISRM Congress 2015, Montreal, Quebec, Canada, 10-13 May 2015. In press. [ Links ]
Bromhead, E.N. 2004. Landslide slip surfaces: their origins, behaviour and geometry. Landslides: Evaluation and Stabilization. Lacerda, W., Ehrlich, M., Fontoura, S.A.B., and Sayao, A.S.F. (eds.). Taylor & Francis, London. [ Links ]
Cala, M. 2007. Convex and concave slope stability analyses with numerical methods. Archives of Mining Sciences, vol. 52, no. 1. pp. 75-89. [ Links ]
Cheng, Y.M., Liu, H.T., Wei, W.B., and Au, S.K. 2005. Location of critical three-dimensional non-spherical failure surface by NURBS functions and ellipsoid with applications to highway slopes. Computers and Geotechnics, vol. 32. pp. 387-399. [ Links ]
Dawson, E.M., Roth, W.H. and Drescher, A. 1999. Slope Stability Analysis by strength reduction. Geotechnique, vol. 49, no. 6, pp. 83-5840. [ Links ]
Gitirana, G., Santos, M.A., and Fredlund, M.D. 2008. Three-dimensional analysis of the Lodalen Landslide. GeoCongress 2008, New Orleans, 9-12 March 2008. Reddy, K.R., Khire, M.V., and Alshawabkeh, A.N. (eds.). American Society of Civil Engineers. pp. 186-190. [ Links ]
Gomez, P., Diaz, M., and Lorig, L. 2002. Stability analysis of waste dumps at Chuquicamata Mine, Chile. Felsbau Rock Mechanics Journal, vol. 20, no. 6. pp. 61-689. [ Links ]
Hoek, E. and Bray, J. 1981. Rock Slope Engineering, 3rd edn. Institute of Mining and Metallurgy, London, uK. [ Links ]
Hoek, E., Rippere, K.H., and Stacey, P.F. 2000. Large-scale slope designs - A review of the state of the art. Slope Stability in Surface Mining. Hustrulid, W.A., McCarter, M.K., and Van Zyl, D.J.A. (eds.). Society for Mining, Metallurgy and Exploration, Inc., Littleton, CO. pp. 115-124. [ Links ]
Huang, C. and Tsai, C. 2000. New method for 3D and asymmetrical slope stability analysis. Journal of Geotechnical and Geoenvironmental Engineering, vol. 126, no. 10. pp. 917-927. [ Links ]
Itasca Consulting Group Inc. 2001. FLAC (Fast Lagrangian Analysis of Continua), Version 4.0. Minneapolis, MN. [ Links ]
Itasca Consulting Group Inc. 2011. UDEC (Universal Distinct Element Code), Version 5.0. Minneapolis, MN. [ Links ]
Itasca Consulting Group Inc. 2014. 3DEC (3D Distinct Element Code), Version 5.0. Minneapolis, MN. [ Links ]
Jiang, J.C., Baker, R., and Yamagami, T. 2003. The effect of strength envelope nonlinearity on slope stability computations. Canadian Geotechnical Journal, vol. 40. pp. 308-325. [ Links ]
Kayesa, G. 2006. Prediction of slope failure at Letlhakane Mine with the GeoMoS Slope Monitoring System. Proceedings of the International Symposium on Stability of Rock Slopes in Open Pit Mining and Civil Engineering Situations, Cape Town, 3-6 April. Symposium Series S44. Southern African Institute of Mining and Metallurgy, Johannesburg. pp. 605-622. [ Links ]
Leong, E.C. and Rahardjo, H. 2012. Two and three-dimensional slope stability reanalysis of Bukit Batok slope. Computers and Geotechnics, vol. 42. pp. 81-88. [ Links ]
Lorig, L. and Varona, P. 2007. Numerical analysis. Rock Slope Engineering. Civil and Mining. 4th Edition. Wyllie, C. and Mah, C.W. (eds.). Spon Press, London and New York. pp. 218-244. [ Links ]
Lutton, R.J. 1970. Rock slope chart from empirical slope data. Transactions of the Society for Mining, Metallurgy and Exploration and the American Institute of Mining, Metallurgy and Petroleum Engineers, vol. 247, no. 2. pp. 160-162. [ Links ]
Narendranathan, S., Thomas, R.D.H., and Neilsen, J.M. 2013. The effect of slope curvature in rock mass shear strength derivations for stability modelling of foliated rock masses. Slope Stability 2013. Dight, P.M. (ed.). Australian Centre for Geomechanics, Perth. [ Links ]
Nian, T.K., Huang, R.Q., Wan, s.S., and Chen, G.Q. 2012. Three-dimensional strength-reduction finite element analysis of slopes: geometric effects. Canadian Geotechnical Journal, vol. 49. pp. 574-588. [ Links ]
Piteau, D.R. and Jennings, J.E. 1970. The effects of plan geometry on the stability of natural slopes in rock in the Kimberley area of South Africa. Proceedings of the 2nd Congress of the International Society of Rock Mechanics. Belgrade. vol. 3. Paper 7-4. [ Links ]
Rocscience 2015. Swedge. 3D Surface Wedge Analysis for Slopes. Toronto, ontario. [ Links ]
Suarez, A.V. and Gonzalez, L.I.A. 2003. 3D slope stability analysis at Boinas East gold mine. FLAC and Numerical Modelling in Geomechanics. Proceedings of the 3rd International FLAC Symposium, Sudbury, Canada, 22-24 October 2003. Andrieux, P., Brummer, R., Detournay, C., and Hart, R. (eds.). A.A. Balkema, Rotterdam. pp. 117-123. [ Links ]
Totonchi, A., Askara, F., and Farzaneh, O. 2012. 3D Stability Analysis of concave slope in plan view using linear finite element and lower bound method. Transactions of Civil Engineering, vol. 36, no. C2. pp. 181-194. [ Links ]
Wei, W.B., Cheng, Y.M., and Li, L. 2009. Three-dimensional slope failure analysis by the strength reduction and limit equilibrium methods. Computers and Geotechnics, vol. 36. pp. 70-80. [ Links ]
Xing, Z. 1988. Three-dimensional stability analysis of concave slopes in plan view. Journal of Geotechnical Engineering, vol. 114. pp. 658-671. [ Links ]
Zettler, A.H., Poisel, R., Roth, W., and Preh, A. 1999. Slope stability analysis based on the shear strength reduction technique in 3D. FLAC and Numerical Modeling in Geomechanics. Detournay, C. and Hart, R. (eds.). A.A. Balkema, Rotterdam. pp. 11-16. [ Links ]
Zhang, Y., Chen, G., Zheng, L., Li, Y., and Zhuang, X. 2013. Effects of geometries on three-dimensional slope stability. Canadian Geotechnical Journal, vol. 50. pp. 233-249. [ Links ]
© The Southern African Institute of Mining and Metallurgy, 2016. ISSN 2225-6253.
This paper was first presented at the, International Symposium on Slope Stability in Open Pit Mining and Civil Engineering 2015, 12-14 October 2015, Cape Town Convention Centre, Cape Town.

