


Serviços Personalizados
Artigo
 Inglês (pdf)
 Artigo em XML
 Referências do artigo
Indicadores

Links relacionados
-
 Citado por Google
 -
 Similares em Google
Compartilhar

 Permalink
Journal of the Southern African Institute of Mining and Metallurgy
versão On-line ISSN 2411-9717
versão impressa ISSN 2225-6253
J. S. Afr. Inst. Min. Metall. vol.116 no.5 Johannesburg Mai. 2016
http://dx.doi.org/10.17159/2411-9717/2016/v116na1
PAPERS - SLOPE STABILITY CONFERENCE
Implications of collecting additional data for slope design in an open pit operation
M.-H. Fillion; J. Hadjigeorgiou
University of Toronto, Canada
SYNOPSIS
Geotechnical stability analysis and design in open pit mines requires access to representative geological, structural, hydrogeological, and rock mass models. The quality and quantity of collected geomechanical data used to build such models can have significant implications in the design of safe and economically viable slopes. Data collection is a continuous process throughout the life of a mine. The process starts from exploration to conceptual/preliminary feasibility, feasibility, design and construction, operations (early production/late production), and mine closure.
As geomechanical data is often limited at an early stage of a project, the estimated variability of the geotechnical factors may be larger than the actual data variability. This can potentially result in a conservative selection of the pit slope angle. Collecting additional geomechanical data at later stages of the mine development may contribute to reducing the uncertainty associated with the geotechnical properties and a steeper slope angle may be used for the design. This can result in significant economic benefits.
This paper investigates the impact of access to new data over time, following a series of geomechanical data collection campaigns, on design decisions. This is illustrated by comparing the resulting slope design, at three stages of the mine project, at a South African open pit mine. To demonstrate this, a series of slope stability analyses were performed using limit equilibrium tools. For each project stage, the slope angle design was modified until a similar probability of failure of 5% or less was obtained. The corresponding factor of safety distributions for each project stage were then compared to evaluate the impact of collecting additional data on the resulting slope design.
The results showed that data variability can differ significantly from one project stage to another. Data variability may be greater at more advanced project stages (i.e. a wider distribution of the factor of safety). Furthermore, the results showed that, even for the cases with greater variability, steeper slope angles were possible at more advanced stages for the proposed design requirement (probability of failure < 5%). In this investigation, as more data became available, the uncertainty associated with data variability could be sufficiently reduced to allow the selection of less conservative slope angles. This can be used as a managerial tool in developing data collection strategies and allocating the necessary funds, and can lead to important economic benefits to the mining operation.
Keywords: slope stability, factor of safety, probability of failure, open pit mining, uncertainty, data variability, project stages
Introduction
In an open pit mine operation, the results of the geotechnical stability analyses conducted for the design of safe and economically viable slopes can be significantly influenced by the quality and quantity of the geomechanical data. Data collection is a continuous process throughout the timeline of a mine operation (from exploration to conceptual/preliminary feasibility, feasibility, design and construction, operations (early production/late production), and mine closure). It has been generally assumed that the level of confidence in the data should increase from one project stage to another.
It is recognized that, in most cases, the quality and quantity of geotechnical data used for the country rock model and subsequently for slope design is generally inferior to the reserve data used to define the orebody (Hadjigeorgiou, 2012; Haile, 2004; Read and Stacey, 2009; Steffen, 1997). This implies that the level of confidence in the data used for the geotechnical design is potentially less than for the data used for resource and reserve estimation. The absence of quality data may make it difficult to quantify the impact of potential instability and may result in accidents, loss of life, equipment loss, and temporary or permanent closure of an access ramp. Steffen (1997) was arguably one of the first to articulate the specificity of geomechanical data for open pit design. Terbrugge et al. (2009) proposed general guidelines for possible, probable, and proven slope angle, similarly to the standards for reporting exploration data (e.g. JORC, 2012).
Terbrugge et al. (2009) and Steffen (2014) suggested that because data is limited at an early stage of a project, the estimated variability of the geotechnical factors may be greater than the actual data variability, resulting in a conservative selection of the slope angle. Collection of additional data at later stages may contribute to reducing the uncertainty associated with the geotechnical properties and a steeper slope angle may be used for the design, which results in economic benefits.
This paper investigates the impact of collecting additional data on the resulting slope design at three different project stages of an open pit mine. The results of an actual case study are compared to the approach proposed by Terbrugge et al. (2009) to investigate the relevance and impact of additional data collection for this site.
Case study - Mine A
Mine A was selected as a case study because of the quantity and quality of the available geotechnical data. Mine A is an open pit mine operated by Anglo American in South Africa.
Geology
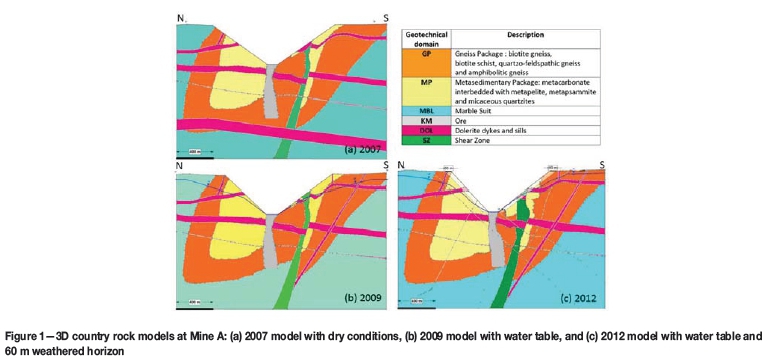
Three versions of the 3D country rock model are available at Mine A. The N-S section is presented as an example in Figure 1. The first version (Figure 1a) is a 2007 model, the second (Figure 1b) is a 2009 model, and the third is a 2012 model (Figure 1c). For the three models, six geotechnical domains are defined. Geotechnical domains are areas of the proposed pit with similar geological, structural, and material property characteristics (Read and Stacey, 2009). The water table, for a pit approximately 400 m deep, was added to the 2009 and 2012 models. For the 2012 model, a weathered horizon, located 0-60 m from the slope limit, was introduced to the model. The rock mass properties in each geotechnical domain vary according to the structural volume (i.e. the location within the pit area) (Mine A, 2012). Major structures were introduced in the updated 2012 model (Figure 1c).
Geotechnical properties database
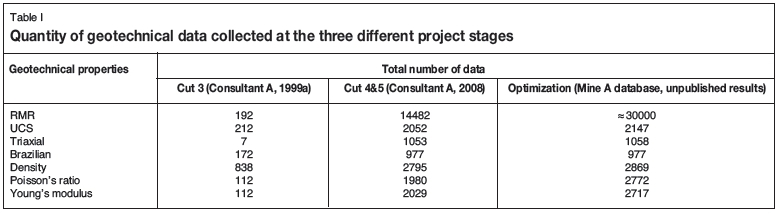
Geotechnical properties are available for three different project stages at Mine A. The first stage is a geotechnical investigation for Cut 3 (Anon., 1999a, 1999b); the second stage is a pit slope design study for Cuts 4 and 5 (Anon., 2008); and the last stage includes the geotechnical properties used for a slope optimization study (Mine A, 2012). Table I shows the total number of data for different geotechnical properties at the three project stages. As shown in Table I, the quantity of data collected generally increases from the early stage (Cut 3) to the more advanced project stage (slope optimization study). As more data becomes available, the corresponding uncertainty associated with the geotechnical properties should be reduced. However, other factors than additional data (e.g. the methods of analysis, the interpretation of data, the interpretation of other sources of information, the judgmental inputs, etc.) can also contribute to the changes in the strength parameters used at the various project stages. For this case study, the strength parameters used for the Cut 3 slope design were based on the geotechnical properties collected, on the back-analyses of slope failures, and sensitivity analyses were also performed to determine the impact of using different strength parameters (Anon., 1999a). For the Cut 4 and 5 stage, the estimation of the rock mass strength parameters was based on the more recent version of the drill-hole log database (2007 version) and on the results of the laboratory testing programme. Mohr-Coulomb parameters (cohesion and friction angle) based on the Hoek-Brown criterion were estimated to represent the rock mass strengths (Anon., 2008). For the optimization stage, strength parameters were determined from the updated geotechnical database and the data was weighted based on the percentage of each rock type per geotechnical domain (structural volume). The project resulted in the re-defining of domains for the pit (Ekkerd, 2012).
Uncertainty in geotechnical engineering
Uncertainty in geotechnical data can be due to the natural variability caused by random processes (aleatory) or to lack of information (epistemic). The natural variability in rock mass parameters is due to the processes of formation and continuous modification over geological history, which result in a variation in properties from one spatial location to another over the micro and macro scales (spatial variability), variability in properties at a single location over time (temporal variability), or both. In this case the variability is considered aleatory because it is typically represented as a random process over the project area. As this variability is inherent in the material, additional data will not eliminate the uncertainty, but will allow a better understanding of it. The epistemic uncertainty is due to a lack of data, limited information about events and processes, or lack of understanding of the process. With additional data, the epistemic uncertainty due to the lack of knowledge may be reduced to give a better understanding of the true variability (aleatory uncertainty) of the geotechnical data. For the geotechnical data collection process, the epistemic uncertainty is a combination of the site characterization uncertainty and the parameter uncertainty. The site characterization uncertainty refers to the accuracy of the geological model, which is affected by data and exploration uncertainties (measurement errors, data handling/transcription, and inadequate data coverage). The parameter uncertainty results from the inaccuracy in determining geotechnical parameters from test data. Statistical estimation errors and transformation errors (i.e. transforming intact rock parameters to rock mass parameters) are the major components of the parameter uncertainty, both of which become less important as additional data is collected (Christian and Baecher, 2003; Christian, 2004; Hadjigeorgiou and Harrison, 2012; Langford, 2013).
In this paper, in addition to the aleatory uncertainty inherent in the geotechnical domains, both the site characterization uncertainty and the parameter uncertainty will be addressed by including the geological model geometry and the geotechnical properties in the data analysis process.
Data analysis
Reliability-based design
In the process of designing optimal (safe and economic) slopes for an open pit mine, deterministic and probabilistic slope stability analyses can be conducted in order to determine the appropriate slope angle. Deterministic approaches are traditionally used and consider only a single set of representative parameters. The results of deterministic slope stability analyses are expressed in terms of a factor of safety (FoS), which compares the slope capacity (resisting forces) with the driving forces acting on the slope (gravity and water pressure). Since deterministic approaches provide only a first-moment approximation of the mean response, they can miss the true failure mechanism. In order to address this issue, conservative values are generally selected to ensure an adequate performance of the pit slope, which can result in unnecessary costs. Reliability methods, in conjunction with more traditional design methods (deterministic methods), can provide a better understanding of the design performance by quantifying the uncertainty in both the loads and resistances acting on a system. These consist of performing probabilistic slope stability analyses to determine a statistically based criterion, the probability of failure (PoF) that can be assessed with respect to a prescribed failure mode. The probability of failure is the probability (%) that the FoS will be unity or less. FoS and PoF values associated with a certain pit slope angle can be compared to the acceptance criteria for the corresponding slope scale (bench, inter-ramp, overall) and the resulting consequences of failure (low, moderate, high). Acceptance criteria allow the mine management to define the required level of performance of a slope against instability and/or failure. The level of acceptance may vary, depending upon the importance of the slope. Reliability-based design can provide a better understanding of the risk and a more economic design (Christian, 2004; Langford, 2013; Langford and Diederichs, 2011; Priest and Brown, 1983; Read and Stacey, 2009).
For this paper, both limit equilibrium probabilistic and deterministic slope stability analyses were conducted and the results of the deterministic approach are compared to the results obtained from finite element slope stability analyses.
Limit equilibrium analyses
Slope stability analyses were conducted using Slide (Rocscience 2010). Slide is a 2D limit equilibrium slope stability software package that can be used for circular-type failures with circular or non-circular failure surfaces. Other software can also be used for slope stability analyses. Deterministic and probabilistic slope stability analyses were conducted with Slide. Considering the overall slope failure scale, the proposed design requirement for the probabilistic slope stability analyses is PoF < 5%. Typical FoS and PoF acceptance criteria values are proposed in Read and Stacey (2009). It is suggested that for an overall slope scale with high consequences of failure, the maximum PoF should be 5%. Christian (2004) also provides details about the f-N diagrams (i.e. annual probability of failure vs risk cost or number of lives) that can be used in decision-making regarding the acceptable PoF. It is suggested that typical values for the PoF for mine pit slopes are in the range of 1-10%. The PoF approach does not take into account the consequences of failure or the impact of mitigating measures. Risk-based designs can be undertaken to allow mine management to assess a slope design in terms of acceptance criteria that include safety or economic impacts to relate the PoF results with annual impacts.
Because the number of equations of equilibrium available is smaller than the number of unknowns in slope stability problems, all equilibrium methods of slope stability analysis employ a series of assumptions to solve the problem. Duncan (1996) suggests that these assumptions do not have a significant effect on the FoS if the method satisfies all conditions of equilibrium (Janbu, 1954; Morgenstern and Price, 1965; Spencer, 1967). In the case of force equilibrium methods (Bishop, Ordinary/Fellenius) the value of the FoS can be significantly affected by the assumed inclinations of the side forces between slices (Duncan, 1996). Because those methods satisfy all conditions of equilibrium, the Janbu's corrected, Morgenstern and Price, and Spencer's methods were used with the non-circular path search option. For each slope, 20 000 surfaces were analysed. The optimize function was used to optimize the shape of the failure surface. The PoF values for the critical failure surface were calculated using 10 000 Monte Carlo simulations with a normal distribution assigned to the input parameters. Monte Carlo analysis is a random or pseudo-random sampling technique allowing the calculation of the PoF directly (Langford, 2013). It is assumed that for a given stability analysis each variable takes a single value selected randomly from its measured distribution, independently from the other variables. In certain cases, it can also account for the dependency between variables using coefficients of correlation during the sampling process. The group of randomly selected parameters is combined with the fixed input data to generate a single value of FoS. A large number of FoS values is obtained by repeating this process (e.g. 10 000 times for this specific case) and the FoS values can be plotted in histogram form (Priest and Brown, 1983). A series of slope stability analyses were conducted for different slope angles. The slope angle was modified (increased or reduced) until a PoF of 5% or less was obtained. The 10 000 FoS values were then exported from Slide into MATLAB (Mathworks, 2014) in order to fit a probability distribution to the FoS values and compare the resulting distribution at each project stage. For indicative purposes only, the kernel smoothing function estimate was used to fit the histograms of the FoS values. The kernel smoothing function estimate returns a probability density estimate for the sample (represented by a vector of data). The estimate is based on a normal kernel function, and is evaluated at 100 equally spaced points that cover the range of the data in the vector.
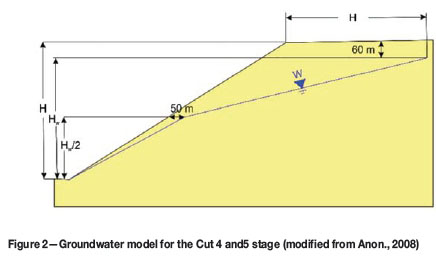
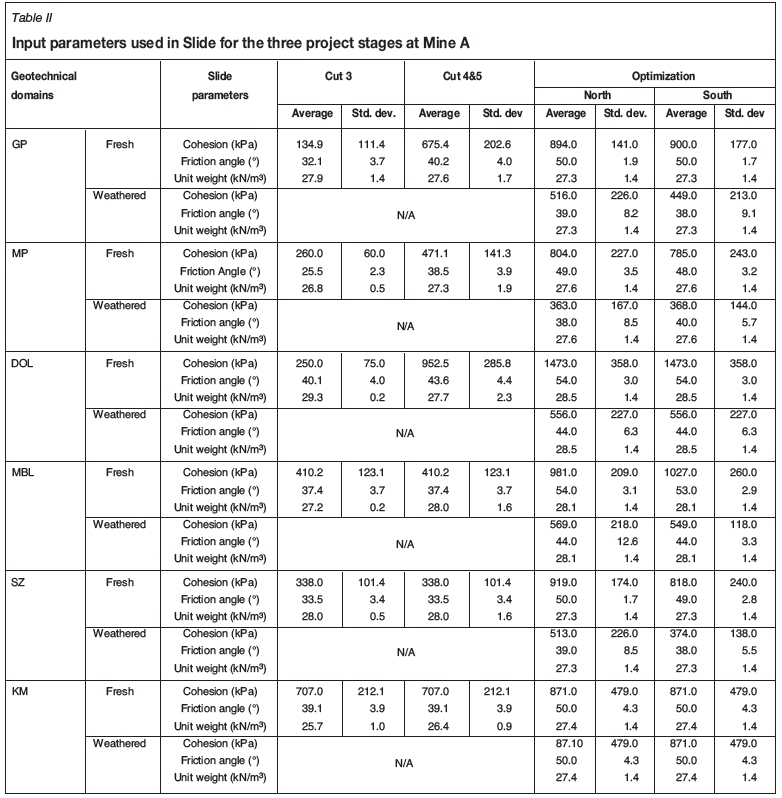
Failure surfaces at the overall slope failure scale for two different slopes were analysed at Mine A for each of the three project stages (Cut 3, Cuts 4 and 5, Optimization). The north and south faces were analysed for a pit approximately 425 m deep. The Mohr-Coulomb strength criterion was derived from the available data at each of the three project stages (Anon., 1999a, 1999b, 2008; Mine A, 2012) and was used for the analyses. The input parameters (cohesion, friction angle, and unit weight) used in Slide for the three different project stages are presented in Table II. Since no specific properties were available regarding the phreatic surface for the Cut 3 stage, all analyses were conducted for drained conditions. For more advanced project stages, the hydrogeological model was refined and water properties became available. The groundwater model presented in Figure 2 was used for the Cut 4 and 5 stage and a phreatic surface was established at the Optimization stage (see Figure 1c).
Finite element slope stability analyses
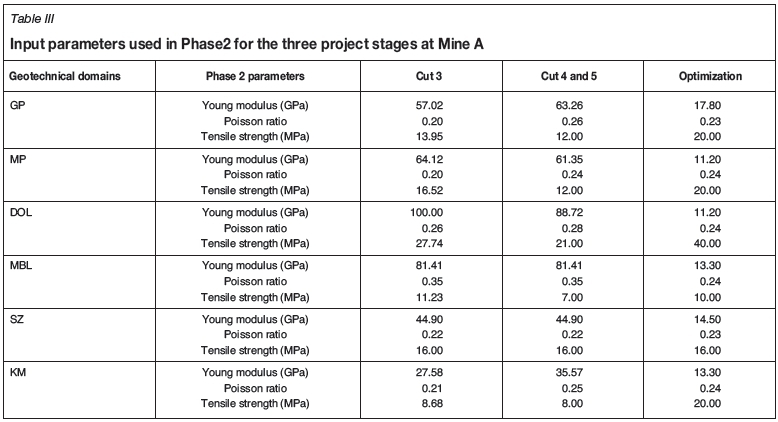
Deterministic finite element slope stability analyses using the shear strength reduction (SSR) method were conducted in Phase2 (Rocscience, 2011) to compare the results obtained from the deterministic analyses conducted with Slide. It is recognized that elastoplastic finite element analyses agree well with the results of conventional equilibrium analyses of slope stability (Duncan, 1996). Phase2 allows determination of the strength reduction factor (SRF), which is considered equivalent to the FoS in Slide. Probabilistic slope stability analyses were not conducted in Phase2 due to the considerable amount of time required. The selected analysis type is plane strain with the Gaussian Elimination solver type and an initial SRF of 1. The gravity field stress type is used with the actual ground surface, total stress ratio of 1 and locked-in horizontal stress of zero. Field stress and body force is used as the initial element loading with an isotropic elastic type. The material type is plastic and the Mohr-Coulomb failure criterion is used. The elastic properties (Young's modulus, Poisson's ratio) are also from the mine's database (Anon., 1999a, 1999b, 2008), but the values for the Optimization stage are from Anon. (2009a, 2009b). The Young's modulus and Poisson's ratio used in Phase2 for the three project stages are presented in Table III. The same elastic properties were used for both the fresh and weathered horizons at the Optimization stage. The dilatation angle and residual tensile strength are assumed to be zero. Residual cohesion and friction angle are assumed to be equivalent to peak values. A uniform mesh type is used with six-noded triangular elements and a number of elements set to 3000. The SSR search area window was used to limit the calculations to the slope section analysed.
Results
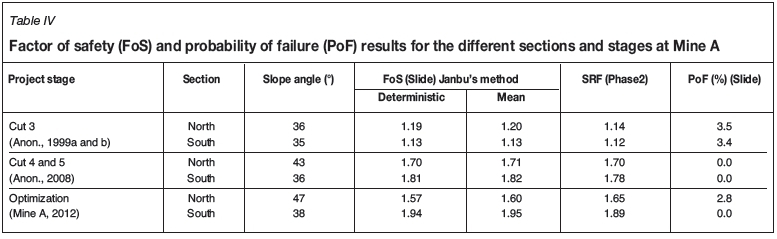
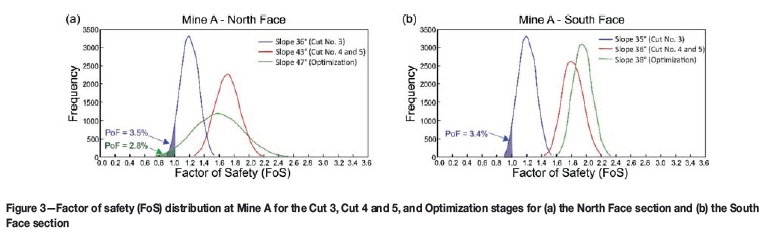
Deterministic values of the FoS were obtained for the critical failure surface. The mean FoS value as well of the PoF were obtained from the probabilistic analyses of the critical failure surface. Table IV presents the FoS and PoF results for the different pit sections at the three stages. Since the results obtained with the three equilibrium methods (Janbu's corrected, Morgenstern-Price, and Spencer's methods) are similar, and for simplification purposes, only the results for the Janbu's corrected method are presented in Table IV. The explanation of the small differences obtained with the different methods is beyond the scope of this work. For comparison purposes, the SRF obtained using Phase2 is also presented in Table IV and is similar to the FoS obtained with Slide. Figure 3 shows the FoS distributions of the two different sections for the three project stages. Table IV shows that higher slope angles are possible at more advance project stages. Furthermore, for the Cut 4 and 5 and Optimization stages, there is a zero or close to zero PoF for steeper slope angle than for the Cut 3 stage. Even with a zero probability of failure, the slope angle was not further increased in order to remain representative of the real designed slope angle at the corresponding project stage. Note that the PoF is close to zero only for the type of failure analysed (i.e. circular slope failure); it may be higher for other type of failures (planar, wedge, rockfall, toppling) that are not analysed in this paper.
Figure 3 shows that the FoS distribution becomes wider from the Cut 3 to the Cut 4 and 5 stage, with higher mean FoS at the Cut 4 and 5 stage. However, at the Optimization stage, the FoS distribution for the South section is narrower than for the Cut 4 and 5 stage with a higher mean FoS (Figure 3b). For the North section, the FoS distribution becomes wider, with a smaller mean FoS value (Figure 3a).
Discussion
Theoretical slope design variation through project stages
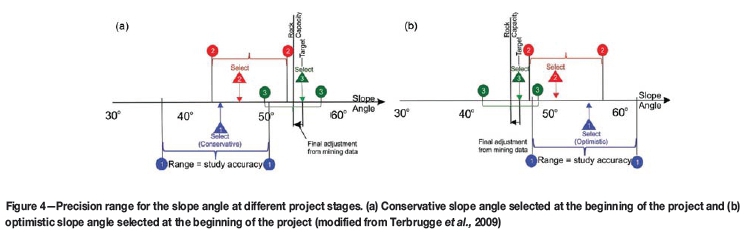
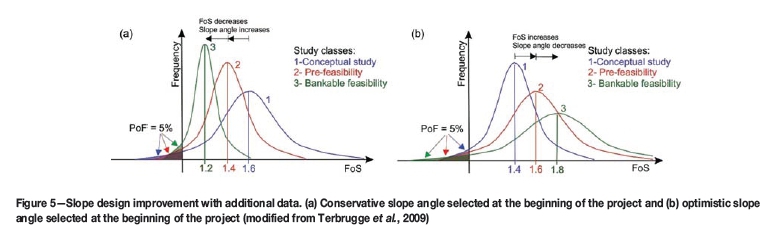
Currently, there are two issues that merit consideration in construction of a reliable geotechnical model that can be used for slope design. The first deals with the use of appropriate guidelines in data collection, and the second is that geomechanical data is sometimes collected without a strategy for subsequent analysis. Terbrugge et al. (2009) and Steffen (2014) suggest that, similarly to resource and reserve estimation, confidence categories should also be defined for slope design (i.e. possible, probable, and proven slope angles). They suggest that with relatively little data at the early stages of a design process, the likely range of slope angles will be widely spread, and, as more data becomes available during more mature stages, the spread of data reduces and can provide sufficient reliability for mine planning. Effectively, as shown in Figure 4a, the level of confidence in the geotechnical data is less for the conceptual stage, which results in a wider precision range and a more conservative slope angle than for the pre-feasibility and the feasibility studies. By collecting additional information, the level of confidence in the data increases and the precision range can be reduced. Then, a steeper slope angle can be selected for the slope design. Steeper slope angles are economically attractive because steepening a slope even by a small increment can have a considerable impact on the return of the operation through increased ore recovery and/or reduced stripping (Read and Stacey, 2009). Figure 5a shows the relationship between the FoS and the PoF as the level of confidence in the data increases from the conceptual to the feasibility study. As shown in Figure 5a, the FoS decreases as the slope angle increases from the conceptual to the feasibility stage. However, the positive impact of additional information (i.e. an increased level of confidence in the geotechnical data) is that the PoF is the same, which results in economic benefits.
However, as the project progresses and the quantity and quality of the available information improve, steeper slope angles are not always achievable. In some cases, an 'optimistic' slope angle may be selected at an early stage (Figure 4b) because the allowance for uncertainty is insufficient and does not represent the true variability of the data. With additional data collection, the 'epistemic' uncertainty due to lack of knowledge may be reduced to give a better understanding of the true variability (aleatory uncertainty) of the geotechnical data. The greater variability of the data at later stages of a project may result in a flatter slope angle, as shown in Figure 5b.
In the following section, the slope design of the mine case study through different project stages is compared to the approach presented in Figure 5. Figures 5a and 5b are idealized conceptual representations of the slope design process in terms of uncertainty of the geotechnical information available through the project stages. In a real case situation, there are many other factors (methods of analysis, acceptance criteria, interpretation of data, judgemental inputs, interpretation of other sources of information, etc.), apart from the amount of data, that have an influence on the slope design angle.
Slope design variation through the three project stages
A potential contribution of this paper was to determine, through a case study analysis, how the increasing availability of data caused technical modifications in an open pit. This can be achieved by looking at the influence of additional information on the slope design from early project stages to more mature stages. The stability analyses were performed with real geomechanical data for different project stages and for two different sections of the pit, the North and the South faces. The results do not follow exactly the same trend suggested by Terbrugge et al. (2009) and Steffen (2014). The other factors not related to the amount of data were not accounted for in the interpretations. The real mine data was compared with the idealized conceptual representations relative to the spread of the FoS distribution (wide or narrow FoS distribution), the variation of the mean FoS value, and the change in the slope angle design through the three project stages.
Spread of the FoS distribution
The wider FoS distribution obtained from the early Cut 3 stage to the more advanced Cut 4 and 5 stage for the North and South faces suggests that, in this particular case study, the additional data allowed the epistemic uncertainty associated with the lack of knowledge to be reduced and a better idea of the natural variability of the data to be obtained. Since the uncertainty associated with data variability increases, the FoS distribution is wider. This is similar to the FoS distribution presented in Figure 5b, except that the slope angle is not reduced at the more advanced stage. For the Optimization stage, the FoS distribution of the South slope is narrower than for the previous stage, with a higher mean FoS and a steeper slope angle. This is similar to the approach presented in Figure 5a, except that the mean FoS is not reduced. For the North slope, the FoS distribution at the Optimization stage is wider than for the two previous stages, which is similar to Figure 5b, but the mean FoS is slightly less than for the previous stage (Cut 4 and 5 stage).
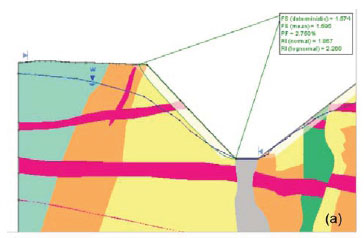
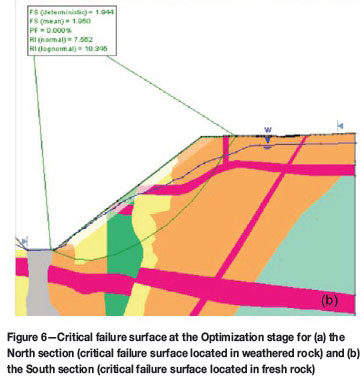
The Optimization stage resulted in re-defining geotechnical domains for the pit. For example, for the six geotechnical domains, two different data-sets are used, one for the fresh rock and one for the weathered rock (i.e. the horizon located 0-60 m from the slope limit, as shown with light colours in Figure 1c). Different rock properties were assigned to the geotechnical domains for the fresh and weathered rocks, depending on their structural domain. The structural domains are assigned depending on the slope orientation (e.g. N, SE, S, SSW, and WSW). This is why the geotechnical properties of the North slope are slightly different to those for the South slope. The definition of more geotechnical domains at the Optimization stage may have contributed, for the South slope, to reduce the uncertainty associated with data variability in each domain and this may explain the narrower FoS distribution. The wider FoS distribution for the North slope is probably due to the location of the critical failure surface. Indeed, for the North slope, the critical failure surface is located in the weathered horizon (Figure 6a) instead of in the fresh rock as it is the case for the South slope (Figure 6b). Since the standard deviation is generally higher for the properties in the weathered horizon, this can explain the higher variability in the resulting distribution for the FoS in the North slope.
Variation of mean FoS value
For the two early stages, the FoS distribution was similar to Figure 5b, i.e. a wider distribution at the more advanced stage (Cuts 4 and 5 stage) with a higher mean FoS value. However, the slope angle is steeper for the more advanced project stage. Terbrugge et al. (2009) suggested that when more information about the true variability of the data is available (i.e. the epistemic uncertainty is reduced), higher mean FoS are obtained at later stages because the insufficient allowance for uncertainty at the previous stage caused the selection of an optimistic slope angle at the beginning of the project (Figures 4b and 5b). For that particular case, very little data was available at the early stage and, even if the data variability increases at the Cut 4 and 5 stage, the availability of additional data resulted in higher average estimates for cohesion and friction angle, which resulted in more stable slopes (i.e. higher mean FoS values). For the Optimization stage, the FoS distributions and the variation of the mean FoS values are different for the North and South slopes, i.e. a wider FoS distribution with decreasing mean FoS for the North slope and a narrower FoS distribution with an increasing mean FoS for the South slope. For that particular case, the location of the critical failure surface (Figure 6a and 6b) may also explain the variation of the mean FoS value. Dividing the domains in fresh and weathered horizons may have contributed to an estimate of higher cohesion and friction angle values for the fresh rock (the smaller values being characteristic of weathered rocks), which may have resulted in smaller FoS values for the North slope and higher FoS values for the South slope, with their critical failure surface located in weathered and fresh rocks respectively.
Change in the slope angle design
For the two early stages (Cut 3 and Cut 4 and 5), even if the FoS distribution and the mean FoS values are similar to the trend proposed in Figure 5b, the steeper slope angle obtained is different to that in the approach proposed by Terbrugge et al. (2009). Effectively, the wider FoS distribution with a higher mean FoS at the Cut 4 and 5 stage is obtained for a steeper slope angle (43° for the North section and 36° for the South section, compared to 36° and 35° respectively for the North and South faces at the Cut 3 stage). For that particular case, the additional data collected at the Cut 4 and 5 stage resulted in higher average estimates for cohesion and friction angle, which allowed for stable slopes at steeper angles.
For the Optimization stage, the re-definition of the geotechnical domains in fresh and weathered rocks indicated that some steeper slope angles are viable in a number of domains (Mine A, 2012). This was observed for the North and South slopes, i.e. 47° and 38° at the Optimization stage vs 43° and 36° at the Cut 4 and 5 stage for the North and South slopes respectively.
Implications ofcollecting additional data on the slope design
The results obtained from the case study show that the data variability can differ significantly from one project stage to another. The results also show that data variability may be greater at more advanced project stages (i.e. a wider distribution of the FoS) even if a conservative slope angle is selected at the beginning of a project. Effectively, for both analysed sections, steeper slope angles are possible at more advanced stages for the proposed design requirement (PoF < 5%), even for the cases with larger variability. This suggests that with more data available at later project stages, the uncertainty associated with data variability can be sufficiently reduced to allow the selection of less conservative slope angles.
Limitations of the slope stability analyses
The previous interpretations assume that the input parameters are representative of the variability of the rock properties. The input parameter distributions have a direct effect on the calculated FoS values and on the corresponding FoS distributions. For any mining project, the amount of available data is often insufficient and the confidence levels on the input data are often unknown or assessed without using a rigorous statistical method. The consequence is that the removal or addition of a small quantity of data could significantly change the results of the rock characterization process. Even if expert judgement is normally included in the process, this method is subjective and hence susceptible to change. Therefore, rigorous data quality checks and confidence assessment of the characterization results are required to enable reliable interpretations of the modelling results.
Conclusions
This paper provided an assessment of the implications of collecting additional data on the resulting slope angle design for a mine case study. In this particular case study, even if the confidence levels in the modelling input parameters were not rigorously assessed (as this is generally the reality in mining geotechnics), the mine had a comprehensive database that met all good practice criteria. Probabilistic and deterministic slope stability analyses were conducted for three different project stages, the quantity of available data increasing from the early stage to the more advanced stage. For each section analysed, the slope angle was adjusted until a probability of failure smaller than 5% (considering a potential overall slope failure) was obtained for the critical failure surface and the frequency distribution for the corresponding factors of safety was obtained.
The result showed that the variability of the input data can be significantly different from one project stage to another, resulting either in a wider or in a narrower FoS distribution for a more advanced project stage. Effectively, in some cases, a wider distribution for the FoS values was obtained at subsequent stages, which implies that data variability may be larger at more advanced project stages. The results for this case study further demonstrated that, for the proposed design requirement (PoF < 5%), steeper slope angles were possible at more advanced stages, even for the cases with larger variability. This supports the generally accepted concept that collecting additional data may sufficiently reduce the uncertainty associated with data variability to support the decision of selecting less conservative slope angles. Other factors such as the methods of analysis, the acceptance criteria, the interpretation of data, the judgemental inputs, the interpretation of other sources of information, etc. can also have an effect on the uncertainty of the slope design. Assessing the level of confidence in all parameters used for modelling is required to obtain a reliable slope angle design. The selection of steeper and reliable slope angles can lead to important economic benefits to the mining operation. Assessing the impact of additional data collection may help in allocating the funds to develop data collection strategies.
Acknowledgements
The authors gratefully acknowledge Anglo American Corporation for providing data for this study and for their support of this project.
References
Anonymous. 2009a. Three-dimensional numerical modelling for country rock stability studies. Consultant's Report no. ISA-495. Santiago, Chile. 70 pp. [ Links ]
Anonymous. 2009b. Bench-scale and inter-ramp configuration analysis for the southwest design sectors. Consultant's Report no. ISA-548. Santiago, Chile. 17 pp. [ Links ]
Anonymous. 1999a. Determination of the slope angles for the southern slopes of Cut 3. Consultant's Report no. 173849/1. South Africa. 59 pp. [ Links ]
Anonymous. 1999b. Determination of the slope angles for the northern slopes of Cut 3. Consultant's Report no. 173849/2. South Africa. 23 pp. [ Links ]
Anonymous. 2008. Open pit slope design Cuts 4 and 5. Consultant's Report no. 173849. South Africa. 37 pp. [ Links ]
Christian, J.T. 2004. Geotechnical engineering reliability: how well do we know what we are doing? Journal of Geotechnical and Geoenvironmental Engineering, vol. 130. pp. 985-1003. [ Links ]
Christian, J.T. and Baecher, G.B. 2003. Reliability and Statistics in Geotechnical Engineering. Wiley, Chichester, UK. [ Links ]
Duncan, J. 1996. State of the art: limit equilibrium and finite-element analysis of slopes. Journal of Geotechnical Engineering, vol. 122, no. 7. pp. 577-596. [ Links ]
Hadjigeorgiou, J. 2012. Where do the data come from? Proceedings of the Sixth international Seminar on Deep and High Stress Mining, Perth, Australia, 28-30 March 2012. Potvin, Y. (ed.). pp. 259-278. [ Links ]
Hadjigeorgiou, J. and Harrison, J.P. 2012. Uncertainty and sources of error in rock engineering. Harmonising Rock Engineering and the Environment. Quian, Q. and Zhou, Y. (eds.). Taylor and Francis, London. pp. 2063-2067. [ Links ]
Haile, A. 2004. A reporting framework for geotechnical classification of mining projects. AuSMM Bulletin, no. 5. pp. 30-37. [ Links ]
Janbu, N. 1954. Application of composite slip surfaces for stability analysis. Proceedings of the European Conference on Stability of Earth Slopes, Stockholm. vol. 13. pp. 43-49. [ Links ]
JORC. 2012. Australian Joint Ore Reserves Committee. Australasian Code for Reporting of Exploration Results, Mineral Resources and Ore Reserves. The Joint Ore Reserves Committee of the Australasian Institute of Mining and Metallurgy, Australian Institute of Geoscientists and Minerals Council of Australia. http://www.jorc.org/docs/JORC_code_2012.pdf. [ Links ]
Langford, J.C. 2013. Application of reliability methods to the design of underground structures. PhD thesis, Queen's University, Kingston, Ontario, Canada. [ Links ]
Langford, J.C. and Diederichs, M.S. 2011. Application of reliability methods in geological engineering design. Proceedings of the Pan-Am CGS Geotechnical Conference, Toronto, ON, Canada, October 2011. 8 pp. [ Links ]
Mathworks. 2014. MATLAB Version R2014a, Language of technical computing. Natick, MA, USA. http://www.mathworks.com [ Links ]
Mine, A. 2012. 2011. K01/K02 Slope optimisation. Note for the record. Internal report. South Africa. 64 pp. [ Links ]
Morgenstern, N.R. and Price, V.E. 1965. The analysis of the stability of general slip surfaces. Geotechnique, vol. 15. pp. 79-93. [ Links ]
Priest, D.S. and Brown, E.T. 1983. Probabilistic stability analysis of variable rock slopes. Transactions of the Institute of Mining and Metallurgy, vol. 92. pp. A1-A12. [ Links ]
Read, J. and Stacey, P. 2009. Guidelines for Open Pit Slope Design. CRC Press/Balkema. 496 pp. [ Links ]
Rocscience Inc. 2010. Slide version 6.0, 2D Limit equilibrium slope stability software, Toronto, Ontario, Canada. https://www.rocscience.com [ Links ]
Rocscience Inc. 2011. Phase2 version 8.0, Advanced finite element analysis for excavations and slopes. Toronto, Ontario, Canada. https://www.rocscience.com [ Links ]
Spencer, E. 1967. A method of analysis of the stability of embankments assuming parallel interslice forces. Geotechnique, vol. 17. pp. 11-26. [ Links ]
Steffen, O.K.H. 1997. Planning of open pit mines on a risk basis. Journal of the South.African Institute of Mining and Metallurgy, vol. 97, no. 2. pp. 47-56. [ Links ]
Steffen, O.K.H. 2014. Risk management in geotechnical engineering and open pit mine planning. Proceedings of the First International Congress on Mine Design and Empirical Methods, Lima, Peru, 9-11 June. International Society for Rock Mechanics. [ Links ]
Terbrugge, P.J., Contreras, L.F., and Steffen, O.K.H. 2009. Value and risk in slope design. Proceedings of the Slope Stability Conference, Santiago, Chile, 9-11 November. [ Links ]
© The Southern African Institute of Mining and Metallurgy, 2016. ISSN 2225-6253.
This paper was first presented at the, International Symposium on Slope Stability in Open Pit Mining and Civil Engineering 2015, 12-14 October 2015, Cape Town Convention Centre, Cape Town.

