


Services on Demand
Article
 English (pdf)
 Article in xml format
 Article references
Indicators

Related links
-
 Cited by Google
 -
 Similars in Google
Share

 Permalink
Journal of the Southern African Institute of Mining and Metallurgy
On-line version ISSN 2411-9717
Print version ISSN 2225-6253
J. S. Afr. Inst. Min. Metall. vol.116 n.3 Johannesburg Mar. 2016
http://dx.doi.org/10.17159/2411-9717/2016/v116n3a10
PAPERS - MINE PLANNING AND EQUIPAMENT SELECTION (MPES)
Trends in productivity in the South African gold mining industry
P.N. Neingo; T. Tholana
School of Mining Engineering, University of the Witwatersrand, Johannesburg
SYNOPSIS
Mining companies globally are currently facing severe economic and financial challenges. In addition to global challenges, the South African mining industry has to face other operational challenges that are unique to the country and which threaten the survival and competitiveness of the industry. Profit margins are being squeezed by rising costs and decreasing commodity prices, while labour productivity is greatly affected by intermittent labour unrest. This paper analyses how the South African gold mining industry has performed pre-, during, and post the global financial crisis of 2008. The competitiveness of the industry in terms of labour productivity and industry cost curve position is analysed for the period 2006-2013 to assess the impacts of both the global financial crisis and labour unrest. An analysis of the South African gold mining industry is presented at company as well as mine level. Productivity measure in this paper is limited to labour productivity, in line with limited reporting on productivity. All the data analysed was obtained from the public domain.
Keywords: gold mining sector, competitiveness, productivity, industry cost curve, labour availability, labour utilization.
Introduction
South Africa dominated the world as the number one gold producer until 2009 when China took that position, and today South Africa ranks fifth after China, Australia, Russia, and the USA. According to Statistics South Africa (2009), South Africa still had about 30 years of production in the gold sector, a forecast that fluctuates based on the day's modifying factors. Although South Africa has a comparative advantage in terms of minerals endowment, there are challenges faced by the mining industry that hinder translation of the comparative advantage into a competitive advantage. The industry continually seeks to address these challenges to remain competitive in global markets while addressing national and community needs.
Neingo and Cawood (2014) argued that stakeholders in mining are continually concerned with mine management's ability to translate use inputs effectively into quality outputs. They further suggested close monitoring of effective utilization of people, materials, and money to obtain maximum production of commodities under given conditions. Productivity is measured in various ways, including unit cost, output per employee, and output per unit capital equipment.
The impacts of various challenges, including escalating costs, labour availability, and labour utilization on the mining industry, and the gold sector in particular, are quite evident. This is confirmed by EY (2014), who state that productivity on cost and volume bases has been declining since 2000, and various companies have engaged in different cost-cutting exercises. EY (2014) emphasized that the mining industry needs to regain ground lost over the supercycle; innovate to recover/gain competitive advantage; and counteract rising wages, hence the need to boost productivity. This paper discusses trends in productivity for South African gold mines and gold mining companies between 2006 and 2014. Productivity reporting is not yet fully practiced and where done, it is done in silos. This paper aims to provide a guideline to where the South African gold sector stands in terms of productivity, over a time period that captures the impacts of (1) the global financial crisis and (2) labour unrest. The choice of the gold sector was in line with its labour-intensive nature as well as to provide boundaries to the paper.
Due to variation in reporting, the paper discusses unit costs for AngloGold Ashanti, DRD Gold, Gold Fields, Harmony Gold, Pan Africa Resources, Sibanye Gold, and Village Main Reef. These were selected because they are listed companies, therefore their data is easily obtained from the public domain. The companies were also taken as a proxy for the South African gold mining industry due to their level of market capitalization. However, only AngloGold Ashanti and Harmony Gold reported labour productivity between 2010 and 2014. Therefore, trends in labour productivity were presented for the period reported. This practice in reporting is not strange to the mining industry, as Neingo and Cawood (2014), citing Strassman (2004), argued that the traditional financial reporting leans towards the interests of financiers.
Challenges facing the South African gold sector
Despite the historical contribution of the South African gold mining sector to both the global and national economy, the sector is faced with various technical, economic, social, and operational challenges that are seeing South Africa slowly losing its competitiveness in the global gold mining industry. In addition to the global challenges, the South African gold mining industry has to face challenges that are unique to the country.
Gold price volatility
Deloitte (2014) stated that even though mining companies are not strangers to commodity price volatility, the impact on the mining industry has recently been severe owing to declining economic growth in China. This volatility due to global economic conditions, which are beyond the control of South African companies, makes strategic planning challenging. This is because the gold price is a major value driver and price volatility has an adverse effect on revenue, cash flows, profitability, and mineral asset values. In addition to price volatility the gold price has been steadily declining. At the time of writing this paper the gold price was US$1189.95, 65% lower than its 10-year peak of US$1826.80 per ounce in September 2011, as shown in Figure 1.

The gold price volatility that is evident in Figure 1 and the current price decline is not sustainable for gold mines and if this situation is prolonged for longer, most operations will be mothballed. In South Africa, the declining gold price in US dollars is somewhat offset by a weakening rand, resulting in a relative increase in the rand price. However, despite this, real value may not be realized because of increasing costs and other constraints to productivity.
Escalating costs ofproduction
Meadows et al. (1992), as cited in Müller and Frimmel (2010), mentioned that in mining the relationship between ore grade and energy consumption in mineral processing is exponential. Mudd (2007), cited in the same paper, proved that this general exponential relationship also holds for gold mining. This means that the lower the ore grade, the greater the consumption of energy, reagents, water, and other consumables per unit of gold produced. This relationship is also proved on most typical industry cost curves: assuming everything else being equal, mines producing a higher head grade run-of-mine (ROM) are usually positioned in the lower quartile of the cost curve. This increased consumption, coupled with a general increase in input costs (and electricity in particular for South African mining operations), exponentially increases gold production costs. Figure 2 shows Eskom's historical tariff increases from 2007 to 2017.

The increasing electricity cost has recently been compounded by the current erratic supply, which further threatens the productivity and viability of the energy-intensive gold mining sector. In addition to energy costs, the costs of other major inputs to the mining process have been escalating.
Declining gold resource grade
Gold mining in South Africa started more than a century ago in the Witwatersrand goldfields. Most of the high-grade gold deposits have been exhausted and mines now exploit lower grades. This means that optimization is required to derive optimal value from the remaining low-grade and deep-lying deposits (Musingwini, 2014). Figure 3 shows the arithmetic mean of the ore grade of the main gold-mining countries.

Figure 3 indicates that gold ore grades have constantly declined over the past 80 years. Müller and Frimmel (2010) predicted that if only the decrease in gold grade since 1968 is plotted and extrapolated into the future the average gold grade will be as low as 0.9 g/t by 2050. This means that most current gold operations will be marginal. Musingwini (2014) mentioned that the average grade of South African gold mines has declined from approximately 12 g/t in the 1970s to approximately 5 g/t currently. Figure 4 shows the average recovered gold grade for South African mines from 2004 to 2013.
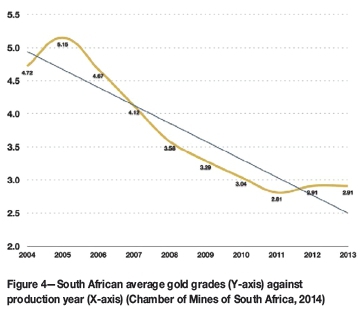
The steady decline in gold grades is evident in Figure 4. The graph shows a decrease from 5.15 g/t in 2005 to 2.91 g/t in 2013. This combination of declining resource grades, declining gold price, and increasing cost - the key value drivers - severely impacts the competitiveness of the South African gold mining industry. These challenges are further compounded by increasing depth of the mines, which further escalates the cost of production.
Depth and mining method
Over 95% of primary gold production in South Africa comes from underground mines. The orebodies in these mines are narrow and further characterized by geological discontinuities, preventing the application of mechanization and automation. South Africa hosts the worlds' deepest mines, which reach depths of close to 4 km. The Chamber of Mines of South Africa (2015) attributes the ability to mine to greater depth in South Africa to a lower geothermal gradient compared to other parts of the world. However, temperatures of up to 60°C have been experienced at the stope faces in some of the South African gold mines, necessitating the extensive use of ventilation and refrigeration to cool the working environment. At these depths, the cost of ventilation, coupled with the cost of rock support necessary to stabilize the working environment, are among the cost drivers. Seismicity also affects productivity in South Africa's deep gold mines. According to Mining Technology (2015), 'production at TauTona fell to 409 000 ounces in 2007, down from 474 000 ounces in 2006, due to increased seismic activity'
The South African gold mining sector is currently locked into existing mine designs and methods, which are producing at near full capacity. The existing mining methods are cyclic, non-continuous, and rely on equipment, such as scraper winches, that has limited capacity and efficiency. Arguably, productivity in the South African gold sector may be improved in the short to medium term with the existing mining methods. Therefore, the sector requires extensive research to review mine planning, design, and optimization as well as alternative mining methods to achieve sustainable productivity. In addition to the depth, most South African gold deposits are narrow reefs which makes mechanization difficult, hence the sector is highly labour-intensive.
Labour issues
The South African gold industry is characterized by inherent technical constraints such as the stoping width (about 1 m). Equipment is selected to suit the stoping width, causing the industry to continue being highly reliant on labour. Labour availability and utilization are becoming increasingly important, given the unionized nature of the mining industry. Tying in with the conventional mining methods used, depth, and low application of technology, labour productivity is affected by travelling time to the workplace (stope face), operator efficiency, mechanical availability of equipment, and non-input factors such as technological progress (Syed and Grafton, 2011). In some deep-level gold mines it takes up to an hour to travel from surface to the working place.
Several authors, including Roussos (1996) and Aljuhani (2002), classified human factors affecting productivity as:
> Labour availability and utilization
> Labour/management relations
> Labour/labour relations
> The crew quality.
Labour utilization is further dependent on the availability of equipment. However, while equipment availability is often fairly accurately predicted, based on some measured/real data, labour utilization is often not measured and estimations are made. Further issues affecting South Africa such as HIV and AIDS compound the availability of labour in the gold mining sector. Pan Africa Resources (2013) has shared concern about absenteeism, stating that 'at Barberton Mines, the management of absenteeism and sick leave remains a time-consuming function, necessary to ensure continuous, safe mining. Approximately 91 employees (3.6% of the workforce) were either sick or absent each working day.'
In 2011, industrial action took place in the form of strikes in the coal and gold sectors. However, labour representatives and the Chamber of Mines handled the wage negotiation process smoothly, and in both cases two-year wage agreements were signed (Chamber of Mines of South Africa, 2010/2011). In 2012, there was widespread labour unrest in the mining industry, especially in hard-rock mining, and which was more pronounced in platinum mining.
Without oversimplifying or ignoring the root causes of these incidents of unrest, they are an indication of the lack of trust between management and employees. With continued union pressures and labour issues, lack of trust extends further back among employees, which has led to some union members losing trust in union representatives. Therefore, there is a need to achieve employee and organizational goal alignment. While the root causes of this labour unrest remain largely unknown, it is important for mining companies to establish and report effective measures of productivity that inter alia take cognisance of such human factors.
In cases where agreements between unions and companies were reached to increase salaries, these agreements have proved to be beneficial, but only in the short to medium term. Companies invested in, and succeeded with, the adult basic education and training (ABET) programmes. However, it is clear that the recent labour unrest is also an indication of the conflict between companies' goals and expectations of employees, which are perhaps amplified by lack of education. Roussos (1996) stated that lack of education among workers is an important barrier to productivity because poorly educated employees have:
> Low literacy rates
> A low skill base
> Lack of understanding of business principles
> Lack of understanding of how workers fit into a productive workplace, or why productivity is important.
Roussos (1996) further argued that some cultures/languages/values can also hinder productivity. These include, but are not limited to:
> The lack of common values
> Different attitudes/cultures to/ of work
> Different political/ideological values and beliefs
> Linguistic barriers to effective communication.
Overall, most mines experience high variances in the time workers are paid for and the actual productive time. As observed at several mines visited, shorter effective shift time is caused by longer meetings than planned (and late starts thereof), long travelling time to the work stations, unauthorized breaks due to lack of self-discipline, and early work stoppages, to mention but a few.
Political, social, and environmental issues
The legal safety-related actions taken by the Department of Mineral Resources (DMR) against noncompliance with regulations such as Section 54 and/or Section 55 of the Mine Health and Safety Act 29 of 1996 also affect productivity. Therefore, some delays such as safety meetings cannot be avoided, but time spent can be improved, for example by giving incentives which incorporate health and safety, productivity, as well as degree of plan compliance, provided the plan is good. While these losses in production translate into fewer tons per employee, they also affect unit costs because during closure fixed costs such as labour have to be paid while no revenue is generated.
In 2011, the Youth League of the African National Congress called for nationalization of the mines, which caused concern among foreign investors (Chamber of Mines of South Africa, 2010/2011). In 2009 and more recently in 2015, South Africa experienced 'xenophobic attacks'. The short- to medium-term impacts of these actions include damage to socio-economic relations with other countries, leading to a weaker rand. However, in the long term these could affect investors' confidence. While discussions are ongoing to resolve these issues, there is a need for a more sustainable solution.
Productivity trends
Unit costs
Jaguar Mining (2010), as cited in Tholana et al. (2013), stated that industry cost curves are a useful analysis tool because they provide a trend in costs as a mine matures. The report also mentioned that industry cost curves provide an internal benchmark of performance to allow for comparison of mines/companies in the same industry. Given the maturity of most South African gold mines, a cost curve is useful in analysing the competiveness of different mines in the sector. Industry cost curve were constructed using an algorithm in Tholana et al. (2013). As mentioned previously, only listed companies with operations in South Africa were considered because of the availability of data and the appropriateness as proxy for the South African gold mining industry. A list of producing mines was compiled, from which data was collected. In constructing the cost curves, two data-sets for each mine were collected from the respective companies' annual reports; production in ounces and cash cost per ounce produced.
Gold mine industry cost curves
Figures 5 and 6 show the industry cash cost curves for the gold mines for the period 2006 to 2009 and 2010 to 2014, respectively. On each cost curve, different colours are used to distinguish mines from the same company, and the average gold prices published by Kitco (2015) for the different years are indicated by the red dotted lines.
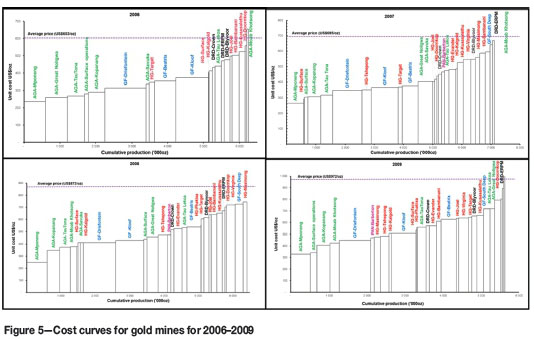

The lower half of most of the cost curves is dominated by large gold producers such as AngloGold's Mponeng and Great Noligwa, and Gold Field's Driefontein and Kloof, while the small gold producers dominate the upper half of the curve. This is because of the principle of economies of scale, which states that the more the production, the lower the unit cost of production. This is because of a high fixed cost component associated with the business of mining, which means that whether a mine produces or not there are high fixed costs that are still incurred, including ventilation, pumping costs, and in some instances salaries. In the middle of the cost curve there tends to be a mixture of low- and high-volume producers. This is because the small producers have high-grade deposits while the large producers have low-grade deposits, hence ultimately they would have comparable unit cash costs of production. Factors that have been identified to determine the position of a mine on an industry cost curve are:
> Mponeng, Moab Kotshong, and Kopanong are relatively low unit cost producers because of their relatively high-grade deposits. Moab Khotshong is also a relatively new operation compared to the rest of the gold mines in South Africa
> Barberton is also a lower unit cost producer because of its relatively high head grade
> Tailings treatment operations such as Harmony Gold's surface/Phoenix operations and AngloGold's surface operations are lower unit cost operations because of the lower mining and transportation costs associated with these operations compared to underground mines.
Gold mining companies' industry cost curves
The cost curves for gold mining companies were constructed from total production and weighted averages unit cash costs. A particular company's production was calculated from the total production of the individual mines in the analysis, while the unit cash costs were weighted averages calculated as:
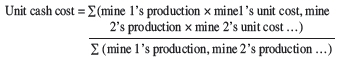
The consolidated production and cash cost data were not used because some gold companies have operations outside South Africa whose contribution is included in their consolidated annual reports, so using data from consolidated reports would not be representative of the South African gold mining sector. Figures 7 and 8 show the cash cost curves for the gold companies for the period 2006-2009 and 2010-2014, respectively. The average gold prices published by Kitco (2015) for the different years are indicated on each cost curve by the red dotted lines.


Gold production
Figure 9 shows the production by companies included in the analysis.

Figure 9 shows that the challenges discussed earlier have caused gold production to steadily declining from 2007 to 2014.
Labour productivity
Gold production is affected by various factors along the mining value chain, including accuracy of drilling and blasting, precision of short-term planning input factors, grade control, and quantification and minimization of mining losses from the resource to the final product. Labour productivity in the context of this paper refers to the metric ounces (oz) per total employee costed (TEC). According to the Chamber of Mines of South Africa (2014), the mining industry has generally seen a decline in productivity over the last 10 years.
Figure 10 shows the trend in productivity for the major commodities produced in South Africa, with gold recording the lowest productivity.

The over-reliance on labour in gold mines, due to lack of advanced technology that can be integrated into the existing mining layouts, cannot be over-emphasized. While some companies analyse their company and operations productivity periodically, it is important to establish how these mines compare with other mines. Figures 11-15 show the positions of mines in terms of ounces produced per total employee costed.
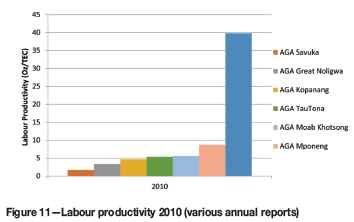


During the period 2010-2014, Anglo Gold Ashanti recorded major drops in productivity of 78%, 46%, and 43% at Surface Operations, Mponeng, and Kopanang, respectively. Among other drivers of declining productivity noted by Anglo Gold Ashanti (2014) included safety-related stoppages, unscheduled shaft maintenance at Mponeng, the 5.3 magnitude earthquake affecting Vaal River mines, as well as the decreasing grade of material sourced from marginal ore dumps for Surface Operations.
During the same period, Harmony Gold experienced both increments and declines in productivity at their operations. The highest increments noted included 187%, 108%, and 17% at Mbambanani, Steyn 2, and Target 1 mines, respectively. Declines of 23%, 17%, and 14% were experienced at Doornkop, Masimong, and Kalgold, respectively. Kalgold was noted to have experienced a decrease in productivity of 28% between 2013 and 2014. Reasons noted by Harmony Gold (2014) for the major decline at Kalgold were the delay in accessing higher-grade ore blocks and the fall in milling grades following heavy rains. Overall, Harmony Gold (2014) noted approximately 40 000 ounces lost due to safety-related stoppages, infrastructure and equipment failure, as well as insufficient mining flexibility as key challenges affecting production and productivity.
Conclusions and recommendations
Gold mining continues to be a major contributor to the South African economy. The country has a great comparative advantage in terms of gold mineral resource endowment, but the gold mining sector is faced with several challenges that prevent South Africa from turning this comparative advantage into a competitive advantage. Due to globalization, South Africa is not immune to global economic forces. The 2008 global financial crisis and the volatility and declining gold prices, declining grades of gold deposits, and access to capital are some of the global challenges faced by the South African gold sector. In addition to the global challenges, South African operations are also faced with challenges unique to the country that severely impact the sector's productivity, and hence profitability and sustainability. Such challenges include industrial action, political, social, and environmental issues, high electricity cost and erratic supply, the Department of Mineral Resources' Section 54 safety-related stoppages, and technical challenges associated with deep-level mining. All these global and local challenges have led to operating cost escalation, resulting in profit margin squeezes, decreased productivity, and possible future mothballing of some gold mines.
South Africa requires gold mining companies to develop innovative extraction strategies to ensure the long-term competitiveness and viability of the sector. Mining companies need to move away from traditional mine planning practices and start to incorporate optimization techniques into their mine plans. This includes shifting from the deterministic way of mine planning to probabilistic mine planning techniques.
References
Aljuhani, M. 2002. Labour's utilisation and labour's productivity of a gold mine in Saudi Arabia. Journal of the South African Institute of Mining and Metallurgy, vol. 102, no. 5. pp. 307-310. [ Links ]
Anglo Gold Ashanti. 2014. Integrated Annual Report 2014. Johannesburg. South Africa. [ Links ]
Chamber of Mines of South Africa. 2010/2011. Annual Report. http://www.bullion.org.za/documents/AR_2011-small.pdf [Accessed 15 March 2015]. [ Links ]
Chamber of Mines of South Africa. 2014. Facts and Figures 2014. https://commondatastorage.googleapis.com/comsa/f_f_2014_final.pdf [Accessed 19 May 2015]. [ Links ]
Chamber of Mines of South Africa. 2015. Gold Mining in South Africa. http://www.chamberofmines.org.za/mining-industry/gold [Accessed 23 May 2015]. [ Links ]
Deloitte. 2014. Tracking the trends 2014. The top 10 issues mining companies will face in the coming year. https://www2.deloitte.com/content/dam/Deloitte/global/Documents/Energy-and-Resources/dttl-er-Tracking-the-trends-2014_EN_final.pdf [Accessed 28 May 2015]. [ Links ]
Eskom Holdings Limited. 2013. Revenue application - multi year price determination 2013/14 to 2017/18 (MYPD3). http://www.eskom.co.za/CustomerCare/MYPD3/Documents/NersaReasonsforDecision.pdf [Accessed 30 May 2015]. [ Links ]
Ey. 2014. Productivity in mining: a case for broad transformation. http://www.ey.com/Publication/vwLUAssets/EY-Productivity-in-mining/$FILE/EY-Productivity-in-mining.pdf [Accessed 20 May 2015]. [ Links ]
GoldPrice. 2015. Gold price. http://goldprice.org/gold-price-history.html [Accessed 28 May 2015]. [ Links ]
Harmony Gold. 2014. Integrated Annual Report 2014. Harmony Gold, South Africa. [ Links ]
Kitco. 2015. Charts and data. http://wiww.kitco.com/scripts/hist_charts/yearly_graphs.plx [Accessed 1 June 2015]. [ Links ]
Mining Technology. 2015. TauTona, Anglo Gold, South Africa. http://www.mining-technology.com/projects/tautona_goldmine/ [Accessed 27 May 2015]. [ Links ]
Muller, J. and Frimmel, H.E. 2010. Numerical analysis of historic gold production cycles and implications for future sub-cycles. The Open Geology Journal, vol. 4. pp. 29-34. http://benthamopen.com/contents/pdf/TOGEOJ/TOGEOJ-4-29.pdf [Accessed 22 April 2015]. [ Links ]
Musingwini, C. 2014. Introduction of specialization in Mine Planning and Optimisation within the Master's degree (MSc) programme at the University of Witwatersrand. Proceedings of the 6th International Platinum Conference, 'Platinum - Metalfor the Future', Sun City, South Africa, 20-22 October 2014. Symposium Series S81. Southern African institute of Mining and Metallurgy, Johannesburg. pp. 23-27. [ Links ]
Neingo, P.N. and Cawood, F.T. 2014. Correlation of productivity trends with market factors at three selected platinum mines. Proceedings of the 6 th International Platinum Conference, 'Platinum - Metalfor the Future', Sun City, South Africa, 20-22 October 2014. Southern African Institute of Mining and Metallurgy, Johannesburg. pp. 181-188. [ Links ]
Pan African Resources plc. 2013. Integrated Annual Report 2013. Pan African Resources plc. South Africa. [ Links ]
Roussos, M. 1996. Productivity barriers in the mining industry. MBA thesis, School of Business Administration, University of the Witwatersrand. [ Links ]
Statistics South Africa. 2009. National Accounts: Mineral Accounts for South Africa: 1980-2009 http://www.statssa.gov.za/publications/D04052/D040522009.pdf [Accessed 20 may 2015 [ Links ]
Syed, A. and Grafton, Q. 2011. Productivity growth in Australian mining sector: an overview. http://www.bree.gov.au/documents/publications/BREE_REQ_Sept11_ProductivityGrowth.pdf [Accessed 15 March 2015]. [ Links ]
Tholana, T., Musingwini, C., and Njowa, G. 2013. An algorithm to construct industry cost curves used in analysing cash cost performance of operations for selected minerals in South Africa. Journal of the Southern African Institute of Mining and Metallurgy, vol. 113, no. 6. pp. 473-484. [ Links ]

