


Services on Demand
Article
 English (pdf)
 Article in xml format
 Article references
Indicators

Related links
-
 Cited by Google
 -
 Similars in Google
Share

 Permalink
Journal of the Southern African Institute of Mining and Metallurgy
On-line version ISSN 2411-9717
Print version ISSN 2225-6253
J. S. Afr. Inst. Min. Metall. vol.116 n.3 Johannesburg Mar. 2016
http://dx.doi.org/10.17159/2411-9717/2016/v116n3a9
PAPERS - MINE PLANNING AND EQUIPAMENT SELECTION (MPES)
Improvement in the overall efficiency of mining equipment: A case study
H. Fourie
Anglo American Platinum
SYNOPSIS
In mechanized mining, poor equipment efficiency (availability, utilization, productivity, and quality) can endanger the success of the operation. This case study will show how an initiative to improve equipment performance developed into a comprehensive turnaround plan for the mine that placed it in the forefront of performance achievement.
As part of a company-wide review process, poor overall equipment effectiveness (OEE) was identified as a major reason for the mine not achieving its targets. A project to improve the OEE identified eight improvement areas (elements) that contributed significantly to the poor performances. Measurement metrics were determined for these elements, followed by determination of baseline and target (improved) key performance indicators (KPIs). Cost savings associated with the improved efficiencies were calculated and tracked throughout the project. The mine team determined the specific actions required to achieve the target KPI in each element. These were individually developed and managed like mini-projects with allocated responsibilities for delivery
The paper will indicate how this OEE improvement initiative triggered an improvement in almost all sections of the mine. Soon after launch, the initiative gathered momentum as the KPIs starting to improve. A visible tracking system exists at the mine and each employee can see the improvements and feel the success. The original eight elements were extended by five more, and the mini-projects grew as participants saw the success of the initiative.
This paper concludes that through management and worker involvement, visible measurement and controls, and carefully chosen improvement elements, the mine was turned around. It is now achieving and exceeding its targets, and employee relations and motivation as well as safety have improved considerably. All of these achievements are reflected in the bottom line.
Keywords: overall equipment effectiveness, heavy mining equipment, productivity improvement, efficiency improvement, management support, cost reduction, motivated workforce, sustainability of success, key performance Indicators, action plans.
Introduction
As a result of the 2008/09 economic downturn, Mogalakwena platinum mine reduced its run-of-mine production in 2009 from 100 Mt/a to 35 Mt/a. The recovery to a budgeted 85 Mt/a in the following years proved to be a challenge, and was not achieved until 2014.
Mogalakwena is a Tier 1 operation in Anglo American Platinum (AAP) and crucial to the success of the company, especially in recent years with the restructuring that has been widely implemented in the industry.
Under-target performance from Mogalakwena impacted negatively on the company's ability to deliver on its promises to shareholders and other stakeholders.
In 2012 AAP launched a company-wide review ('the Platinum Review') with one of the main objectives being to identify opportunities for cost reduction and productivity improvement.
One of these initiatives was aimed at equipment performance at Mogalakwena. Overall equipment effectiveness, also referred to as OEE, is a hierarchy of metrics that focus on how effectively equipment is utilized. The OEE of a machine is the product of its operational availability, utilization of the availability, its productivity, and quality of operation.
OEE = Av χ UoAv χ Prod χ Q
where
OEE = Overall equipment effectiveness [%] Av = Availability of machine or fleet of machines
UoAv = Use of availability of a machine or fleet of machines
Prod = productivity (expressed as operating tempo) of a machine or fleet of machines
Q = Quality of work done by a machine or fleet of machines.
Hypothesis for improvement
As part of the Platinum Review, consulting company KPMG was contracted to investigate opportunities for cost reduction and productivity improvement. One of these opportunities was for improvement of the OEE at Mogalakwena, and was formulated as follows:
'There is an opportunity to enhance operating hours and bring down operating cost by improving the overall equipment effectiveness (OEE)for key mining equipment at Mogalakwena mine.'
KPMG further stated that:
> Analysis and management interviews showed that certain equipment types may not be operating at optimum efficiency levels
> Comparator data provided further evidence that equipment may not be operating at optimal utilization and availability; currently, levels were below the benchmarks for similar equipment.
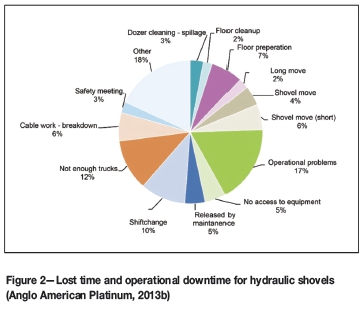
KPMG obtained data from the mine's fleet management system (FMS), Modular Dispatch, during 2011 and 2012 and compiled infographics showing the downtime distribution for each equipment type. Figures 1 and 2 show the downtime for shovels. Similar analyses were done for haul trucks and drill rigs.
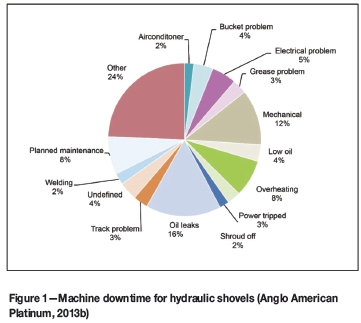
A preliminary assessment showed that the major reasons for shovels downtime were:
> Hydraulic oil leaks (16%)
> Mechanical downtime (12%) - a generic failure code that covers a variety of failures and is indicative of the reliability of the machine
> Overheating (8%)
> Bucket problems (15% for RH 400) caused by severe rock conditions resulting from poor blasting fragmentation
> Operational problems (17%) - a generic downtime code mostly attributable to poor blasting fragmentation
> Shift change (10%)
> Not enough haul trucks (12%)
> Shovel moves (12%).
Similar analyses were done for all the equipment in operation at the mine.
Development of improvement projects
Project initiation
During a workshop at the mine attended by the management team and key operational personnel, the analyses from the KPMG hypothesis together with the mine's own assessments were discussed and the following issues were identified as the main contributors to the poor equipment performance:
Availability
- Accident damage
- Power/cables
- Machine reliability
- Tyres
- Ground engaging tools
- Supply chain
- Maintenance by OEM/contractor
- Sources and facilities
- Maintenance scheduling.
Utilization
- Blasting delays
- Housekeeping
- Safety stoppages
- Equipment moves
- Meetings and travel to workplace
- Shift change
- Attendance / absenteeism / no operator
- Dust
- Dewatering
- Rain
- Equipment performing wrong jobs
- Road construction.
Productivity
- Quality (fragmentation, floors, water, MTBF, etc.)
- Tool selection (right machine for the job)
- Equipment size selection
- Short-term planning and work scheduling
- Haul profiles
- Operator competency.
The mine's team realized that a number of these issues were interrelated and that an effective improvement programme should focus on a small number of major issues. A list of eight issues (termed elements) to be addressed was then defined, as indicated in Table I.
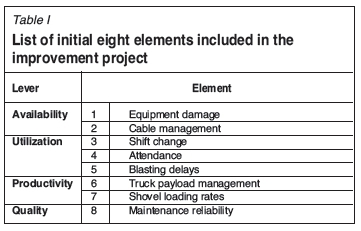
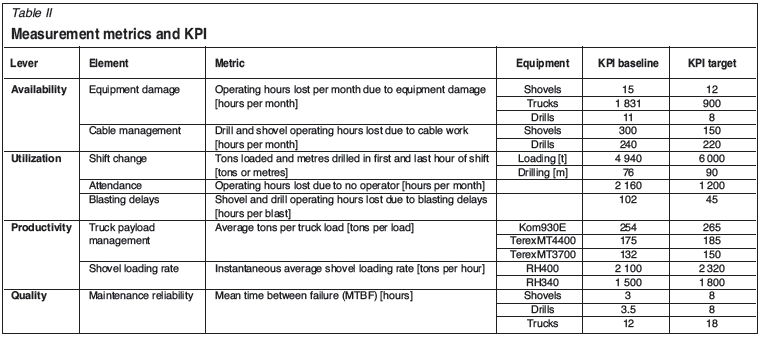
Measurement metrics and key performance indicators (KPI)
The metrics to be used to measure each element were determined as per Table II. Each element had to be measurable through existing systems on the mine, and preferably a history of data should exist in order to determine the baseline KPI.
Although it had to be upgraded and optimized, the FMS provided all the data required. From its historical data the baseline KPIs were determined.
The mine decided to include all of its primary production equipment, namely shovels, trucks, and drill rigs, in the initiative.
Three methods were used to determine the target KPI for each element:
> Benchmarking - information on the machine type and size used at Mogalakwena was not readily available within the group and from other mining operations. Where information was obtained, it was often generic and the definitions for the KPI quoted were unclear, making the benchmarking exercise of limited value
> Best demonstrated performance - after removing clear outliers, these were good indicators of what is achievable at the mine
> Using Optimistic' OEE - the project team decided on optimistic factors for the OEE levers and calculated the achievable KPI taking cognisance of the technical and physical issues at the mine.
Cost saving calculations
Increase in operating time (improved availability and utilisation)
When a machine achieves more operating hours as a result of improvements, how much cost is saved? This is not merely the hourly operating cost, because the machine did not incur variable costs while it was standing, yet when it operates it incurs that cost. It was determined that the cost saving is the fixed cost portion of the machine's hourly cost. This can be explained by the fact that if a machine is on breakdown or is not operating, it continues to incur fixed cost. In order to do the work, another machine with the same variable and fixed cost has to operate. The total hourly cost is therefore double the fixed cost plus the variable cost, hence when a machine reduces its downtime, the cost saving is its fixed hourly cost.
Increase in productivity
When productivity improves the machine produces more output for the same input. The additional output units (e.g. more tones per hour) therefore do not incur additional cost. The cost saving for productivity improvement is therefore the cost per unit (e.g. rands per ton) multiplied by the additional units produced.
Improvement in quality
Most of the KPIs used to measure quality improvement cannot be converted into monetary value, e.g. MTBF, which is a measure of the quality of maintenance, cannot be converted directly into a cost saving. Another KPI that is closely linked to the quality KPI must be identified to enable the cost saving to be calculated.
For the quality element of Maintenance Reliability in this project, the reduction in hours lost due to equipment breakdowns is used as the KPI for cost-saving calculations.
Action plans and cost of implementation
The improvements required in this exercise were facilitated by a range of action plans. Although some root cause analyses were done to identify the appropriate actions required, most of the actions had previously been identified by the mine's technical teams.
The action plans for each element were listed. Where an action plan supported two or more elements, it was allocated to the element where it would have the largest impact. Table III lists the action plans per element.
The details of the 42 action plans are not discussed in this paper. It must be noted that some of the action plans are large projects in their own right, e.g. 'Rebuild all overdue heavy mining equipment' under Maintenance Reliability. Similarly, the impacts of some of these action plans are significant and span improvement over a number of the elements, e.g. 'Blast fragmentation' under Shovel Loading Rate.
The costs for implementing the action plans were then estimated. These were divided into ongoing operating costs and once-off or capital cost items. Some of the costs were already included in the mine's budget; but for others, either application was made for over-expenditure or the item was included in the next budgeting cycle.
Schedules for action plan implementation
The project was planned to run for 3½ years until the end of 2016. A monthly schedule was then compiled for the implementation of the action plans, depending on:
> Expected impact on improvement
> The complexity (or ease) of implementation
> Availability of funds
> Long lead-time items
> Nature of the action plan (e.g. does it involve new technology?)
> Where applicable, the required sequence of implementation.
With the improvement plans scheduled out, the associated cost savings schedule was determined by estimating realistic KPI improvement targets over time. With this, the costs and expected cost savings per month were calculated on the basis determined earlier. The quantity of the improvement metric per time unit (e.g. reduced hours lost per month due to a reduction in shovel damage) was multiplied by the cost per time unit (e.g. fixed cost portion of the operating cost per hour for shovels) to determine the cost saving during the time period.
Recording and controls
The final step in the project development was to formalize the measurements of KPI and to ensure controls are in place to provide a fully auditable process.
The FMS was the main source of data, although establishing some of its measurements was part of the action items, e.g. the payload measurement on the older Terex trucks. Some of the measurements were verified through the month-end surveys as well as records kept by the engineering planning department.
Controls took a wide variety of forms. The Business Improvement (BI) department uses the measurements for statistical analysis and presents the results in the form of control charts and other graphical displays. Project tracking and controls were put in place to track the implementation of the action plans. The KPI achieved are also reported to the corporate office on a monthly basis, with the cost as well as the savings recorded.
A Project Management Office (PMO) was established at corporate office to ensure a holistic, enterprise-wide approach and appropriate support, focus, coordination, tracking, and delivery of intended benefits. Regular auditing of the project takes place.
Project implementation and progress tracking
Project leaders for each element were appointed. These appointments were crucial to the success of the project and the leaders were carefully selected for their knowledge, experience, seniority, and passion for the job.
The project leaders generated detailed project schedules for the implementation and execution of the action plans for their elements. This led to verification of, and sometimes modifications to, the initial action plans. Detailed costing was also done and adjustments made to the costing schedules where required.
Initially progress meetings were held every second week, chaired by the general manager (GM) and attended by all heads of department on the mine. This gave prominence to the project, provided cross-functional coordination and support, and an opportunity to resolve any implementation hiccups. These meetings continued for several months until the project yielded the expected results.
Some of the action plans were budgeted for and would have been implemented anyway, but most were new in the sense that they were 'launched' by making all role players aware of the plans, the methods of implementation, and the benefits for them as well as the mine as a whole.
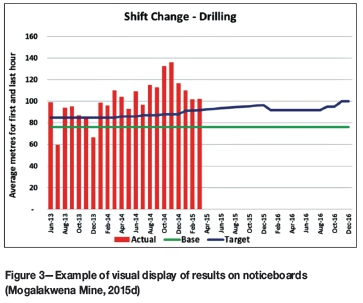
Another method used was a process called 'Rapid Results Projects'. Some of the people on the mine were familiar with it as it had been used with success in the past. The method consists of involving a selected team from all levels in the area of the project, who seeks their own solution to the issue, set their own targets, and drive it themselves under the leadership of a supervisor. The results are measured over a 100-day period, by which time the targets set by the team should have been met.
These results were publicized around the mine with visual displays on large colourful graphs (see Figure 3) and pictures on noticeboards, both electronic and in hard copy.
Results
The project yielded results soon after launch and by the third month it was clear that the mine was on its way to major improvements. In addition to the OEE improvements and reduction in unit costs, the largest benefit was in the behavioural change of the workforce. The previous negative and sometimes destructive attitude changed relative quickly into one of positive self-motivation, and the personnel began to reduce wastage on their own initiative. This was further fuelled by the decent bonuses that people started to earn. The improved morale of the workforce was evident in the reduction in absenteeism, reduced shift change stoppages, and reduction in equipment damage.
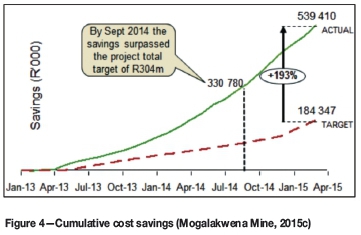
The cost savings were positive from day one and grew continuously as the KPI targets were attained and surpassed. By month 16 (September 2014) the savings targeted for the full project period of 36 months were already achieved!
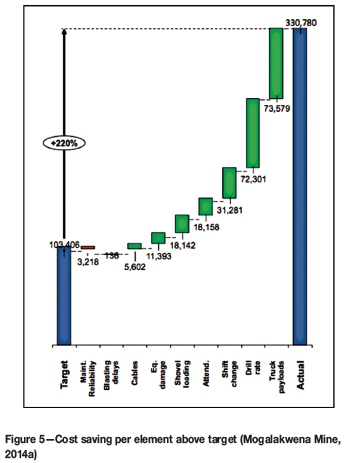
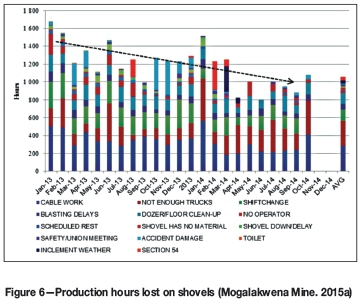
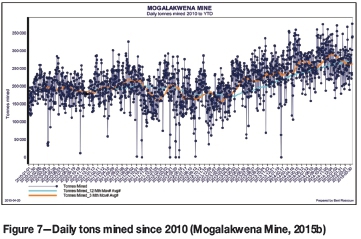
Figures 4 to 7 show some of the results.
Project growth
During the implementation of the project, Anglo American conducted a technical review of all its major mines, including Mogalakwena. The improvement actions from that Asset Review included all eight elements of the Platinum Review and five more elements were added, all enablers for improvement (Figure 8). These were Support Equipment OEE, Supervisor Competencies, Quality Control on Drilling, Blasting, and Loading, and Resource to Market Initiatives.
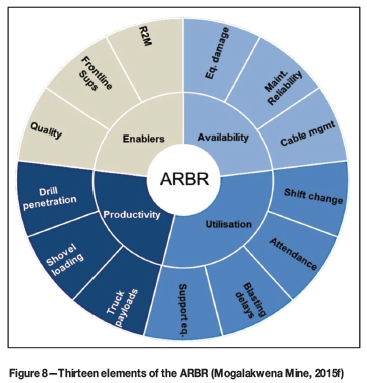
The project name was also changed to the Asset Review Benefit Realisation, or ARBR.
As the project gathered momentum, the supervisors and workers who did not benefit directly from the original eight elements motivated further growth. Drill penetration rate, rope shovel loading rate, and tyre life improvement were all added to the original scope.
The improvement project originally aimed at improving OEE had by then become the all-inclusive improvement drive on the mine, and was the reason for the performance turnaround since Q2, 2013.
Sustainability
To ensure that the improvements obtained in this project are sustainable, the following measures were taken:
> A number of the action plans were directed at improving the measuring and reporting systems at the mine, e.g. the payload measurement and recording system on trucks. The drill quality measurement and recording through the Rockma system is another example. These types of management actions are not dependent on a motivated champion to maintain their existence, but are part of the management and reporting system on the mine
> Management support of the initiative, both at the mine and in the corporate offices, ensured continuous focus on the project
> The monthly reporting and reviews of the progress of the project. This provides a forum to discuss and address any problems or restrictions that arise during the implementation and development of the action plans
> The visual presentation of results at the mine, updated daily, coupled with the bonus payments, certainly maintains the momentum created amongst the workforce
> The evolving of the scope of the project by growing it into other worthy issues keeps the interest alive and helps the identification of further improvement opportunities
> The process allows for continual monitoring of elements that have achieved their final targets for a couple of months, with the focus turned onto those where it is more difficult to achieve the targets. However, when the performance of any of these elements falls below target, they are brought back into the focus area to analyse and rectify the cause of the down-dip. This has happened with blasting delays when the delays increased again after additional precautionary measures were taken following the blasting incident at the mine in March 2015.
Success factors
The improvement initiative was formalized in the company with full management commitment and support on all levels. Management actively engaged in the process to ensure any constraints and obstacles were addressed as soon as practical.
The fact that the Platinum Review was a company-wide formal process, with audits of the savings and improvements reported and regular reporting to the highest level, further supported the success of the project.
The strategy when setting the initial targets was not to beat the world benchmarks or to achieve world best practice in one step, but rather to set achievable targets. There was also a clear understanding that achieving the initial targets was not the end, but growing beyond that would align the mine with its vision 'To be the best PGM mine in the world'.
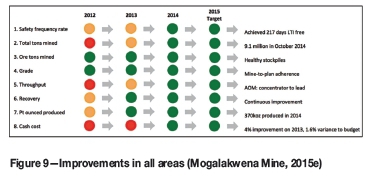
The success of the improvement, supported by the visual displays of the results around the mine, provided for a positive workforce as the self-esteem of individuals increased together with the recognition they received. The resultant healthy bonuses further supported worker motivation.
Figure 9 is a pictorial of the improvements on all fronts of the mining operation.
Conclusion
The OEE improvement project as part of the Platinum Review paved the way for a turn-around in overall performance at Mogalakwena mine. The project focus was not on cost savings, but on OEE improvement, which is fully aligned with the Anglo Operating Model (AOM) by doing the right work at the right time in the right way.
During the project, the mine progressed from an inefficient to an effective operation, and is on its way to becoming efficient in most aspects.
Success breeds success. As the improvements gathered momentum, more people wanted to be part of the process and this resulted in the change from an unmotivated workforce to a highly motivated workforce, as is evident by the fact that the mine did not participate in the five-month industry strike of 2014.
As the mine turned around as a result of the OEE project, the pursuit of improvement caused a ripple effect that encompassed other activities not necessarily related to OEE's. It became the vehicle for success at the mine.
Acknowledgements
The major role that the General Manager and management team of Mogalakwena Mine played in the success of this project is acknowledged.
Mogalakwena mine is also thanked for allowing figures and tables from their management report to be used in this paper, as well as for their assistance in compiling this paper.
References
Anglo American. 2012. Equipment performance metrics. Johannesburg, South Africa. [ Links ]
Anglo American Platinum. 2013a. Final report on Conexus. Johannesburg, South Africa. [ Links ]
Anglo American Platinum. 2013b. KPMG report on Shovel OEE. Johannesburg, South Africa. [ Links ]
Mogalakwena Mine. 2014a. Monthly presentation on AAP24. 6 October. Mokopane, South Africa. [ Links ]
Mogalakwena Mine. 2015a. Month-end review data. 14 December. Mokopane, South Africa. [ Links ]
Mogalakwena Mine. 2015b. Month end review presentation. April. Mokopane, South Africa. [ Links ]
Mogalakwena Mine. 2015c. Monthly presentation on AAP24. March. Mokopane, South Africa. [ Links ]
Mogalakwena Mine. 2015d. Monthly report on AAP24. February. Mokopane, South Africa. [ Links ]
Mogalakwena Mine. 2015e. Presentation to CEO. Mokopane, South Africa. [ Links ]
Mogalakwena Mine. 2015f. Road to Value presentation. Mokopane, South Africa. [ Links ]
Schaffer, R.H. and Ashkenas, R.N. 2005. Rapid Results! How 100-day projects build capacity for large-scale change. 1st edn. Jossey-Bass, San Francisco. [ Links ]

