


Services on Demand
Article
 English (pdf)
 Article in xml format
 Article references
Indicators

Related links
-
 Cited by Google
 -
 Similars in Google
Share

 Permalink
Journal of the Southern African Institute of Mining and Metallurgy
On-line version ISSN 2411-9717
Print version ISSN 2225-6253
J. S. Afr. Inst. Min. Metall. vol.116 n.3 Johannesburg Mar. 2016
http://dx.doi.org/10.17159/2411-9717/2016/v116n3a4
PAPERS - MINE PLANNING AND EQUIPAMENT SELECTION (MPES)
Impact of the South African mineral resource royalty on cut-off grades for narrow, tabular Witwatersrand gold deposits
C. Birch
School of Mining Engineering, University of the Witwatesrand, Johannesburg
SYNOPSIS
A mineral resource royalty is payment to the holder of mineral rights for the utilization of the mineral resource. In South Africa, this payment is made to the State as holder of the mineral rights (The Mineral and Petroleum Resources Royalty Act of 2008). The principle purpose of this research paper is to identify if the State is benefitting from the mineral resource royalty by considering its impact on seven individual Witwatersrand gold mines.
For this study, a simple financial optimiser model was created in Microsoft Excel that links the ore flow, block listing and the cash flow (excluding or including the cost of the mineral resource royalty). Mixed integer linear programing (the Excel Solver function) is utilised to optimise either profit or NPV (at 9% and 12%) by adjusting the cut-off grade.
The impact on each of the seven mines mine was different but overall R7.9 billion is estimated to be paid in mineral resource royalty over their expectedremaining lives. Due to the cost of the mineral resource royalty andincreasing the cut-off grades, the total revenue decreases by R10 billion. Asignificant portion of this lost revenue would have been paid to the State inthe forms of other taxation including company income tax which decreasesby R2.8 billion. It is recommended that an industry wide investigation beconducted to determine if the resource royalty is adding to the State'srevenue, or destroying value including premature job losses.
Keywords: Mineral and Petroleum Resources Royalty Act of 2008, cut-off grade, optimization, net present value (NPV), mixed integer linear programing, excel solver.
Introduction
Taxation of mining companies has become a very topical subject in the context of the post-apartheid South African economy. There have been increasing calls for equitable re-distribution of mineral asset wealth for the benefit of all South African citizens and not just to an elite few. As part of the Mineral and Petroleum Resources Development Act (MRDPA) of 2002, the Mineral and Petroleum Resources Royalty Act of 2008 was introduced and came into effect in 2010 (South African Revenue Services, 2008). A mineral royalty is payment to the holder of mineral rights for the utilization of the mineral resource. In the case where the holder of the mineral right is the State, then this payment is made to the State (Cawood, 1999). Studies on the potential impact of the mineral resource royalty on the minerals industry have been conducted during the formulation of the Act and subesquently. These include Cawood and Macfarlane (2003), who suggested a cap of no more than 3% (Cawood and Macfarlane, 2003), as well as Cawood (2011), who predicted rising cut-off grades and thus reducing mineral reserves. In 2013, Grobler completed a Masters in the Faculty of Economic and Management Sciences at the University of Pretoria and concluded that the impact of the mineral resource royalty on the economy is positive. She stated that the royalty has caused operating expenses to increase, but this does not appear to be significant. Furthermore, she stated that the royalty has not affected the way the mining industry operates (Grobler, 2014).
If the mineral resource royalty was levied only on profit, then it could be ignored for cut-off grade purposes, as is the case for income tax. However, due to the fact it is levied on total sales, it should be considered a cost and be taken into account in determining the cut-off grade (Hall, 2014). Mines use the cut-off grade to indicate what is considered ore and what is waste. An increase in cut-off grade due to an increase in costs (including the mineral resource royalty) leads to a reduction of available mineral reserves above the calculated cut-off grade. The purpose of this study is to consider how the cost of the mineral resource royalty has increased cut-off grades at a selection of mines, and determine the impact on overall revenue generated for the State. This study differs from previous studies found during the literature review in that a selection of individual mines is considered, and the impact on their individual orebodies is determined. Each orebody has a unique grade distribution and thus it is expected that this will result in differences in how the economics of the orebody are impacted by the additional costs associated with the mineral resource royalty.
The impact of income tax (gold tax formula) and royalty payments on the life-of-mine and how much of the resource is converted into reserve as a function of the economic benefit will be considered. There is an increasing demand for mining companies to address the social and cultural needs of the communities within which they operate. All stakeholders benefit if mines utilize the full potential of the orebody. In the State Intervention into the Mining Sector (SIMS) document, the ANC indicated that the State should be allowed a greater portion of the profits ('supertax or windfall tax') (ANC, 2012) and indicated that the resource royalties tax in its current form is not achieving this. The SIMS document (released in June 2012) called for reviews of how the State receives revenue from the mining sector. There could thus be changes in the future as to how the mineral resource royalty is structured. However, this study is focused on the tax in its current form, and how it affects mine planning and investment decisions.
There are two forms of taxation that will be considered for this study: income tax (in the form of gold tax for gold mines) (South African Revenue Services, 2011) and the mineral resource royalty (Republic of South Africa, 2008). The gold taxes, as well as the mineral resource royalty, both have sliding scales based on the profitability of the operation. In periods with higher profitability, the structure of these taxes result in a higher percentage of the revenue generated being paid to the State. The difference in the two forms of tax is on what they are levied. Income tax is paid as a percentage of the profit, while the mineral resource royalty is paid on total gold sales revenue. These two taxes address the issue that the State has raised concerning not receiving a higher portion of the revenue in times when commodity prices are high. The standard rate of income tax for other commodities does not allow for this, or protect the operations in times of low commodity prices.
Research background and context
The mining companies that the study focused on operate mines that exploit the narrow, tabular mineral deposits that characterize the gold mines of South Africa. These gold operations include AngloGold Ashanti (the Carletonville and Klerksdorp regions), Sibanye Gold (Carletonville and Free State operations), Harmony Gold (Carletonville, Klerksdorp, and Free State operations) and Gold One (Evander, Randfontein, and Far East Rand operations). For this study, a number of individual mine block listings were selected, together with their corresponding ore flow and financial planning figures.
Mining companies calculate a cut-off grade to determine the portion of the mineral deposit that can be mined economically. This cut-off grade takes into account the forecast price of the commodity, the expected mine recovery factor, the cost to mine the ore and extract the commodity, as well as the fixed costs for the mine. By using the planned extraction rate, expected recovery factor, and total mineral extraction and sales costs, the variable factor in the break-even grade calculation then becomes the in situ grade of the material being sold. As long as the grade is higher than the breakeven grade in a particular block being mined, the block will be mined profitably. The mining companies that were investigated apply these basic calculations in different forms, but generally use their chosen method to optimize the profit from their operations.
The starting point for the model created for this study is the block listing. This is created from the geological model and is a list of all the potential mining areas, their estimated grades, and volumes. Figure 1 shows a typical tabular gold deposit grade-tonnage curve based on a block model for Mine A used in the study.
Mining companies are approaching the question of mineral resource royalty costs and its impact on the cut-off grade in six possible ways. These are:
> Ignore the implications and continue calculating the cut-off grade in the way it was done prior to the introduction of the tax
> Use the minimum rate (0.5%)
> Estimate the expected rate that will be applied by looking at the historical rate
> Estimate the expected rate by modelling the optimized cash flow based on the break-even grade, and then determine the expected rate and use that as an additional cost for break-even grade calculations
> Assume that the highest rate will be applied, depending on whether the mine is applying the refined (5%) or unrefined (7%) rate
> Use some sort of profitability optimization equation that applies a variable rate depending on the profitability, and determine if there is a higher profit to be made even if the profitability rate is lower.
Cut-off grade calculations
According to the SAMREC Code, Mineral Reserves are that portion of the mineral resource that is valuable, and legally, economically, and technically feasible to extract (SAMREC, 2009). The commonly accepted method for determining if material forms part of the Mineral Reserve is thus to calculate the cut-off grade at the current economic conditions. Only material above this grade is then considered to have economic value and included in the mine plan. The material with a grade lower than the cut-off remains in the Resource; although with rising commodity prices and/or lower mining costs it may at a later time be included in the Mineral Reserve. The basics of the cut-off grade theory are described in Lane's 'The Economic Definition of Ore' and most researchers use this book as the basis for their models (Lane, 1988). Lane describes the economic principles of how cut-off grades are derived and also how cut-off grades can be optimized at various stages of a mine's life. Minnitt (2003) looked at how Lane's cut-off grade calculations were being adapted to Wits-type gold mines in, and found that the application of the net present value (NPV) criterion for determining and optimizing value in mining operations was limited. He considered NPVs at various points in the value chain (mining, processing, and marketing) to determine a balanced cut-off grade. Both Lane and Minnitt consider the NPV calculated over the life-of-mine rather than short-term profitability as the primary measure of value. The model created for this study simplifies these dynamic and balanced cut-off grades into a single process using the block listing as the starting point.
'Cut-off Grades and Optimising the Strategic Mine Plan' by Hall (2014) is a comprehensive study of the various techniques currently used in the mining industry. It includes various measures of value including optimizing the discounted cash flow DCF and NPV.
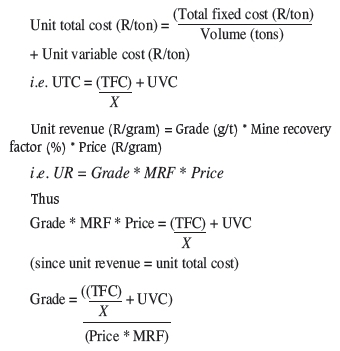
The cut-off grade calculation is essentially very simple. It determines the grade required for a unit of ore to return a profit. It is essentially a break-even volume calculation where the volume is known (usually limited due to shaft capacity, mill capacity, or some other physical constraint), and the unknown is the in situ grade of the commodity. The other parameters required are total fixed cost and unit variable cost. From these the total unit cost can be obtained (typically expressed in rands per ton). The other factor required for the cut-off grade calculation is the mine recovery factor (MRF), which is the mine call factor (MCF), multiplied by the plant call factor (PCF). The commodity price in rands per gram is obtained from the commodity price in US dollars (usually quoted per troy ounce for gold and platinum) and the exchange rate. These are all estimates and subject to variation throughout the period in which the cut-off grade is to be used, and thus add to the financial risk to the investors if they change significantly. This can be expressed as follows:
The costs that are included in the cut-off grade calculation are subject to much debate and often change through the life of the project. While a company is still recovering the initial capital costs, a budget cut-off grade can be used. This will include the costs as well as an additional percentage to recover the initial capital costs quickly. In the final stages of the mine, development costs are minimal and certain areas can be mined that were previously considered below cut-off grade. This is called a marginal cut-off grade (Lane, 1988).
Companies can use some sort of 'optimizer' program that utilizes the block listing, as well as the basic inputs, to calculate the cut-off grade. The grade-tonnage curve is then automatically generated - indicating how much material is available above the cut-off grade. The average mining grade (AMG) is also then obtained. This is the average grade of the material above the cut-off grade and becomes the planning grade.
Harmony Gold Mining Company uses an in-house 'optimizer' for calculating the cut-off grade for all their narrow tabular orebodies (Harmony Gold Mining Company, 2001). This optimizer was also created in Visual Basic and Excel. The author is familiar with this optimizer and has used it extensively. The optimizer requires the following as inputs to calculate the cut-off grade:
> The block listing with the measured resource blocks (per shaft section and per reef being evaluated)
> An assumed gold price
> Planned production rates
> Planned working costs (rands per ton)
> The mine recovery factor (MRF), which is equivalent to the mine call factor multiplied by the plant recovery factor.
Harmony has been using their optimizer program for approximately 15 years, and it is based on work done previously by one of their geologists in classifying the orebody and determining a profit-optimized cut-off grade.
Optimizing on NPV can drive decision-making to focus on the short-term gains at the expense of the longer term, and thus companies often use the total undiscounted cash flow (Hall, 2014). The discount rate used for the calculation of the DCF and resultant NPV is critical to the cut-off grade calculation. For this study, costs and income parameters were kept constant and a real discount rate of 12% was used for the NPV optimizer model as this is near the upper limit for typical South African mining companies (Smith et al., 2007). This figure was chosen to emphasize the expected differences between the non-discounted cut-off grade and the NPV-optimized cut-off grades and resultant mineable reserves.
Resource royalty and income tax calculations
Mineral resource royalty
The introduction of the mineral resource royalty has increased costs as it is payable on the total revenue from the sale of the commodity, not just on the profits generated by the sales. This leads to increased mining risk, because even if the mine makes a loss, there is still a payment due to the State. The calculation of the mineral resource royalty is as follows:
Refined Royalty Rate Y(r)
Y(r) = 0.5 + X/12.5
where X is Earnings Before Interest and Tax (EBIT)/ (aggregate gross sales)
Unrefined Royalty Rate Y(u)
Y(u) = 0.5 + X/9.0
where X is EBIT/(aggregate gross sales).
The difference between the refined and unrefined rates was introduced to encourage companies to beneficiate the commodities. These formulae take the profitability of the company into account when calculating the rate payable, with highly profitable companies paying a higher rate (Republic of South Africa, 2008). There is thus scope for optimizing the cut-off grade by considering how these formulae vary with changes in profitability.
Gold tax formula
Gold mining companies pay income tax based on the gold tax formula with the following formula:
Y(%) = 34-170/X + 10% dividends tax
where X is the profit / revenue ratio expressed as a percentage.
The gold tax is only paid on the taxable profits of the mining company and excludes non-mining income (South African Revenue Services, 2011) and is generally well understood by the various mining companies. The tax also has an element of variation due to the profitability, and this was considered together with the mineral resource royalty when optimizing the cut-off calculations.
A good tax should not disturb economic behaviour and thus should be neutral (Mangondo, 2006). Income tax is calculated on profits and therefore does not alter economic behaviour as making a profit is considered a primary objective of any mining business. The mineral resource royalty is not considered neutral because the implementation of the tax alters the cut-off grade calculation and influences the portion of the orebody that can be considered economically viable.
Modelling exercise
For this study, a model has been developed that calculates the break-even cut-off grade value of the orebody. This is then run through an Excel optimizer model excluding the cost of the mineral resource royalty. The resultant profitability percentage (earnings before interest and tax/ divided by total revenue), dictates the rate applicable for the mineral resource royalty. The cost of the mineral resource royalty is determined from the applicable formula and converted into a cost per ton. This is then added onto the direct mining cost and the revised cut-off grade is determined. The resultant differences in the two cash flows can be compared to determine the impact of the mineral resource royalty on overall mine income, income tax, and costs, which could lead to further sources of revenue generation for the State (including direct taxes like employee income tax as well as secondary taxes like value-added tax on supplies, customs duties, dividend taxes, exercise duties, Social and Labour Plan contributions, skills development levy, and fuel levies). It has been estimated that in 2009, 25% of tax revenue came from direct company income taxes, 30% from personal income tax, and the balance from these other revenue streams (Cawood, 2011). The model was then re-run to optimize using the DCF and resultant NPV in the cut-off grade calculation. A 12% cost of capital was used for this exercise and the results obtained as in the previous method, which optimized on basic profit not considering the time value of money.
Break-even grade calculation
The break-even grade calculation is very simplistic. It just considers direct mining costs. The MRF is utilized and consideration is given to the additional waste tons that are milled (expected dilution like gullies, historical discrepancies, and waste development hoisted as reef). It is possible to depict a grade-profit curve. Where the profit peaks, the grade at this point is the cut-off grade. This relationship is shown in Figure 2.
For the case study, a gold price of R420 per gram was used (US$1136 per ounce with R11.5 per US dollar. The total costs for the mines (including corporate costs) as well the direct mining costs are the based on figures supplied by the mines and used in the 2015 planning cycle for break-even grade determination. The mining costs are based on mining/milling figures and are assumed to represent an optimal rate of mining considering constraints for each individual operation included in the study. The MRF used is based on the previous 12 months' ore flow figures, as well as the historical PCF. This break-even grade is calculated independent of the block listing.
The break-even grade was calculated excluding as well as including the estimated cost of the mineral resource royalty. The cost of the mineral resource royalty was estimated by inserting the break-even cut-off grade into the model and determining the expected rate. This was then applied to the total sales value and thus the cost per ton of the mineral resource royalty was determined.
Optimizing models
A more advanced method for determining the cut-off grade is to use the block listing for each individual orebody. The block listing contains gold grades in grams per ton (g/t) or centimetre-grams per ton (cmgt), the channel width, stoping width, and area of the blocks. From the area and specific gravity, the tons can be determined for each individual block. The ratio of tonnage from stope faces compared to all the tonnage milled is determined from a simple ore flow. This ore flow considers face tonnage, gully dilution and other sources of dilution, historical discrepancies, and how much development waste will be hoisted and milled with the ore. The ore flow also uses the historical MCF and PRF to calculate the planned MRF for use in the financial model. Revenue is derived from the recovered gold, the planned gold price, and the expected exchange rates. The mining costs can be estimated considering the fixed and variable costs for the mine and the expected production rate, and the resultant profit for each block can be determined.
Two methods were considered for cut-off grade optimization to maximize the profit as well as the NPV. They both utilize the Solver function built into Microsoft Excel (Meissner and Nguyen, 2014). The variable for the Solver function is the cut-off grade, and the Solver function is set up to optimize the cut-off grade to maximize either the resultant profit or NPV from the cash flow. The financial model was limited to a maximum of 20 years. Due to the discounting, income after 20 years has very little impact on the overall NPV.
For the profit model, the Excel Solver function is used to determine the optimal cut-off grade by varying the cut-off grade to maximize the profit. Only the blocks above this resultant cut-off grade are mined. The AMG is determined and this grade is then used in the financial planning. The cut-offs obtained using this method are almost identical to those obtained using the break-even method. Using this method, there is no consideration given for the time value of money, cost of capital, discount rates, or NPV. The model was run both including and excluding the costs determined from the break-even calculation for the mineral royalty resource tax. This allowed comparisons to be made for total revenue, total costs, mineral resource royalty and income tax (gold formula) payments, profit, and life of mine.
To calculate a DCF, a discount rate is required. This discount rate is essentially the cost of capital and it is usually calculated by the weighted average cost of capital (WACC). This essentially considers all the sources of capital required for a project (equity and debt), the portion of the total each source comprises, and its cost. The various sources are then weighted by their proportion and an average is calculated. A risk factor can be added to the WACC to account for uncertainties in the plan and ensure a positive NPV, even if the plan is not achieved.
According to Smith et al. (2007), real discount rates of 912% for mining projects are appropriate for South African mining projects. This is equivalent to 14.5-17.6% at a 5% annual inflation rate for WACC in nominal terms. For this study, 12% was used for the real cash flows.
Like the profit model, the NPV model considers the total face tonnage available as well as the AMG for the blocks above cut-off grade. The total planned milled tonnage is considered a fixed amount determined considering the constraints on the shaft. The other assumption is that the mix of mining areas will be the AMG, and thus the mined grade for the financial model is this grade.
The NPV is calculated by applying the selected discount rate to obtain the DCF for each year, and adding these together. The model then runs through a series of cut-off grades, with the resultant AMG and available tons being determined for each cut-off. Solver then selects the cut-off grade that results in the highest NPV.
Results
Two exercises were conducted. The first exercise involved a single mine and determining the impact on the cut-off grade and resultant AMG, total income and costs, income tax, and mineral resource royalty. Just the profit optimizer model was used as the exercise was run to determine the impact of profitability on the above measures. The second exercise followed the same methodology, but different mines were selected with their current planning parameters and financial forecasts.
Exercise 1
Figure 3 shows the difference between the break-even grades as the profitability decreases, resulting in the mineral resource royalty rate to decreasing from 5% to 0.5%.
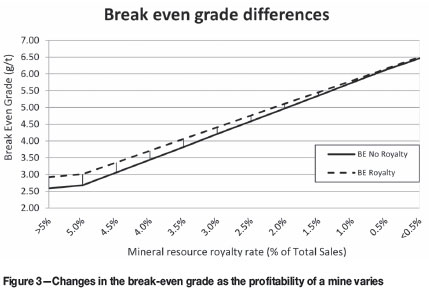
As can be observed for this particular mine, the difference between the break-even grade when royalties are added compared to when they are ignored is approximately 0.4 g/t when profitability is high, and 0 g/t when profitability is low.
Figure 4 shows the differences in revenue the State will receive in direct taxes from the mine with or without mineral resource royalty included as the profitability and resultant mineral resource royalty varies.
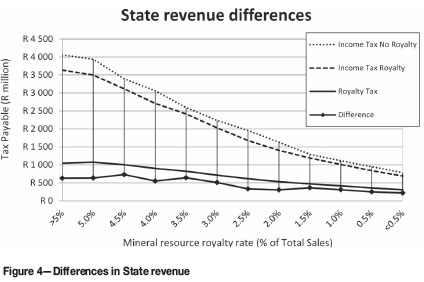
From Figure 4, the inclusion of the mineral resource royalty lowers the income tax as it is a tax-deductible cost. The gold tax formula is based on profitability, and the rate for the tax also changes (unlike for other commodities, which are paid at the constant corporate rate of 28%). The difference in State revenue when mineral resource royalty is included is highest when the mine is very profitable. For this mine, the difference in overall direct tax is R730 million, dropping to less than R250 million as the mine becomes very marginal.
Figure 5 shows the differences in gross sales (total revenue) for the mine as the profitability varies.
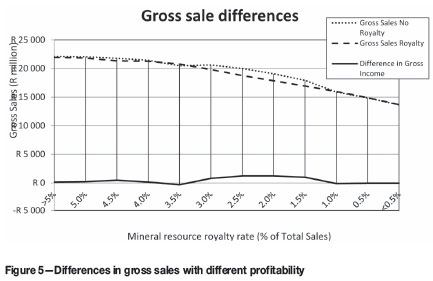
From Figure 5, if the mine is very profitable or very marginal, there is little difference in total production of gold. However, if the mine is being taxed between 1.5% and 3.0% mineral resource royalty, there is a significant drop in total revenue. This varies between R790 million and R1 220 million for this range.
Exercise 2
Figures 6, 7, and 8 show the differences in break-even grade, profit-optimized cut-off grade, and NPV-optimized cut-off grade for seven different Witwatersrand-type gold mines. The discount rate used in the NPV model is 12%.
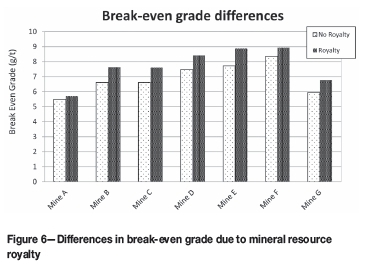
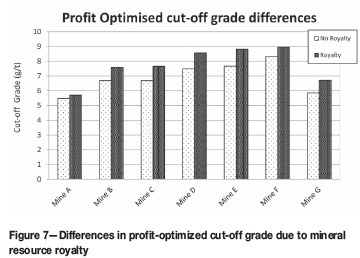
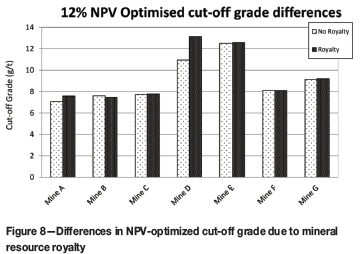
From Figures 6 and 7 the break-even grade and profit-optimized cut-off grades are essentially the same. There is generally approximately a 1 g/t difference between the cut-off grade including mineral resource royalty and excluding mineral resource royalty. For Mine A, however, the difference is just 0.2 g/t, while for Mine D this is 1.2 g/t. There is generally a far closer match between the cut-off grades for the NPV-optimized model. However, it can be observed that for Mine D there is a difference of over 2 g/t in the two grades.
The impact that modelling for NPV has on cut-off grades generally is noticeable when comparing the break-even and profit-optimized model grades to those obtained with the NPV model. This is due to the model selecting higher grades to increase income in the early years of the cash flow, where the discount effect is less pronounced.
Tables I and II show the taxation differences when the mineral resource royalty is included or excluded using the profit and NPV models respectively.
It can be observed that excluding the mineral resource royalty generally results in less revenue to the State if only direct taxes are considered. The difference is, however, less than just the removal of the mineral resource royalty amounts. This is a function of the formula for gold tax, which is also variable on profitability. The mineral resource royalty figure is considered an income tax-deductible amount. When the mineral resource royalty is included, this results in a lower rate being applied, not a fixed rate like with other mines and companies. One noticeable exception in these sets of figures is for Mine F. When modelled using the profit optimizing model, the result is that excluding mineral resource royalty actually leads to an increase in revenue payable to the State in direct taxes.
Tables III and IV compare the gross sales, costs, and life-of-mine for the mines using both the profit- and NPV-optimized models.
These tables display how including mineral resource royalties generally leads to a drop in total gold revenue. This is more pronounced when optimizing for profit than when optimizing for NPV. The differences in total costs is where the State loses the opportunity to levy further revenue, including personal income tax on mine employees, value-added tax on supplies, customs duties, dividend taxes, exercise duties, Social and Labour Plan contributions, skills development levy, and fuel levies. Considering that only 25% of total State revenue comes from direct company taxes, the loss of income generation opportunities to the State due to the reduction in mine spending could far outweigh the income from the mineral resource royalty.
The differences in the life-of-mine figure, including or excluding mineral resource royalty, are more pronounced with the profit-optimized model. Using the NPV-optimized model lowers the life-of-mine compared with the profit-optimized model, and adding the costs of the mineral resource royalty has a less of an impact.
The reductions noted in life-of-mine, gross sales, costs, profit, and NPV between the different mines as shown in Tables I to IV are not consistent. Each mine is affected by the mineral resource royalty in a different way, even though the same methodology for the modelling has been kept consistent for the exercises. This is due to differences in grade distributions in the orebodies, direct mining costs, indirect costs, and variances in the ore flows. Figures 9 and 10 show grade-tonnage curves for Mines C and G.
Mines C and G are neighbouring mines with similar depths and mining costs. The break-even grades, excluding and including the mineral resource royalty respectively, are 6.62 g/t and 7.63 g/t for Mine C and 5.94 g/t and 6.78 g/t for Mine G. The cost of the mineral resource royalty has a greater impact on the break-even grade for Mine C (1.01 g/t vs 0.84 g/t). It can be seen by comparing the two graphs that the impact of including the costs for the mineral resource royalty has a far greater impact on the AMG, as well as tons above cut-off grade, for Mine G than for Mine C. The these different grade-tonnage curve shapes demonstrate that adding the costs of the mineral resource royalty into the cut-off grade for Mine C results in a drop of 10% in gross sales, while for Mine G this drop is 21%.
Conclusions
The mineral resource royalty introduced in 2010 has an effect on mineral reserves. Since the royalty is paid on total mineral sale revenue, it is considered as an additional cost. This then causes the break-even grade to increase, and reduces the tons above this grade that can be economically mined.
In the first part of the study, a single mine was selected and the block list run through an optimizer model developed for this purpose. The optimizer uses the Solver function in Excel to vary the cut-off grade and determine the optimal cut-off grade to ensure either maximum profit or maximum NPV.
The result of this exercise showed that the impact of the mineral resource royalty is greater on mines that have higher profitability if just considering the differences in cut-off grade. The largest impact on gross sales (due to reducing the life-of-mine), however, was noted when the profitability of the mine was less, resulting in mineral resource royalty rates between 1.5-3%. For very marginal mines, the sliding scale of the mineral resource royalty results in little change to the overall financials of the mine as it is a constant 0.5% of gross sales revenue.
The second exercise compared seven currently operating gold mines. The mines have different grade-tonnage curves and the effect of mineral resource royalty differs for each one. Changes in cut-off grade varied from 0.2 g/t to 1.2 g/t. The increased direct revenue payable to the State in most cases was largely offset by reduced taxation opportunities due to lower mineable reserves and reduced mine life. The impact was generally greater when the mines were optimized for profit rather than for NPV, which already reduces the life-of-mine significantly due to high-grading the orebody.
This study has shown that although the tax is meant to protect marginal mines from early closure, mines with higher profitability are negatively affected and the additional costs can reduce the life significantly. The expectations of the State to receive additional revenue from the mines are satisfied in the short term. However, when considering the income generation capacity from other taxation forms over the life of the mine, this revenue is likely to be less than expected. Considering the total impact for these seven mines, the profit-optimized model indicates that R7.9 billion is likely to be paid in mineral resource royalty. Income tax decreases by R2.8 billion, and thus the State gains R5.1 billion in direct tax. The difference in total gross sales decreases by R10 billion. Additional tax revenue to the State decreases by R3.5 billion. A significant portion of this amount would have been paid to the State in the form of other taxation. On deep-level gold mines, labour costs represent more than 50% of total costs. The loss of earnings to mine employees due to the mineral resource royalty for these seven mines is estimated to be R1.75 billion.
Recommendations
A complete study should be conducted across all the mines to establish the impact of the introduction of the mineral resource royalty on the industry. The income tax on profits of gold mines is calculated differently from mines producing other commodities, and this reduces the impact of the mineral resource royalty on the mineral reserves compared with taxation on the fixed 28% rate.
Each orebody is unique, and studies to establish the industry-wide impact of the introduction of the mineral resource royalty should take this into account, rather than looking at just industry-wide averages. The impact on some mines could be minimal, while the impact on others could be very significant. The results of a full study should be considered in the light of declining mining revenues and expected continuing job losses. This could then be used to guide future policy changes as proposed in the SIMS document (ANC, 2012).
References
ANC. 2012. Maximising the developmental impact of the people's mineral assets: state intervention in the minerals sector (SIMS). http://anc.org.za/docs/discus/2012/sims.pdf [Accessed 4 March 2013]. [ Links ]
Cawood, F.T. and Macfarlane, A.S. 2003. The Mineral and Petroleum Royalty Bill - Report to National Treasury. Journal of the South African Institute of Mining and Metallurgy, vol. 103, no. 4. pp. 213-232. [ Links ]
Cawood, F.T. 1999. Determining the optimal rent for South African mineral resources. PhD thesis, University of the Witwatersrand, Johannesburg. [ Links ]
Cawood, F.T. 2011. An investigation of the potential impact of the new South African Mineral and Petroleum Resources Royalty Act. Journal of the Southern African Institute of Mining and Metallurgy, vol. 111, no. 7. pp. 443-453. [ Links ]
Grobler, J. 2014. Mineral and Petroleum Resources Royalty Act: the impact on the fiscal and mining industry in South Africa. MCom thesis, University of Pretoria. [ Links ]
Hall, B. 2014. Cut-off Grades and Optimising the Strategic Mine Plan. Spectrum Series no. 20. Australasian Institute of Mining and Metallurgy, Carlton, Victoria, Australia. [ Links ]
Harmony Gold Mining Company, 2001. Investor Reporting - Annual Reports. http://www.harmony.co.za/assets/investors/reporting/annual-reports/2001/section2/page29a.htm [Accessed November 2014]. [ Links ]
Lane, K.F. 1988. The Economic Definition of Ore. Mining Journal Books Limited, London. [ Links ]
Mangondo, K. 2006. The economics of gold mining taxation. MCom thesis, University of South Africa, Pretoria. [ Links ]
Meissner, J. and Nguyen, T. 2014. Meiss Research Group. An Introduction to Spreadsheet Optimization Using Excel Solver. http://www.meiss.com/download/Spreadsheet-Optimization-Solver.pdf [Accessed 2 December 2014]. [ Links ]
Minnitt, R. 2003. Cut-off grade determination for the maximum vale of a small Wits-type gold mining operation. APCOM 2003. Proceedings of the 31st International Conference on Application of Computers and Operations Research in the Minerals Industries, Cape Town, 14-16 May 2003. South African Institute of Mining and Metallurgy, Johannesburg. pp. 415-422. [ Links ]
Oklahoma Policy Institute. 2014. Characteristics of an Effective Tax System. http://okpolicy.org/resources/online-budget-guide/revenues/an-overview-of-our-tax-system/characteristics-of-an-effective-tax-system [Accessed December 2014]. [ Links ]
Republic of South Africa. 2008. Mineral and Petroleum Resources Royalty Act 2008. http://www.info.gov.za/view/DownloadFi^eAction?id=92824 [Accessed 4 March 2013]. [ Links ]
SAMREC. 2009. South African Mineral Resource Committee. The South African Code for Reporting of Exploration Results, Mineral Resources and Mineral Reserves (the SAMREC Code). 2007 Edition as amended July 2009. http://www.samcode.co.za/downloads/SAMREC2009.pdf [Accessed 4 March 2013]. [ Links ]
Smith, G.L., Pearson-Taylor, J., Anderson, D.C., and Marsh, A.M. 2007. Project valuation, capital investment and strategic alignment-tools and techniques at Anglo Platinum. Journal of the Southern African Institute of Mining and Metallurgy, vol. 107, no. 1. pp. 67-74. [ Links ]
South African Revenue Services. 2011. Guide for tax rates/duties/levies (2010/11 and prior years). http://www.wvdw.co.za/wvdwcorporate/TaxRatesDutiesLevies201011andprior9November2010[1].pdf [Accessed 4 March 2013]. [ Links ]
South African Revenue Services. 2008. Mineral and Petroleum Resources Royalty Act 2008. http://www.sars.gov.za/TaxTypes/MPRR/Pages/default.aspx [Accessed 24 July 2015]. [ Links ]

