


Services on Demand
Article
 English (pdf)
 Article in xml format
 Article references
Indicators

Related links
-
 Cited by Google
 -
 Similars in Google
Share

 Permalink
Journal of the Southern African Institute of Mining and Metallurgy
On-line version ISSN 2411-9717
Print version ISSN 2225-6253
J. S. Afr. Inst. Min. Metall. vol.116 n.3 Johannesburg Mar. 2016
http://dx.doi.org/10.17159/2411-9717/2016/v116n3a1
PAPERS - MINE PLANNING AND EQUIPAMENT SELECTION (MPES)
Estimating cost of equity in project discount rates: comparison of the Capital Asset Pricing Model and Gordon's Wealth Growth Model
A.S. Nhleko; C. Musingwini
School of Mining Engineering, University of the Witwatersrand, Johannesburg, South Africa
SYNOPSIS
Since the Global Financial Crisis (GFC) in mid-2008, capital has been more difficult to access. Mining projects must contend with projects from other industries for scarce capital. A decision to invest available capital in mineral projects requires that valuation be conducted to assess the expected return on the projects. The discounted cash flow (DCF) analysis is generally applied for the valuation of mining projects, whereby future cash flows are discounted to present value using an appropriate discount rate. The discount rate significantly affects the outcome of a valuation. Economic and finance theory provides tools to calculate discount rates. The discount rate must account for factors such as the risk and stage of development of the mineral project; hence the appropriate discount rate to utilize in a project is often a subject of debate.
The discount rate is the weighted sum of the cost of debt and equity. There are several methods for determining the cost of equity. This study considers the commonly applied Capital Asset Pricing Model (CAPM) and Gordon's Wealth Growth Model because of their simplicity and availability of parameters required to estimate the cost of equity. This study explores how differences in the cost of equity obtained by these two methods can be explained for a mining environment. Data for empirical analysis were collected from the I-Net Bridge, McGregor BFA, and Bloomberg databases. It was found that Gordon's Wealth Growth Model provides better estimates of the cost of equity compared to the CAPM under depressed market conditions. Therefore, this research recommends that Gordon's Wealth Growth Model be used to estimate the discount rates for mining projects during periods of depressed market conditions.
Keywords: Capital Asset Pricing Model, Gordon's Wealth Growth Model, discount rate, cost of equity, mining projects.
Introduction
Ever since the Global Financial Crisis (GFC) in mid-2008, investment capital for mining projects has been a scarce resource as mining companies have to compete with projects from other sectors (Njowa et al., 2013) while markets remain depressed. It is imperative that valuation of mining projects is treated with caution as decisions to invest in mineral projects are based on the expected return derived from valuations. The discounted cash flow (DCF) analysis is commonly accepted as the principal method for valuing mining projects (Park and Matunhire, 2011; Smith et al., 2007; Janisch, 1976). In DCF analysis, an appropriate discount rate is applied to discount future cash flows to present value. The discount rate is important because it significantly impacts the outcome of a valuation. Economic and finance theory provides valuable tools to calculate discount rates. However, there is often uncertainty on an appropriate discount rate to apply to a project, as the discount rate must account for such factors as the risk and stage of development of the mineral project. The Weighted Average Cost of Capital (WACC) is the discount rate that is used for cash flows with risk profiles similar to that of the overall company. The WACC is the average after-tax cost of capital, which is computed as the weighted sum of the cost of debt and equity. The cost of debt is derived from the interest rate adjusted for the tax rate, normally fixed for the length of the loan. The cost of equity can be calculated using the commonly applied Capital Asset Pricing Model (CAPM) or Gordon's Wealth Growth Model, even though there are other less commonly used methods such as the Arbitrage Pricing Theory (APT).
The cost of equity is defined as the expected return on an asset's common stock in capital markets (Witmer and Zorn, 2007). There is a risk that the investor may not receive the expected return; therefore, investors are expected to take the risk of the investment into account when determining the returns they want to receive. There is a relationship between risk and expected return on a stock; the greater the risk, the greater the expected return on investment the investor expects (Fehr, 2010).
It is vital, then, that a proper analysis of a stock is done in order to determine its true value and forecast future returns. According to Witmer and Zorn (2007), estimating the cost of equity is not a straightforward exercise; different assumptions and methods result in different answers. Hence, this study undertook an analysis of the cost of equity estimation by comparing the commonly applied CAPM and the Gordon's Wealth Growth Model.
The CAPM relies on historical data to estimate the beta (β)value, which is used to calculate forward-looking returns. This process is based on the premise that past performance of an entity is a good estimator of expected future returns. However, this proposition is not entirely correct because there are periods in the past where unexpected returns were realized due to events not captured by the β-value. Therefore, unreliability in estimated β-values results in the need to explore the use of forward-looking models such as Gordon's Wealth Growth Model in estimating a more appropriate figure for the cost of equity.
Gordon's Wealth Growth Model is based on the principle that dividends grow at a constant rate to perpetuity. It is difficult to realize this proposition because of volatility in earnings and uncertainty in estimates of expected inflation and real growth in the economy (Stowe et al., 2007; Damodaran, 2002).
The assumptions upon which the CAPM and Gordon's Wealth Growth Model are based may result in difficulty when applied to real investment problems. Consequently, caution must be exerted to appreciate the constraints of the underlying assumptions. This raises the question: 'How can differences in the cost of equity obtained by these two methods be explained in a mining environment!' Selection of an appropriate discount rate is central to an accurate and valid assessment of the value of any mineral project. The discount rate is applied to cash flows in estimating the present value of an asset and is used as the rate of return for an investment. A discount rate that is lower than the true rate will overvalue the project, resulting in the commissioning of an uneconomic project. A discount rate that is higher than the true rate will undervalue the project, resulting in the rejection of a financially viable project. For this reason, it is essential to estimate the discount rate as close to the true discount rate as possible. Therefore, valuation should incorporate a thorough and objective analysis to obtain an appropriate discount rate reflecting the acceptable returns matching with the project's risk profile and market conditions (Ballard, 1994). It is vital to identify a model that can be employed to reliably estimate the appropriate discount rate.
Capital Asset Pricing Model
The prices of securities result from different analyses of different information accompanied by different conditions and preferences relevant to a particular investor. Therefore, it is necessary to employ some standard principles when estimating prices of securities. The CAPM describes the relationship between risk and return in an efficient market. An efficient market is one where the market price is an unbiased estimate of the intrinsic value of the investment (Damodaran, 2002). The CAPM is regarded as a single factor model because it is based on the premise that the expected rate of return can be predicted by using a single factor, the systematic risk.
The systematic risk predominant in any investment is represented by beta (β), which is calculated as the historical volatility of a company's share prices compared to the market and is therefore a proxy for risk. A minimum level of return required by the investor is realized when the expected return E(Ri) is equal to the actual return on an asset; this is known as risk-free return (Rf). The CAPM assumes that an investor will only hold a market portfolio. A market portfolio (m) is defined as a portfolio in which an investment into any asset is equal to the market value of that asset divided by the market value of all risky assets in the portfolio. Equation [1] is the CAPM equation for estimating the rate of return.
where E(Ri) is the expected return (cost of equity) on an asset, i, and Rf is the risk-free rate and can be obtained from a totally safe investment (Rudenno and Seshold, 1983). When estimating the risk-free rate it is important to use a rate on long-term Treasury bonds (T-bonds) because mining stocks are long-term securities; Treasury bills are more volatile than T-bonds. When using the CAPM to estimate the cost of equity, the theoretical holding time horizon is the life of the project. Therefore, it is a logical choice to use the rate on long-term T-bonds as a proxy for the risk-free rate. The term E(Rm)- Rf, represents the market risk premium (Brigham and Ehrhardt, 2007).
Gordon's Wealth Growth Model
Gordon's Wealth Growth Model was initially developed by Gordon and Shapiro in 1956, and later refined by Gordon in 1962, based on the premise that dividends grow at a constant rate in perpetuity. Nonetheless, this assumption does not hold in reality because projections of dividends cannot be made for an indefinite period; hence, various versions of the dividend discount model have been developed. These models were developed based on different assumptions concerning future growth. The simplest form of the dividend discount models is Gordon's Wealth Growth Model and it is used to value a stock of a company that has stable growth and pay dividends regularly (Stowe et al., 2007; Damodaran, 2002).
This model assumes that the stock is equal to the present value of all its future dividend payments. The predicted dividends are discounted back to their present values. Gordon's Wealth Growth Model is useful when evaluating entities having well-established policies on dividend payouts and a growth rate equivalent to or lower than the small growth in the economy (Damodaran, 2002). Companies may have different expected growth rates, but there is evidence that dividends growth rates for mature companies are similar to the nominal gross domestic product (GDP) rate. Nominal GDP is given by real GDP plus inflation (Brigham and Ehrhardt, 2007). The model's expected rate of return is calculated by using Equation [2].
where
R represents the investors' required rate of return (discount rate)
Dt-1represents dividends at the present time (paid in the previous period)
Dtrepresents dividends at the next consecutive time (paid in the next period)
Ptrepresents current stock price
g represents the constant growth rate of the dividend stream.
In order to obtain a reliable estimate of the expected rate of return, it is imperative that the expectations of investors are reflected on the stable growth rate and future dividends. Estimating reliable and impartial forecasts of future dividends, their timing, and growth patterns for deriving cost of equity is regarded as the main challenge in using dividend discount models.
According to Foerster and Sapp (2005) and Whitcutt (1992), the growth rate (g) can also be estimated using the nominal GDP since it is argued that GDP is the maximum sustainable growth rate for a company's dividend. However, using GDP growth rates to approximate long-term growth rate in dividends seems to work well at estimating the dividends for the stock of a mature and dividend-paying company. There is evidence that the dividend and GDP growth rates have a positive correlation (Foerster and Sapp, 2005).
Approach to comparing CAPM and Gordon's Wealth Growth Model
This study is limited to mining companies listed on the Johannesburg Securities Exchange (JSE). The JSE was selected because it:
> Is a member of the World Federation of Exchanges
> Complies with the global standards and legislative requirements
> Acts as a regulator to its members, ensuring that markets operate in a transparent manner, safeguarding investors
> Ensures accurate and adequate disclosure of all information relevant to investors (City of Johannesburg, 2014)
> JSE data can be accessed for an adequate length of time.
Prior to June 1995, the sectors of the JSE were defined differently; therefore to use data prior to this period, one would have to reconstruct each sectoral index in order to obtain comparable data. Reconstruction of the data is beyond the scope of this study, thus only data post-1995 was considered. The time horizon period for the study is January 1998 to December 2012 because the JSE was illiquid prior to 1998. The study considered top mining companies, by market capitalization, as the smaller companies are thinly traded and may experience long periods of mispricing, which would adversely affect the findings if it occurs.
In order to apply Gordon's Wealth Growth Model effectively, a company has to have stable growth and pay dividends regularly. Small mining enterprises do not pay dividends frequently and have variations in growth rates, thus it will be futile to determine their discount rates using this model. According to Tholana et al., (2013) gold, platinum, and coal are the most economically vital minerals in South Africa; hence, the focus of this study is restricted to these commodities. Coal-mining companies (excluding the multi-commodity companies) were not considered as they cannot be classified as 'stable growth' companies due to failure to pay dividends regularly. Based on the market capitalization, the top three mining companies in the gold and platinum sectors quoted on the JSE over the period of the study were selected.
The six mining companies used were:
> Platinum: Anglo American Platinum Limited, Lonmin Plc, and Impala Platinum Holdings Limited
> Gold: AngloGold Ashanti Limited, Harmony Gold Mining Company Limited, and Gold Fields Limited.
The databases used to source data for this study are I-Net Bridge, McGregor BFA, and Bloomberg. The WACC values obtained from the Bloomberg database were split into debt and equity components. The equity component of WACC was used to benchmark against the estimates of CAPM and Gordon's Wealth Growth Model.
The average market premium and risk-free rate (T-bonds) used in South Africa for the year 2013 are 6.8% and 6.4%, respectively (Fernandez et al., 2013). These estimates were adopted for this study in order to reduce the inaccuracy in the estimated cost of equity. The values were calculated for the preceding 60 months using ordinary least squares (OLS) linear regression, covariance of stock returns against the market returns, and adjusted using the Blume's technique. The adjusted coefficient values were used to estimate the cost of equity rates.
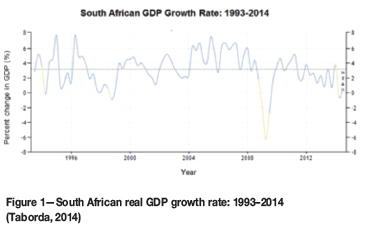
Gordon's Wealth Growth Model is based on the premise that dividends grow at a constant rate in perpetuity. Subsequently, the GDP rate was applied as an alternative to company-specific growth rates because the latter are not constant over time. The GDP growth rate in South Africa averaged 3.16% in real terms from 1993 until 2014, as shown in Figure 1.
For the purposes of illustrating the approach followed in comparing CAPM and Gordon's Wealth Growth Model for all the six mining companies, data and analysis is presented on Anglo American Platinum Limited. The discount rate estimates for Anglo American Platinum Limited for the period from financial year 2002 (FY2002) to FY2012 are shown in Figure 2. The estimates are divided, according to market conditions, into three phases: 'A' (market boom), 'B' (recession), and 'C' (steady economic growth). In Phase A, commodity prices soared drastically due to increased global demand for platinum group metals (PGMs). The headline earnings of Anglo American Platinum increased due to high US dollar prices realized for metals sold and weaker rand/US dollar exchange rates.
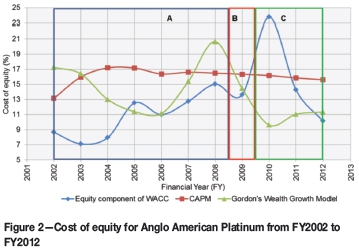
Although the demand for PGMs kept on growing, South African producers did not gain as anticipated from the increased metal prices, citing operational challenges as the main cause. These challenges resulted in reduced metal supply into the market. These challenges were, inter alia, industrial action, safety-related production stoppages, shortage of skilled labour, and processing bottlenecks. Inability to achieve set production targets and supply demands may impact a company negatively, which is evident in an increasing risk profile. The effect of these challenges can be seen in Figure 2, where values for the equity component of WACC increased steadily during Phase A.
During Phase B, the Gordon's Wealth Growth Model trend for the estimate cost of equity rates shows a sharp decrease, while that of CAPM is flat when compared to the increasing trend for the equity component of WACC. The GFC curbed the demand for PGMs, triggering a price decline. Anglo American Platinum experienced a decrease in headline earnings per ordinary share of 95% in FY2009 due to depressed US dollar prices realized on metals sold.
In Phase C, in the second half of 2009, there were signs of market recovery with a consequent increase in metal demand and recovering prices. In FY2009, the company did not pay dividends, citing the need to retain cash for maintenance of operations as the major reason. Anglo American Platinum adopted cost management strategies (curtailing operations that are not adding value such as putting high-cost shaft Siphumelele 3 on care and maintenance), which had an effective contribution to the company's performance (Anglo American Platinum Limited, 2010). It can be seen from Figure 2 that both the CAPM and Gordon's Wealth Growth Model failed to estimate the actual discount rates during periods of economic instability observed throughout the period under study.
Descriptive statistics for Anglo American Platinum
The descriptive statistics tool was adopted in order to analyse the data from the equity component of WACC, CAPM, and Gordon's Wealth Growth Model. Descriptive statistics allow data to be presented in a more meaningful manner, from which simpler interpretation can be performed. The relationship between actual and estimated discount rates was analysed to check how similar the values are by looking at the mean squared error (MSE), mean, standard deviation, range, sum, correlation coefficient, and box and whisker plot.
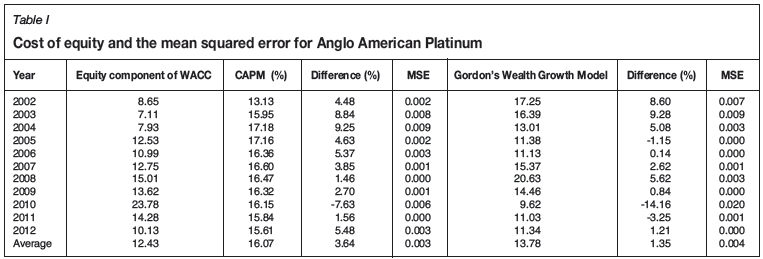
Estimated discount rates using CAPM and Gordon's Wealth Growth Model are contrasted with the equity component of WACC values in Table I using MSE. The actual cost of equity for Anglo American Platinum in FY2010 was 23.78%, which is higher than in other years. This may be attributed to the reaction to the GFC that curbed the demand for the PGMs, and lower US dollar prices on metals sold in 2009 (Anglo American Limited, 2009).
The mean square error between the equity component of WACC and either of the models must be zero to prove that there is similarity between actual and estimated cost of equity values. From Table I, it can be seen that CAPM and Gordon's Wealth Growth Model produce similar estimates for the MSE that are very close to zero. However, when considering the years individually, Gordon's Wealth Growth Model produces more values of MSE close to zero. The main problem with using the unweighted mean as a measure of analysis is that all values are assumed to have the same weighting. Therefore, when there is a wider range in values, as observed with Gordon's Wealth Growth Model, the calculated mean is biased towards narrowly spread values (Massart et al., 2005). Hence, it is important that other measures are employed in an analysis.
Statistical analysis using some of the measures is presented in Table II for the CAPM and Gordon's Wealth Growth Model against the equity component of WACC. Gordon's Wealth Growth Model has a mean of 0.14, which is close to that of the equity component of WACC (0.12), while CAPM has a mean of 0.16.
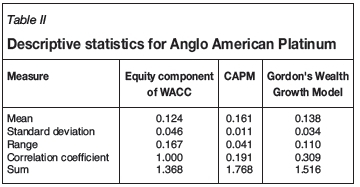
The standard deviation for Gordon's Wealth Growth Model is similar to (approximately 74% of) that of the equity component of WACC, while that of CAPM is about 24%. Therefore, the spread of data around the average for the equity component of WACC and Gordon's Wealth Growth Model is almost identical. As with the analysis using MSE, the range of Gordon's Wealth Growth Model is close to that of the equity component of WACC, whereas CAPM differs by approximately 76%. The main cause of this disparity is the wide spreads of Gordon's Wealth Growth Model and the equity component of WACC values, whereas the estimates of CAPM have a narrow spread.
The calculation yields the same results as with the other measures, Gordon's Wealth Growth Model showing superiority over CAPM. The cost of equity estimates from Gordon's Wealth Growth Model vary from 9.62% to 17.25%, while the CAPM estimates vary from 13.13% to 17.18%. Hence, the average discount rates are 13.78% and 16.07% for Gordon's Wealth Growth Model and CAPM, respectively, proving that CAPM yields higher estimates.
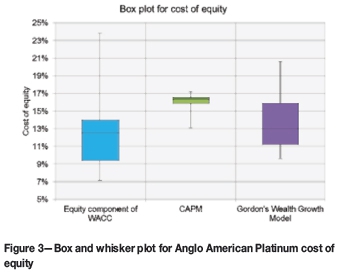
Correlation of the equity component of WACC rates with the cost of equity estimates from CAPM and Gordon's Wealth Growth Model was tested. Perfect correlation exists if all values lie on a straight line and the correlation coefficient is unity. The correlation coefficient values are very weak for both models (see Table II); however, Gordon's Wealth Growth Model has a better correlation with the equity component of WACC than CAPM. The spread for CAPM data distribution is narrower, as illustrated in Figure 3. The interquartile ranges (IQRs) for the equity component of WACC and Gordon's Wealth Growth Model are 0.05 and 0.05, respectively. The IQR for CAPM is 0.01, which is significantly different from that of the equity component of WACC; this is expected because the spread of the CAPM data is narrower (see Table I).
Summary forAnglo American Platinum
The cost of equity estimates using the CAPM and Gordon's Wealth Growth Model failed to predict the actual discount rates for Anglo American Platinum. Descriptive statistics were used to check for similarity in the data for CAPM and Gordon's Wealth Growth Model and the equity component of WACC rates. The statistical measures show that the data for Gordon's Wealth Growth Model and the equity component of WACC are similar, with only MSE results favouring CAPM when looking at the means.
Summary for all six companies
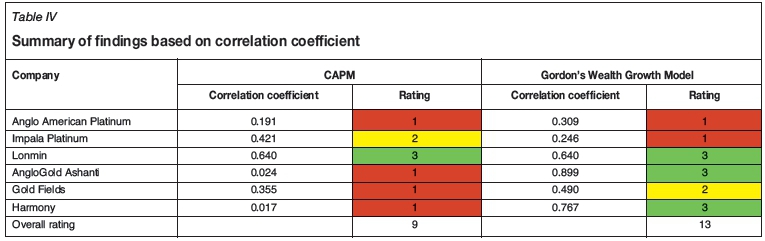
The same methodology used to estimate the cost of equity and compare it to the equity component of WACC was applied zin analysing the other companies. The cost of equity values estimated using Gordon's Wealth Growth Model produced a similar trend for all platinum companies, and the same applies for all gold companies used in the study. On the other hand, the CAPM produced different trends for different companies and this can be attributed to the individual risk profiles of the companies. The correlation coefficient measure was used to summarize the findings of this study. The rating system used to analyse the ability of CAPM and Gordon's Wealth Growth Model to estimate the cost of equity for mining companies is shown in Table III.
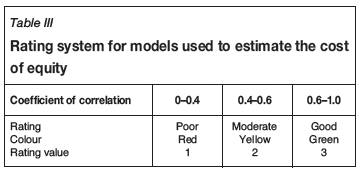
The colour classifications in Table IV were assigned values in order to calculate an overall rating score for CAPM and Gordon's Wealth Growth Model. A summary of the findings of this study using the correlation coefficient are shown in Table IV.
The Gordon's Wealth Growth Model has a higher overall rating compared to CAPM. Hence, Gordon's Wealth Growth Model was chosen as the better model to estimate the cost of equity for mining company projects.
Conclusions and recommendations
Since the GFC in mid-2008, it has been difficult for mining projects to access capital as mining companies have to compete with other sectors for this scarce resource. Therefore, it is vital to determine reliable project values. A widely applied valuation technique is DCF analysis, which uses appropriate discount rates to discount future cash flows to present values. There are numerous methods that can be applied to determine discount rates; this study considered Gordon's Wealth Growth Model and the Capital Asset Pricing Model (CAPM). These methods were chosen because of their simplicity and availability of the parameters required to estimate the discount rates. Based on market capitalization as quoted on the JSE over the period January 1998 to December 2012, the top three platinum and top three gold mining companies were selected for the study. Data used for empirical analysis was obtained from I-Net Bridge, McGregor BFA, and Bloomberg databases. The CAPM closely captured the actual cost of equity throughout the period under study, while Gordon's Wealth Growth Model captured the trend for the actual equity component of Weighted Average Cost of Capital (WACC) values. However, Gordon's Wealth Growth Model consistently underestimated the cost of equity. This can be attributed to the fact that economic market movements do not immediately affect mining companies.
The data-set for Gordon's Wealth Growth Model was similar to that of the equity component of WACC for both gold and platinum mining companies. There was a high correlation between Gordon's Wealth Growth Model and the equity component of WACC for gold mining companies, whereas a weak correlation between the equity component of WACC and both CAPM and Gordon's Wealth Growth Model was identified for platinum mining companies. However, CAPM had a narrower spread than Gordon's Wealth Growth Model throughout, suggesting that it is a better model for estimating cost of equity. It is therefore recommended that investors, practitioners, and/or researchers consider using Gordon's Wealth Growth Model when estimating cost of equity for mining companies under depressed economic market conditions, given that this method uses ex-ante data to estimate ex-ante returns.
Acknowledgement
This paper refers to part of an MSc research study undertaken at the University of the Witwatersrand.
References
Anglo American Platinum Limited. 2009. Annual Report 2009. http://www.angloamericanplatinum.com/~/media/Files/A/Anglo-American-Platinum/annual-reports/ar2009.pdf [Accessed 11 June 2014]. [ Links ]
Anglo American Platinum Limited. 2010. Annual Report 2010. http://investoreports.com/angloplatinumar2010_pdfs//downloads/angloplatinum_2010.pdf [Accessed 11 June 2014]. [ Links ]
Ballard, J. 1994. A practitioner's view of DCF methods in mineral valuation, Proceedings of Mineral Valuation Methodologies Conference, Sydney. http://www.1mine.org/view/?d=1234567890123456789012345678901234567890123456789012345678901234191782 [Accessed 13 February 2014]. [ Links ]
Brigham, E.F. and Ehrhardt, M.C. 2007. Financial Management. Thomson Learning, London. [ Links ]
City of Johannesburg. 2014. Johannesburg Securities Exchange. http://www.joburg.org.za/index.php?option=com_content&view=article&id=106%3Ajse&catid=30&Itemid=58 [Accessed 17 April 2014]. [ Links ]
Damodaran, A. 2002. Investment Valuation, Tools and Techniques for Determining the Value of Any Asset. Wiley, New York. [ Links ]
Fehr, D. 2010. Creating and monitoring a diversified stock portfolio. http://www.finrafoundation.org/web/groups/foundation/@foundation/documents/foundation/p118404.pdf [Accessed 21 November 2013]. [ Links ]
Fernandez, P., Aguirreamalloa, J., and Linares, P. 2013. Market risk premium and risk free rate used for 51 countries in 2013: a survey with 6,237 answers. http://papers.ssrn.com/sol3/papers.cfm?abstract_id=914160&download=yes [Accessed 9 January 2014]. [ Links ]
Foerster, S.R. and Sapp, S. 2005. The dividend discount model in the long-run: a clinical study. Journal of Applied Finance, vol. 15, no. 2. pp. 1-40. http://www.ivey.uwo.ca/faculty/ssapp/Research/Papers/Foerster_Sapp_JAF_Oct_2005.pdf [Accessed 18 July 2014]. [ Links ]
Janisch, P.R. 1976. The limitations of gold-mine evaluation. Journal of the Southern African Institute of Mining and Metallurgy, vol. 76, no. 11. pp. 439-444. http://wvww.saimm.co.za/Journal/v076n11p439.pdf [Accessed 13 February 2014]. [ Links ]
Massart, D.L., Smeyers-Verbeke, J., Capron, X., and Schlesier, K. 2005. Visual presentation of data by means of box plots. http://www.csee.umbc.edu/courses/graduate/CMSC601/Spring11/papers/box_charts.pdf [Accessed 15 December 2014]. [ Links ]
Njowa, G., Clay, A.N., and Musingwini, C. 2014. A perspective on global harmonisation of major national mineral asset valuation codes. Resources Policy, vol. 39, March. pp. 1-14. http://dx.doi.org/10.1016/j.resourpol.2013.10.004 [Accessed 14 April 2015]. [ Links ]
Park, S.J. and Matunhire, I.I. 2011. Investigation of factors influencing the determination of discount rate in the economic evaluation of mineral development projects. Journal of the Southern African Institute of Mining and Metallurgy, vol. 111, no. 11. pp. 773-779. http://www.saimm.co.za/Journal/v111n11p773.pdf [Accessed 25 February 2014]. [ Links ]
Rudenno, V. and Seshold, P. 1983. Cost of capital for resource projects. The Australasian Institute of Mining and Metallurgy Project Development Symposium,, Sydney, November 1983. pp. 281-286. http://www.onemine.org/view/?d=1234567890123456789012345678901234567890123456789012345678901234194481 [Accessed 24 February 2014]. [ Links ]
Smith, G.L., Pearson-Taylor, J., Anderson, D.C., and Marsh, A.M. 2007. Project valuation, capital investment and strategic alignment-tools and techniques at Anglo Platinum. Journal of the Southern African Institute of Mining and Metallurgy, vol. 107, no. 1. pp. 67-74. http://www.saimm.co.za/Conferences/Pt2006/035-42_Smith.pdf [Accessed 24 February 2014]. [ Links ]
Stowe, J.D., Robinson, T.R., Pinto, J.E., and McLeavey, D.W. 2007. Equity Asset Valuation. CFA Institute Investment Series. Wiley, Hoboken, New Jersey. [ Links ]
Taborda, J. 2014. South Africa GDP growth rate. Trading Economics. http://www.tradingeconomics.com/south-africa/gdp-growth [Accessed 23 october 2014]. [ Links ]
Tholana, T., Musingwini, C., and Njowa, G. 2013. An algorithm to construct industry cost curves used in analysing cash cost performance of operations for selected minerals in South Africa. Journal of the Southern African Institute of Mining and Metallurgy, vol. 113, no. 6. pp. 473-484. http://www.saimm.co.za/Journal/v113n06p473.pdf [Accessed 14 April 2015]. [ Links ]
Whitcutt, P.G. 1992. The cost of equity finance: an empirical study. MBA research report, Wits Business School, University of the Witwatersrand. [ Links ]
Witmer, J. and Zorn, L. 2007. Estimating and comparing the implied cost of equity for Canadian and U.S. firms, Bank of Canada Working Paper 200748. http://www.econstor.eu/bitstream/10419/53825/1/548043353.pdf [Accessed 21 November 2013]. [ Links ]

