


Services on Demand
Article
 English (pdf)
 Article in xml format
 Article references
Indicators

Related links
-
 Cited by Google
 -
 Similars in Google
Share

 Permalink
Journal of the Southern African Institute of Mining and Metallurgy
On-line version ISSN 2411-9717
Print version ISSN 2225-6253
J. S. Afr. Inst. Min. Metall. vol.116 n.2 Johannesburg Feb. 2016
http://dx.doi.org/10.17159/2411-9717/2016/v116n2a11
PAPERS OF GENERAL INTEREST
Study of the pyrolysis kinetics of Datong coal using a sectioning method
R. DuI, II; K. WuI, II; X. YuanI, II; D. XuI, II; C. ChaoI, II
IState Key Laboratory of Advanced Metallurgy, University of Science and Technology Beijing, Beijing, China
IISchool of Metallurgical and Ecological Engineering, University of Science and Technology Beijing, Beijing, China
SYNOPSIS
Lump coals are currently employed to replace part of coke in the COREX melter-gasifier for ironmaking. In order to optimize the process, the pyrolysis kinetics of Datong coal used in the COREX process was studied. A sectioning method is proposed to overcome certain shortcomings of traditional methods for studying the pyrolysis of coal. Based on the sectioning method and the characteristics of the coal pyrolysis process, the temperature range was divided into three intervals. In the first, the adsorbed gas and water of crystallization were removed; in the second, the coal was transformed into semi-coke; and finally, the semi-coke was further coked. Three models of reaction were then established to study the different stages of the pyrolysis process: an interfacial chemical reaction model, a random pore model, and internal diffusion with shrinking volume. The results showed that the experimental data fitted the models well, with all correlation coefficients (r2) exceeding 0.97. Finally, the mechanisms of reaction and kinetic parameters for each temperature range were derived, which laid a necessary foundation for optimizing the usage of non-coking coal in the COREX process.
Keywords: ironmaking, COREX process, kinetics, coal pyrolysis; sectioning method
Introduction
In view of environmental concerns and the shortage of good-quality coking coal, the COREX process was designed as a new ironmaking technology, attracting wide attention (Fang et al., 2005). In this process, lump coal and a small quantity of coke are directly charged into the melter-gasifier, where a high-quality reducing gas is generated for the reduction of the iron ore (Kumar et al., 2009). In contrast to the conventional blast furnace (BF) process, non-coking lump coal is used as the reducing agent and as the energy source, and the iron charge consists of lump ore and/or pellets, which results in the elimination of the coke oven and sintering plant as well as a decrease in investment (Kumar et al., 2009; Liu et al., 2012).
Although the COREX process has made great progress, in current production practice the energy consumption greatly exceeds that of the BF, and it requires a certain amount of coke to maintain permeability of the semi-coke bed (Wang et al., 2008). In addition, the process consumes a lot of good-quality lump ore and lump coal. The pyrolysis of coal is the first step in most coal conversion processes, such as carbonization, gasification, and combustion (Aboyade et al., 2013). The reaction behaviour of lump coals in the COREX melter-gasifier is crucial, as it determines energy utilization and gas composition, as well as the metallurgical properties and particle size of the semi-coke produced (Prachethan et al., 2011; Zhang et al., 2014). In order to optimize the process and improve its competitiveness, the pyrolysis kinetics of Datong coal used in Baosteel's COREX C-3000 facility was studied.
Generally, the Coasts-Redfern method (Xu et al., 2010), 'model-free' method (Xu et al., 2010), and DAEM method (Tang et al., 2005) are used to investigate the kinetics of coal pyrolysis. In the Coasts-Redfern method, commonly used mechanism functions are inserted into the non-isothermal kinetic equation to fit the experimental data one-by-one. The mechanism function with the largest correlation coefficient is selected as the best (Zhang et al., 2013). In this process, the reaction order is often replaced by the apparent reaction order to obtain the best fit (Zhang et al., 2014). However, the physical and chemical meanings of the reaction model are ignored. In the 'model-free' method (or DAEM method), the activation energies under different conversion rates can be calculated. However, there is no way to calculate the kinetic mechanism functions and the related parameters (Xu et al., 2010; Tang et al., 2005). Therefore, based on the previous research, a sectioning method was proposed to study the kinetics of coal pyrolysis. The kinetic parameters at different heating rates werecalculated, which could be widely used in the simulation and production. The reaction mechanisms and rate-controlling mechanisms, which could be used to predict the reaction rate, were also obtained.
Previous research on pyrolysis kinetics of coal
Coasts-Redfern method
The reaction rate for heterogeneous gas/solid-state reactions, can be described as follows:
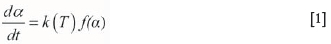
where ƒ( a) is the reaction model; a is the extent of conversion; t is the time, (s); and k(T) is a function of temperature (the reaction rate constant), (s-1). The conversion rate a is calculated by the following equation:
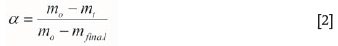
where m0 is the initial mass of the sample, (mg); mtis the mass of the sample at time t, (mg); and mfinal is residual mass of the sample at the end of reaction, (mg).
As k(T) = Aexp(-EJ(RT)) and dT=βdt, the approximate integral formula (Equation. [3]) can be obtained from Equation [1]:
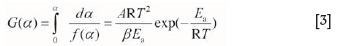
where G(a) is the integral formula of/(a)-1; Eais the activation energy, (J-mol-1); A is the former factor, (s-1); R is the ideal gas constant, (J-(K-mol)-1); T is the temperature, (K); and β is the heating rate, (K-s-1).
At the same heating rate, β is a constant. By taking logarithms of Equation [3]), Equation [4] can be obtained:
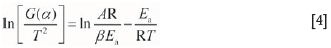
The commonly used kinetic mechanism functions G(a) are inserted into Equation [4] to fit the experimental data one-by-one. The correlation coefficients can be obtained from the plots of ln[G(a)/72] against 1/T, which are used to choose the mechanism function G(a). Eventually, the apparent activation energy (Ea) and former factor (A) can be calculated. Some commonly used functions (Hu et al., 2008) are shown in Table I.
However, in terms of the curve of fitting and the correlation coefficient, the selected kinetic mechanism function cannot explain the pyrolysis process very well. Without the corresponding boundary conditions and structural parameters introduced into the models, the Eaand A have reference value for only a single experimental condition. They would be meaningless with a slight change in the actual condition (Jeong et al., 2014). Consequently, they cannot be used as fixed parameters in the simulation and the expanded production process. Meanwhile, it is difficult to choose the best one when some well-fitting mechanism functions are obtained (Ping et al., 2007). The correct reaction kinetics is unknown, owing to the various corresponding reaction mechanisms and rate-controlling mechanisms of the different models. In addition, a single mechanism function is used to study the whole process of pyrolysis in the Coasts-Redfern method, which cannot accurately reflect the complex pyrolysis reaction kinetics (Celaya et al., 2015).
'Model-free' method
G(a) is constant when a is taken as a constant at different heating rates. Equation [3] can be expressed as follows:
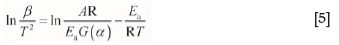
The linear relation between ln[/J/T2] and 1/T is shown in Equation [5]. The corresponding activation energies at different conversion rates can be obtained from the plots of ln[8/T2] versus 1/T. The rate-controlling mechanisms can be roughly estimated by the value of Ea. However, the correct kinetic mechanism function G(a), and the former factor (A) cannot be derived to explain the dynamics process (Xu et al., 2010; Tang et al., 2005).
Sectioning method
The reaction mechanisms are different in the different temperature ranges. It is unreasonable to assume that the entire pyrolysis process can be fitted with a single model.
Only the mathematical function for fitting can be derived, but the rate-controlling mechanisms and corresponding kinetic parameters cannot. Less is known about the entire pyrolysis process. Therefore, a sectioning method was proposed.
There are four steps in the sectioning method. First, according to the characteristics of the coal pyrolysis process, the temperature range is divided into different stages. Secondly, the appropriate kinetic models are established to describe the different ranges of the pyrolysis process. The fitting results are then acquired to verify the established models. Finally, the kinetic parameters of each stage are calculated.
Compared to the traditional methods, the sectioning method emphasizes the physical and chemical meanings of coal pyrolysis kinetics, rather than a simple mathematical fitting process. It was helpful in further studies of the coal resource. Furthermore, because the corresponding boundary conditions and structural parameters were introduced to the kinetic models, the corresponding kinetic parameters of the pyrolysis process could be widely used in the simulation and expanded production. Meanwhile, the reaction mechanisms and rate-controlling mechanisms were obtained, which could be used to predict the reaction rate.
Materials and methods
Datong (DT) coal used in the Baosteel COREX C-3000 process was used in the experimental work. The proximate, ultimate, and petrographic analyses are shown in Table II. According to the classification standards for coal rank, DT coal belongs to the bituminous class of coals.
A Netzsch STA 409 C thermogravimetric analyser was used for the TGA experiments. Sample masses of between 10 and 12 mg and particle size of 0.074-0.147 mm were used in the experiments. The sample was held at room temperature for 40 minutes to remove the air, heated to 105°C at a rate of 10°C-min-1, held at 105°C for 10 minutes to remove adsorbed water, and then heated to 900°C at different heating rates (5, 25, and 45°C-min-1). A gas flow of high-purity nitrogen (N2> 99.999%) at 150 mL-min-1 was employed to protect the sample from oxidation. The change in the sample residual mass with respect to time and temperature change (TG data) was logged automatically by the computer.
Results and discussion
Temperature range division
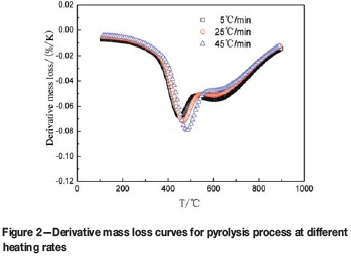
The mass loss and derivative mass loss curves for the pyrolysis process at different heating rates are shown in Figures 1 and 2.
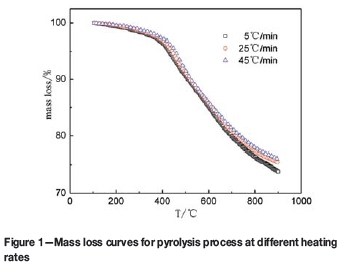
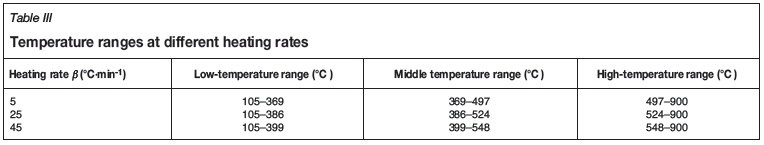
Regardless of the heating rate employed, the main pyrolysis process of DT coal was roughly divided in two stages by Zhang (2013): the primary pyrolysis temperature range was from 300°C to 600°C; the secondary pyrolysis occurred at temperature from 600°C to 800°C. In this paper, because changes of the kinetic mechanism are often accompanied by radical changes in the mass loss rate, the temperature range is divided into three parts at the temperature where the regional variation of mass loss rate reaches the maximum. The ranges are shown in Table III. The temperature ranges are different at different heating rates, the sectioning temperature points becoming higher as the heating rate is increased.
In the low-temperature range, the heating rate has little effect on the mass loss rates, which remain at a low level. The adsorbed gas and crystalline water are removed. Meanwhile, the weak chemical bond of coal decomposes (Cui et al., 2007). The pyrolysis rate increases sharply at around 386°C, which indicates the reaction mechanism and the rate-controlling mechanism are changing.
In the middle-temperature range, the rate of mass loss increases rapidly, and the DTG curves remain at lower levels. This indicates that the pyrolysis rate is rapid. The reactions occurring are dominated mainly by depolymerization and decomposition reactions, with evaporation of large amounts of coal gas, tar vapours, and water. As the temperature increases, the coal is transformed into semi-coke (Wu et al., 2014). Meanwhile, with increasing heating rate, the mass loss of rate DT coal decreases, and the rate of pyrolysis shows a decline. At 464°C (25°C-min-1), the peak of mass loss appears on the corresponding DTG curve, indicating that the pyrolysis reaction rate is at the maximum. With increased heating rate, the maximum mass loss rate increases, and the temperature corresponding to the peak shifts to the high-temperature region.
In the high-temperature range, the DTG curves gradually shift upwards and approach zero with increasing temperature, which indicates that the mass loss rate is decreasing and the reaction is approaching completion. The reactions taking place are dominated mainly by polycondensation reactions with little tar and volatiles. Meanwhile, the semi-coke is further coked with an obvious volume shrinkage (Fu et al., 2007). At the same temperature with the faster heating rate, the rate of pyrolysis of DT coal increases at a slower rate. The effect of heating rate on pyrolysis rate decreases with increasing temperature (Cui et al., 2007).
Kinetic models
According to the characteristics of each stage, the most likely kinetic mechanism functions were fitted to the the corresponding range. Then, the models with the best fitting results were chosen as the kinetic mechanism functions. The results indicated that the interfacial chemical reaction model with shrinking sphere, random pore model, and internal diffusion model with shrinking volume were suitable for describing the different stages in the pyrolysis of DT coal.
Interfacial chemical reaction model
The adsorbed gas and crystalline water are removed in the low-temperature range. The gaseous products are easily removed from the solid product. Therefore, the interfacial chemical reaction model was used for the first phase. It was assumed that the reaction particle A is a compact sphere; the reaction type is an interfacial chemical reaction; and the reaction equation is A (s) =aG (g) +bS (s) (Guo, 2006).
When the interfacial chemical reaction is the rate-controlling mechanism, the consumption rate of A is equal to the interfacial chemical reaction rate, namely
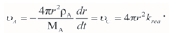
The integral equation can be described as follows:
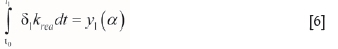
where δ1=MA/pAR0;y1(a)=1-(1-a)1/3; the conversion rate a is a = (R0-r3)/R0; MA is the relative molecular mass of sample A, 131x1.66x10-27 kg; pA is the density of reactant A, 1.28x10⁶ g-m-3; r refers to the radius of reactant A, (m); and R0refers to the initial radius of sample A, 1.11x10⁻⁴ m.
The function dT=pdt and the equation Krea1=A1exp (-Ea1/(RT)) are substituted into Equation [6] to yield Equation [7].
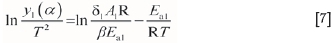
where krea1is the constant for the interface chemical reaction rate, (m-s-1); A1is the former factor, (m-s-1); and Ea1is the reaction activation energy, (J-mol-1).
According to the linear relationship of ln[y1(α) /T2] and 1/T in Equation [7], the slope and intercept of the curve can be obtained in terms of the fitting results in the low-temperature range, and, Ea1, A1, and the function of krea1and T can then be calculated.
Random pore model
Coal is transformed into semi-coke in the middle-temperature range. The reaction rate is related to the specific surface area, which is increased with a large number of pores forming. The random pore model was adopted to describe the process. It was assumed that the microporosity consisted of cylindrical holes with arbitrary radius, randomly distributed in the solid reactants; the pyrolysis reaction occurs mainly on the surfaces of micropores; and (ignoring the effect of diffusion) the pyrolysis rate of coal is equal to the chemical reaction rate, which is proportional to the specific surface area (Gupta, et al., 2000; Wang, et al., 2006).
By introducing the pore structure parameters, the random pore model is applied to the gas-solid reaction process, which has a low conversion rate (approx. 0-0.6) and a maximum or gradually reducing reaction rate. The relationship for fitting can be expressed as follows:
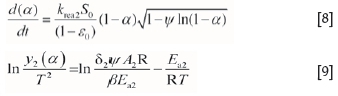
where  the initial surface area, 7.46xl05 m2-m-3; L0 is the total length of the initial pore, 1.56X10¹¹ m-m-3; and ε0is the initial void ratio, ε0=0.17 (dimensionless). 50 and ε0were measured by the mercury intrusion method.
Similarly, Ea2, A2, and the function of krea2 and Tcan be obtained from the plots of ln[y2(a)/T2] against 1/T in Equation [9].
Internal diffusion model with shrinking volume ofresultant
In the high-temperature range, the semi-coke is further coked with obvious volume shrinkage. With the high temperature, the chemical reaction rate is faster than the diffusion rate. The internal diffusion model with shrinking volume of the product was adopted (Zhang et al., 1988).
When gas internal diffusion is the rate-controlling step, the consumption rate of A is equal to the gas diffusion rate. It meets the relation vD= avA, namely
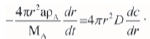 The equation can be expressed as follows:
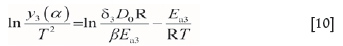
where
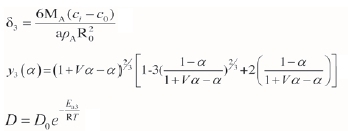
V is the volume ratio of solid products and reactants, V=(RX3-r3)/(R03-r3), F=0.733; ci and c0 are the gas concentration at the internal and external surface the solid material respectively, ci= Po/RT; c0=0 mol-m-3; D is the effective diffusion coefficient, m2-s-1; D0 is frequency factor, m2-s-1; a is the stoichiometric number of the gas products, which was taken as 1; and Rx is the radius (m) of particle A at temperature Tm.
Similarly, Ea3and D0can be acquired from the plots of ln[y,(a) /T2] vs. 1/T.
Fitting results
According to Table III, the experimental data for different temperature ranges at various heating rates were fitted by Equations [7], [9], and [10]), respectively. The results are shown in Figures 3, 4, 5, and Table IV. In the figures, the symbols □, O, and Δ represent experimental data at the different heating rates, and the lines the fitting results of the models.
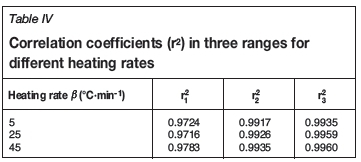
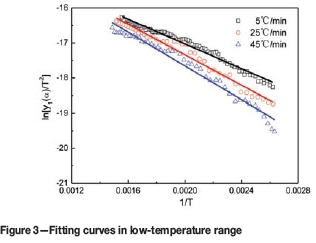
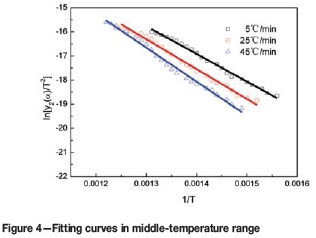
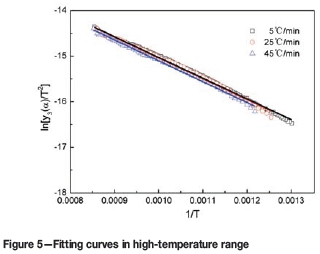
According to Figures 3, 4, 5, and Table IV, the experimental data is a good fit, and all the correlation coefficients (r2) exceed 0.97. Therefore, the interface chemical reaction model, random pore model, and internal diffusion model with the shrinking volume of product can be applied to the low-, middle-, and high-temperature ranges of the pyrolysis process, respectively.
Corresponding kinetic parameters
Based on the slopes and intercepts of the fitting curves and relevant parameters, the kinetic parameters in three temperature ranges at different heating rates were calculated. The results are listed in Tables V, VI, and VII.
In Tables V, VI and VII, the activation energy at the same rate-controlling mechanism increases with the heating rate, but the magnitude of variation is less. The minimum activation energy in the low-temperature range is from 14 to 20 kJ-mol-1. Adsorbed gas and crystalline water are removed in this process, which needs less energy than the processes at higher temperatures. The maximum activation energy (93.7116.3 kJ-mol-1) exists in the second temperature range. The main reactions are macromolecule dissociation of coal and further decomposition of macromolecules in a split product, which need more energy. The activation energy with the lowest range, from 37 to 39 kJ-mol-1, corresponds to the high-temperature range. The semi-coke is coked further in this temperature range. The observed activation energies, particularly in the low-and high-temperature ranges, are lower than that obtained by Zhang (2013), with a value between 100 kJ/mol and 200 kJ/mol determined by the Coasts-Redfern method. The reason is that the experimental data should not have been calculated by G(a) for the entire process, which leads to the error being introduced in the Coasts-Redfern method.
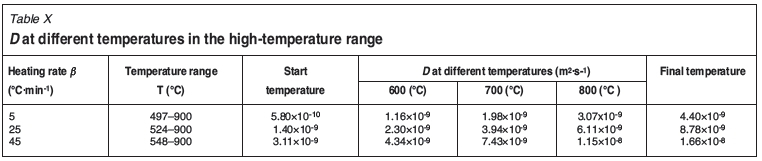
Furthermore, according to the variation in chemical reaction rate constant and effective diffusion coefficient with temperature (Tables V-VII), the kinetic parameters at different temperatures were calculated. The results are shown in Tables VIII, IX, and X. By taking the logarithm of the kinetic parameters, the results are shown in Figure 6.
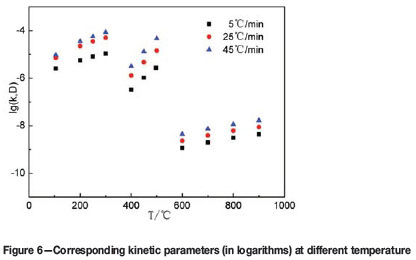
The reaction rate constant falls into the range 10-7-10-5 m-s-1. The magnitude of the effective diffusion coefficient ranges from 10-10-10-8 m2-s-1. The value of the reaction rate constantly exceed the effective diffusion coefficient by about 2-3 magnitudes, which conforms well to the data measured by other researchers (Ferrara et al., 2014; Ishida, et al., 1968). In the non-isothermal thermodynamics, the reaction rate constant at a certain temperature is a momentary value, rather than a steady one. The heating rate has an important influence on the Eaand A, hence the rate constants are dependent on the heating rate. The chemical reaction rate constant or effective diffusion coefficient increase with the heating rate at the same temperature, and also increase with the temperature.
Conclusions
In order to overcome certain shortcomings of traditional methods in studying the pyrolysis process of coal, a sectioning method was proposed in this paper.
1. According to the characteristics of Datong coal pyrolysis, the temperature range was divided into three parts at the temperature where the regional variation of mass loss rate reached a maximum. The adsorbed gas and crystalline water are removed in the low-temperature range. With the evaporation of large amounts of coal gas and tar, coal is transformed into semi-coke in the second phase. In the third range, the semi-coke is further coked
2. Different reaction mechanisms prevail in the three temperature ranges. In terms of the characteristics of Datong coal pyrolysis, the interfacial chemical reaction model, random pore model, and internal diffusion model with shrinking volume of products were applied to the different mechanisms
3. According to the divisions of temperature range and the established models, the experimental data obtained at different temperature ranges at various heating rates were fitted. The results showed that the experimental data was a good fit, and all the correlation coefficients (r2) exceeded 0.97. The established models were therefore suitable for describing each range of the pyrolysis process
4. The corresponding kinetic parameters in each range were calculated at different heating rates. The activation energy increased with the heating rate at the same rate-controlling mechanism. The chemical reaction rate constant or effective diffusion coefficient increased with the heating rate at the same temperature, and also increased with temperature.
Acknowledgements
The authors are grateful for support from the National Science Foundation China (Grant No. 51274026, 51474022), the Independent Research Project of State Key Laboratory of Advanced Metallurgy and the National High-Tech (Grant No. 41603003), University of Science and Technology Beijing (USTB), China.
References
Aboyade, A.O., Görgens, J.F., and Carrier, M. 2013. Thermogravimetric study of the pyrolysis characteristics and kinetics of coal blends with corn and sugarcane residues. Fuel processing Technology, vol. 106. pp. 310-320. [ Links ]
Celaya, A.M., Lade, A.T., and Goldfarb, J.L. 2015. Co-combustion of brewer's spent grains and Illinois No. 6 coal: Impact of blend ratio on pyrolysis and oxidation behavior. Fuel Processing Technology, vol. 129. pp. 39-51. [ Links ]
Cui, Y.P., Qin, L.L., and Du, J. 2007. Products distribution and its influencing factors for coal pyrolysis. Coal Chemical Industry, vol. 129, no. 2. pp. 10-15. [ Links ]
Fang, J., Wang, XJ., and Guo, L. 2005. Energy consumption in smelting reduction. Steel Research International, vol. 76, no. 10. pp. 705-708. [ Links ]
Ferrara, F., Orsini, A., and Plaisant, A. 2014. Pyrolysis of coal, biomass and their blends: Performance assessment by thermogravimetric analysis. Bioresource Technology, vol. 171. pp. 433-441. [ Links ]
Fu, Z.X., Guo, Z.C., and Yuan, Z.F. 2007. Swelling and shrinkage behavior of raw and processed coals during pyrolysis. Fuel, vol. 86. pp. 418-425. [ Links ]
Guo, H.J. 2006. Metallurgy Physical Chemistry. Metallurgical Industry Press, Beijing. [ Links ]
Gupta, J.S. and Bhatia, S.K. 2000. A modified discrete random pore model allowing for different initial surface reactivity. Carbon, vol. 38, no. 1. pp. 47-58. [ Links ]
Hu, R.Z., Gao, S.L., and Zhao, F.Q. 2008. Kinetics by Thermal Analysis. Science Press, Beijing. [ Links ]
Ishida, M. and Wen, C.Y. 1968. Comparison of kinetic and diffusional models for solid-gas reactions. AIChE Journal, vol. 14, no.2. pp. 311-317. [ Links ]
Jeong, H.M., Seo, M.W., and Jeong, S.M. 2014. Pyrolysis kinetics of coking coal mixed with biomass under non-isothermal and isothermal conditions. Bioresource Technology, vol. 155. pp. 442-445. [ Links ]
Kumar, P.P., Barman, S.C., and Reddy, B.M. 2009. Raw materials for COREX and their influence on furnace performance. Ironmaking and Steelmaking, vol. 36, no. 2. pp. 87-90. [ Links ]
Kumar, P.P., Rao, Y.S., Chidambaran, K., and Ranjan, M. 2009. Influence of coal size on the performance of COREX process. Steel Research International, vol. 80, no. 3. pp. 179-184. [ Links ]
Liu, Q.H., Wu, K., and Wang, H.Y. 2012. Kinetic study of tar's separation from coals used in COREX. Journal of China Coal Society, vol. 37, no. 10. pp. 1749-1752. [ Links ]
Ping, C.J., Zhou, J.H., and Cheng, J. 2007. Research on the pyrolysis kinetics of blended coals. Proceedings of the CSEE, vol. 27, no. 17. pp. 6-10. [ Links ]
Prachethan, K.P., Raju, B.S.L., and Ranjan, M. 2011. Characteristics of coal required for superior performance of CoREX ironmaking. Ironmaking and Steelmaking, vol. 38, no. 6. pp. 412-416. [ Links ]
TANG, W.J., WANG, C.X., and CHEN, D.H. 2005. Kinetic studies on the pyrolysis of chitin and chitosan. Polymer Degradation and Stability, vol. 87. pp. 389-394. [ Links ]
Wang, L., Zhang, Z.T., and Zhang, L. 2006. Study on modified random pore model of catalytic coal char gasification. Journal of Xi'an Jiao Tong University, vol. 40, no. 3. pp. 319-323. [ Links ]
Wang, N., Xie, X.M., and Zou, Z.S. 2008. Analysis of material and energy consumption of CoREX C3000. Steel Research International, vol. 79, no. 7. pp. 547-552. [ Links ]
Wu, K., Liu, Q.H., and Zhan, W.L. 2014. Research on tar precipitation kinetics using phasewise analysis. Journal of Chemical Engineering of Chinese Universities, vol. 28, no. 4. pp. 738-744. [ Links ]
Xu, G.Y., Paul, W. A., and Naoko, E. 2010. Kinetic study on thermal decomposition of flax fibers with model-free and Coats-Redfern model fitting kinetic approaches. CIESC Journal, vol. 61, no. 9. pp. 2480-2487. [ Links ]
Zhang, C.R., Yang, Y.G., and Zhang, G. 1988. Kinetic model for solid state reactions controlled by diffusion. Acta Physico-chimica Sinica, vol. 4, no. 5. pp. 539-544. [ Links ]
Zhang, J.L., Wang, G.W., and Shao, J.G. 2014. A modified random pore model for the kinetics of char gasification. BioResource, vol. 9, no. 2. pp. 3497-3507. [ Links ]
Zhang, S.F., Zhu, F., and Bai, C.G. 2014. High temperature pyrolysis behaviour and kinetics of lump coal in COREX melter gasifier. Ironmaking and Steelmaking, vol. 41, no. 3. pp. 219-228. [ Links ]
Zhang, S.F., Zhu, F., and Bai, C.G. 2013. Thermal behavior and kinetics of the pyrolysis of the coal used in the COREX process. Journal of Analytical and Applied Pyrolysis, vol. 104. pp. 660-666. [ Links ]

