


Services on Demand
Article
 English (pdf)
 Article in xml format
 Article references
Indicators

Related links
-
 Cited by Google
 -
 Similars in Google
Share

 Permalink
Journal of the Southern African Institute of Mining and Metallurgy
On-line version ISSN 2411-9717
Print version ISSN 2225-6253
J. S. Afr. Inst. Min. Metall. vol.116 n.2 Johannesburg Feb. 2016
http://dx.doi.org/10.17159/2411-9717/2016/v116n2a2
PAPERS - MINING BUSINESS OPTIMIZATION CONFERENCE
Impact of discount rates on cut-off grades for narrow tabular gold deposits
C. Birch
School of Mining Engineering,University of the Witwatersrand
SYNOPSIS
The purpose of this study was to establish the impact of discount rates on cut-off grades for narrow tabular gold deposits as characterized by the goldfields of the Witwatersrand Basin in South Africa. There are various methods available for determining the cut-off grade, from simple breakeven calculations to sophisticated software packages that consider a variety of inputs to optimize the cut-off grade. For this study a simple financial model was created in Microsoft Excel® that links the ore flow, block listing, and the cash flow. This allows the cut-off grade to be optimized considering how the cost of capital and chosen discount rate affect the cash flow.
The discounted cash flow (DCF) and resultant net present value (NPV) are a widely used valuation method for production properties according to the South African Code for the Reporting of Mineral Asset Valuation (SAMVAL Code). The financial model in this study utilizes the Solver function, as well as simple Microsoft Excel spreadsheet formulae to optimize the NPV. Solver was chosen as it is a standard feature in Excel and thus no additional software costs are incurred beyond the basic Microsoft Office suite. For the purpose of this study, just narrow tabular gold deposits of the Witwatersrand Basin were considered. An example of a typical ore block listing, as well as the costing figures, was obtained from an operating gold mine. The results obtained from the study financial model were compared to the current cut-off grades obtained from the mine using their proprietary optimizer program, and were found to be comparable. The methodology utilized for this study thus appears valid.
The cut-off grade was optimized considering the cash flow, which includes the variable mineral resource royalty tax, the variable gold income tax, as well as the discount rate. By comparing the resultant NPVs using discount rates of zero, 9%, and 12%, the impact of the discount rate on cut-off grades, resultant life of mine, and average mining grades (AMG) could be compared for the example ore block listing.
The South African Code for Reporting of Exploration Results, Mineral Resources and Mineral Reserves (SAMREC Code) does not require operations to state if a discount rate was considered in determining mineable reserves. Mining companies approach the question of applying discount rates in determining their cut-off grades, and thus mine planning strategy, in different ways. Due to the negative impact that optimizing purely on NPV has on the life of mine, some choose to optimize only on profit. Other companies have reverted to utilizing pay limits as their primary grade planning strategy. The calculated cut-off grade is then considered to be another planning indicator rather than a hard determination of mineable reserves.
Keywords: discount rates, cut-off grades, discounted cash flow (DCF), net present value (NPV), optimization, Microsoft Excel, and Solver
Introduction
Mining companies calculate a cut-off grade to determine which portion of the mineral deposit can be mined economically. This cut-off grade calculation takes into account the estimated price of the commodity, exchange rate, mine recovery factor, the cost to mine and process the ore, as well as the fixed costs for the mine. In addition, mineral resource royalty tax as well as income tax costs may be included. Cutoff grade is a planning tool and thus needs to be established at the start of the annual planning cycle. There is an element of uncertainty in the establishment of the cut-off grade, as the modifying factors used in the establishment of the cut-off are estimations. By using the planned extraction rate, expected recovery factor, and production costs, the variable to break-even then becomes the in situ grade of the material being sold. As long as the grade is higher than the break-even grade in a particular block being mined, the block will be mined profitably.
This paper explores the use of simple Microsoft Excel® spreadsheets to optimize the cut-off grade considering the discounted cash flow (DCF) and resultant net present value (NPV) for narrow tabular gold deposits. To be able to calculate the NPV, a discount rate is required. This is determined by considering the weighted cost of capital (WACC) as well as applicable risk adjustments. Various other methods to achieve this are available in the public domain and in proprietary software, but are often complicated to follow and implement on a mine without expert external help. Various methods for calculating cut-off will be considered. These are break-even-based cutoff, optimized for profit cut-off, and optimized for NPV cut-off. The example presented in this paper is a typical mature gold mine, and the information utilized includes the historical ore flow, block listing, as well as the cost and metal price estimations. The mine also provided their own cut-off grade results to be compared with the financial model created for this study for verification purposes.
Cut-off calculations
Every orebody is unique and thus should be considered individually for the determination of cut-off grades. The block listing, as well as the resultant grade-tonnage curve, should be the starting point of any cut-off grade determination if the value optimization is to consider the full extraction of the ore resource. The block model is a listing of all the discrete blocks evaluated in the geological block model. These include the Measured Resource, Indicated Resource, and Inferred Resource (SAMREC, 2009), but for this study only the available Measured and Indicated blocks are considered.
The starting point for the Microsoft Excel evaluation model created for this study was the block listing. This block listing is created from the geological model and is a list of all the potential mining areas, and their estimated grades and volumes. Using this block listing, companies declare their mineral resource and reserve in the public domain. This is usually as part of the annual report, but also at times when a Competent Person's report is prepared as required by shareholders and potential investors. The block listing is often depicted in the form of a grade-tonnage curve (Figure 1). From this figure, it is easy to determine the tons above a certain cut-off, and the resultant average grade of all those blocks above that cut-off grade. The SAMREC Code sets out the minimum standards required for public reporting of exploration results, mineral resources, and mineral reserves in South Africa. Part of this Code deals with the conversion of mineral resources to mineral reserves, with the potential for economical extraction being part of these requirements. The cut-off grade is thus fundamental to how investors view the potential of an orebody to generate returns on their investment (SAMREC, 2009).
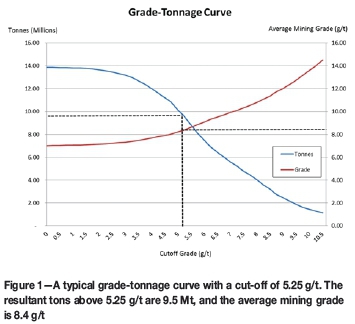
The block listing shown in Figure 1 is for a typical mature South African gold mine. This particular block listing and resultant grade-tonnage curve were used for all the discussions in this paper. The data is not intended to represent any particular mine and is a number of years old. The block listing is therefore not representative of the mineral resource currently available on the source mine. This is the typical output of the geological block model. The size of the blocks in the block model should represent the smallest block that can be selectively mined. The block listing in this particular example was modelled using 2D modelling techniques, which are generally considered adequate for narrow tabular gold deposits.
For this study, a Microsoft Excel spreadsheet was created to link the block listing to a simple cash flow calculation. Additional spreadsheets were added into the program to bring in average ore flow information (which impacts the ratio of ore to waste tons milled) and output grade-tonnage as well as grade-profit curves.
The block listing used for the creation of the cash flow models was based on the Measured and Indicated blocks only (based on geological confidence in the block model). No initial capital was considered for the cash flow and thus an internal rate of return (IRR) could not be obtained. The orebody investigated in this study is that of a mature mine, and the only capital is ongoing capital. This capital was included in the working costs, as it is felt that ongoing capital should be considered in the determination of the cut-off grade. This is because the mining of a block should cover the replacement costs. Owing to the uncertainty in the grade and volume of the inferred blocks, cut-off calculations including this material were considered to be unreliable.
The block listing used has 4158 Measured and Indicated blocks. The block sizes range from 10 m2 to 12 000 m2. The blocks were created manually and consider all known structures with displacements greater than 2 m to be a barrier - such structures are used to split blocks. Due to this consideration, the majority of the geological losses are already considered in creation of the blocks, and the blocks can all be considered mineable for this study. The grade distribution ranges from 0.1 g/t to 49 g/t. This grade is not the channel grade, but the grade over the practical stoping width. The channel width varies between 6 cm and 167 cm. The minimum practical planned stoping width is 136 cm, with the maximum being 192 cm. The grade dilution is not constant because where the channel width is below the practical minimum stoping width, the dilution can be significantly higher than for areas where the channel width is above this width.
Break-even calculation
The cut-off grade calculation is essentially very simple. It determines the grade required for a unit of ore to return a profit. The break-even volume formula is well known in financial textbooks and is essentially used to calculate how many units need to be produced to cover the fixed costs, as well as cover the unit variable cost for that amount of units (Correia et al., 2013). For calculating the break-even grade, it is essentially a volume break-even calculation where the volume is known (usually limited due to shaft capacity, mill capacity, or some other physical constraint), and the unknown is the in situ grade of the commodity. The other parameters required are total fixed cost and unit variable cost. From these the total unit cost can be obtained (typically expressed in rands per ton). The other factor required for the cut-off calculation is the mine recovery factor (MRF), which is the shaft call factor (SCF) multiplied by the plant call factor (PCF). The commodity price in rands per gram is obtained from the commodity price in US dollars (usually quoted per troy ounce for gold) and the exchange rate. This can be expressed as follows:
As long as only mineral resources above the break-even grade are mined, the profit from the orebody will be maximized as it is not being diluted by mining material that does not cover the cost of mining. Thus the break-even grade becomes the cut-off grade. The average grade of the material in the block listing above the cut-off grade becomes the average mining grade. This grade can then become the target grade for planning to ensure full extraction of the orebody without depleting the highest grade areas prematurely.
Which costs are included in the cut-off calculation is subject to much debate and often changes through the life of the project. While a company is still recovering the initial capital costs, a budget cut-off can be used. This will include all the mining and development costs, as well as an additional percentage to recover the initial capital costs, considering the impact of time value of money. In the final stages of the mine, development costs are minimal and certain areas can be mined that were previously considered below cut-off grade. This is called a marginal cut-off grade (Lane, 1988).
For the case study, a gold price of R420 per gram was used (US$1244 per ounce with R10.5 per US dollar). The fixed costs for the mine are assumed to be R120 million per year and the variable costs are R1273 per ton (based on figures supplied by the mine and used in the 2014/2015 planning cycle for cut-off grade determination). The mining cost was based on a hoisting/milling constraint of 67 300 t/month (806 000 t/a). The MRF used is 64.5% (based on the weighted average of the two MCFs estimated for the two reefs being mined, as well as the historical PCF). This cost excludes mineral resource royalty tax and income tax. The resultant break-even grade is calculated to be 5.25 g/t. The resultant tons above 5.25 g/t are 9.5 Mt. The average mining grade (AMG) is 8.4 g/t.
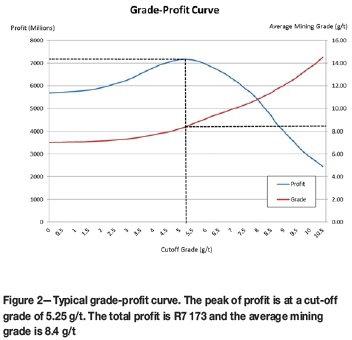
This break-even grade calculation is very simplistic. It just considers direct and indirect mining costs. The MCF is utilized, but no consideration is given to the additional waste tons that are milled (expected dilutions like gullies, historical discrepancies, and waste development hoisted as reef). It is then possible to depict a grade-profit curve. Where the profit peaks, the grade at this point is the cut-off grade. This relationship is shown in Figure 2.
If the ratio of the additional waste tons that are milled to the face grade is brought into the break-even calculation, along with mineral resource royalty tax costs, a more realistic cut-off value is obtained. To determine these, the same parameters used in the financial model were considered. These are a R420 per gram gold price, mining costs determined by mineral resource royalty tax rate, a MRF of 64.5%, and 85% of the material being mined coming from the stope faces. The following cut-offs were obtained:
> No mineral resource royalty tax: 6.17 g/t
> Historical mineral resource royalty tax rate used in cost (4%): 6.54 g/t
> Maximum refined mineral resource royalty tax used in cost (5%): 6.63 g/t.
Optimizing forprofit
Some companies use optimizer programs that utilize the block listing, as well as the basic inputs, to calculate the cutoff grade. The grade-tonnage curve is then automatically generated - indicating how much material is available above the cut-off grade for reporting purposes. The average mining grade can also be obtained. This is the average grade of the material above the cut-off grade, and becomes the planning grade for the financial model.
In the simplest form, all that is required is the block list information with gold grades in either grams per ton or centimetre-grams per ton (cmgt), the channel width, stoping width, and area of the blocks. From the area and specific gravity, the tons can be determined for each block. The gold content (in grams) can be calculated using the grade for the block and the tonnage. The mining costs can be estimated considering the fixed and variable costs for the mine at the expected production rate, and the resultant profit for each block can be determined. Factors from the historical ore flow are included in the calculation, and these include expected dilutions like gullies, historical discrepancies, and planned waste development hoisted as reef. A consideration for mineral resource royalty tax may also be incorporated (either at the estimated rate or at the maximum rate) as it is considered a cost. Income tax is excluded from the calculation as it is subject to tax shields and gold tax is paid on a sliding scale based on profitability. This is difficult to determine without considering the financial model.
The optimizer sorts the blocks according to grade, and seeks to maximize the profit using a cumulative function. The grade for the block that corresponds to the maximum cumulative profit is then considered the cut-off grade. Only the blocks above this grade are mined. The AMG is determined and this grade is then used in the financial planning. This is, however, basically an extension of the break-even calculation. The cut-offs obtained using this method are identical if there is no consideration given for mineral resource royalties tax. They are also very similar to those obtained just using the break-even calculation if a cost is used that includes different rates of mineral resource royalties tax. There has been no consideration of time value of money, cost of capital, discount rates, or net present value (NPV) in this type of profit optimization calculation.
Wei present value
The discounted cash flow (DCF) valuation method is commonly used to value mineral exploration projects as well as operating mines where there is significant knowledge of the orebody. This requires a detailed mine design with expected tonnages and grades, as well as good estimations for costs and recoveries (i.e. at feasibility study level or for producing mines). The mine's cost of capital is used as the discounting rate of the cash inflows and outflows, and the sum of these discounted cash flows is the NPV for the mine. A positive NPV is usually required for the mine to be considered viable when regarding the declaration of mineral reserves according to the SAMREC Code. The time period for each discounting period is normally a year, with inflows and outflows for the year being added and then discounted by the full year's discount rate (year-end convention).
Microsoft Excel has an NPV function where the discount rate as well as the cash flow is considered. The check for this function is to discount each amount in the cash flow by the appropriate year, and then sum these resultant discounted amounts.
Discount rate
To do a discounted cash flow, a discount rate is required. This discount rate is essentially the cost of capital and it is usually calculated by the weighted average cost of capital (WACC). This essentially considers all the sources of capital required for a project (equity and debt), the portion of the total each source makes, and its cost. The various sources are then weighted by their proportion and an average is calculated. A risk factor can be added to the WACC to account for uncertainties in the plan and ensure a positive NPV, even if the plan is not achieved.
The cost of debt is easily understood. It is the interest rate that banks charge borrowers. The cost of equity is harder to quantify. Investors in the mining business need to exceed the return on their capital that they could get by just depositing the money in the bank with no risk. Spreading the investment across many investment opportunities is a way of reducing risks, but the returns are likely to be lower than investing in a single company. The capital asset pricing model (CAPM) is a way to determine the return on the investment that an investor is likely to require to ensure continued investment. It is calculated considering the risk-free rate (usually based on government bonds), a fully diversified rate (usually the rate of return on the whole stock market or the sector of the stock market in which the mining company operates), and the beta (a measure of volatility of the share compared to the whole stock market or sector of the stock market). Volatility in share prices is perceived as indicating risk.
Discount rates can be in nominal (include the effects of inflation and escalation) or real (based on current financial conditions) terms. Due to the uncertainties regarding future costs as well as metal prices, many investment evaluations for mining projects are developed in real terms.
According to Smith et al. (2007), real discount rates of 9-12% for mining projects are appropriate for South African mining projects. This is equivalent to 14.5-17.6 % at a 5% annual inflation rate for WACC in nominal terms (Smith et al., 2007).
Cut-off modelling to maximize NPV
Two methods were considered for cut-off grade optimization to maximize the NPV. They both utilize the Solver function built into Microsoft Excel. This function is activated in the Add-Ins in the File menu. Once activated, a link to the dialog box appears in the Data menu (Meissner and Nguyen, 2014). The variable for the Solver function is the cut-off grade, and the Solver function is set up to optimize the cut-off grade to maximize the resultant NPV from the cash flow. The financial model was limited to a maximum of 20 years. Due to the discounting, income after 20 years has very little impact on the overall NPV.
The cash flow model considers the total face tonnage available as well as the AMG for the blocks above cut-off. The total planned milled tonnage is considered a fixed amount determined considering the constraints on the shaft. The other assumption is that the mix of mining areas will be the AMG, and thus the mined grade for the financial model is this grade. The ratio of tonnage from stope faces compared to all the tonnage milled is determined from a simple ore flow. This ore flow considers face tonnage, gully dilutions, and other sources of dilution, historical discrepancies, and how much development waste will be hoisted and milled with the ore. The ore flow also uses the historical SCF and PRF to calculate the planned MRF for use in the financial model. Revenue is derived from the recovered gold, the planned gold price, and the expected exchange rates.
This financial model considers mineral resource royalty tax as well as income tax (gold tax formula) in determining the cash flow. These tax rates both consider the profitability ratio of the operation in their calculations of how much tax is payable. The mineral resource royalty tax rate is applied to the total revenue from mineral sales, while the gold tax rate is applied to the taxable income determined considering operating costs and capital tax shields. The financial model has provision to consider initial capital and tax shields, but as the example is a mature mine, this does not influence the cut-off grade. These two taxations are difficult to consider for individual blocks in the block listing as they both have sliding scales determined by profitability. If these are considered in the cost for the individual blocks, and then again accounted for in the cash flow, they result in a double deduction for their costs.
The NPV is calculated by applying the selected discount rate to obtain the discounted cash flow (DCF) and adding these together. The model then runs through a series of cutoff grades, with the resultant AMG and available tons being determined for each cut-off. Solver then selects the cut-off grade that results in the highest NPV. To check the financial model as well as the cut-off grade optimization, a zero discount rate was used. The resultant cut-off grade matched the grade obtained using the optimization for profit method when considering the historical mineral resource royalty tax rate used in cost determination (4.0%).
NPVmodelling and life ofmine
The cut-off grade at zero per cent was calculated to be 6.59 g/t and the resultant AMG is 9.60 g/t. There are 6.3 Mt available above this cut-off grade. This gives a life of mine of 8 years, and the NPV is R2.4 billion.
To determine the impact of the discount rate, the financial model was run using 9% and 12% to represent an appropriate range for real discount rates for South African mines (Smith et al., 2007). The cut-off grade at 9% was calculated to be 7.04 g/t and the resultant AMG is 9.95 g/t. There are 5.5 Mt available above this cut-off grade. This gives a life of mine of 7 years and the NPV is R1 690 million. The cut-off grade at 12% was calculated to be 7.57 g/t and the resultant AMG is 10.38 g/t. There are 4.7 Mt available above this cut-off grade. This gives a life of mine of 6 years and the NPV is R1.5 billion.
When reviewing these numbers, it was determined that there was significant ore still above the break-even cut-off grade left on the mine when this model had effectively depleted all the ore above the NPV-optimized cut-off. It was considered unlikely that the mine would close at this point. A method was then determined to balance the benefits of extracting the high-grade ore early while not leaving economic ore underground. A method of recalculating the cut-off each year based on the remaining ore was created.
The block listing was modified where the ore extracted each year was depleted out of the block listing, and a revised cut-off and resultant AMG recalculated for each year based on this revised block listing. This approach mimics the concept that a revised cut-off is calculated at the start of the planning process based on the available resources at that point, as well as the revised expected economic and technical information at that point. This balances reporting and mine planning purposes; this method is considered to give a more realistic view, and yet allow the time value of money to dictate earlier extraction of the higher grade portions.
Using this method, the financial model has the AMG dropping from the value determined for the NPV-optimized plan to below the cut-off determined when there is no discount rate applied. This method diminishes the NPV for the 9% discount rate model to R1.6 billion (8% decrease), but the life of mine increases to 9 years. For the 12% discount rate model, the NPV decreases to R1.2 billion (24% decrease). The life of mine, however, increases to 8 years. The total tons mined increases from 5.5 Mt to 7.26 Mt for the 9% model, and from 4.7 to 6.46 Mt for the 12% model, improvements of 15% and 34% respectively. This approach, however, results in lower NPVs for both the 9% and 12% discount rate than planning without considering the discount rate and applying it afterwards to the cash flow model.
Cut-off impact on reserve statements
Investors have become far more circumspect as to putting their money into mineral projects following scandals like Bre-X (Cawood, 2004). This has led to the introduction of various reporting codes, which are essentially to protect investors and hold the professionals responsible for the figures they release to the public domain. Compliance with these codes is considered a prerequisite for public listing on various international stock markets like Toronto (TSX), Australia (ASX), and the Johannesburg Securities Exchange (JSE). Codes, as opposed to laws, allow for professional judgment, and a good guide as to what is acceptable is what a 'reasonable person' would do. To ensure compliance with this principle, mineral resource practitioners try following best-practice principles as far as practically possible, because this makes justifying the decisions easier to professional peers if called upon to do so.
There are several classification schemes worldwide, including:
> Canadian CIM classification (NI 43-101)
> Australasian Joint Ore Reserves Committee Code (JORC Code)
> South African Code for the Reporting of Mineral Resources and Mineral Reserves (SAMREC Code).
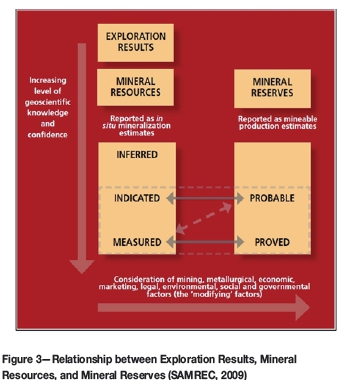
For this paper, the SAMREC Code has been used for illustration purposes, but the other codes share the same definitions and broadly follow the same requirements for compliance. Figure 3 shows the relationship between mineral occurrences, Inferred, Indicated, and Measured resources, as well as the modifying factors required to convert Resources into Reserves.
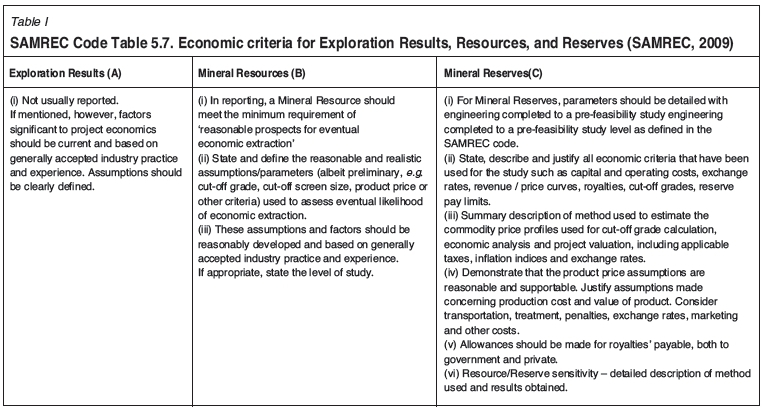
To comply with the SAMREC Code regarding the declaration of resources and reserves, various aspects need to be recorded and documented in a series of tables. Table I is an extract from SAMREC Code Table 5.7, which deals with economic criteria when regarding Exploration Results, Mineral Resources, and Mineral Reserves.
As can be seen in the table, the SAMREC Code has no specific requirement to disclose the WACC, and thus what would be considered an appropriate discount rate for the mining company. Different companies have different WACCs due to how they structure their debt/equity (debt is generally considered cheaper than equity), as well as how risky they consider the project. There is, however, a requirement to 'State, describe and justify all economic criteria that have been used for the study', including those used to determine cut-off grades. In Mineral Reserves (ii, iii, and v), it furthermore states that applicable taxes and royalty allowances should also be considered in how the cut-off grade is calculated.
Cut-off grades are used for two primary purposes: to declare a Mineral Reserve from a Mineral Resource, and for mine planning. There should be no conflict arising between these two objectives. Companies will always try and increase the amount of Mineral Reserve they declare, because investors place value on this. By having a lower cut-off grade, the Mineral Reserve will automatically increase as more of the Mineral Resource will be above this grade, and thus become part of the Mineral Reserve. Using a cut-off grade that just considers overall profit or break-even ignores the currently accepted measure of financial value which is the NPV. The cost of capital should also be considered in determining the cut-off grade. The time value of money and focusing on NPV rather than just overall profit means that the higher grade portions of the orebody should be mined first. Using this resultant higher grade cut-off grade only, however, leads to a lower overall extraction of the orebody, and economic portions above the break-even grade are effectively abandoned. When valuing an orebody using the DCF method, the SAMVAL Code requires a full disclosure of the WACC as well as how the discount rate being applied was obtained (SAMVAL, 2009).
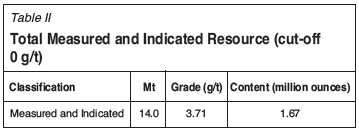
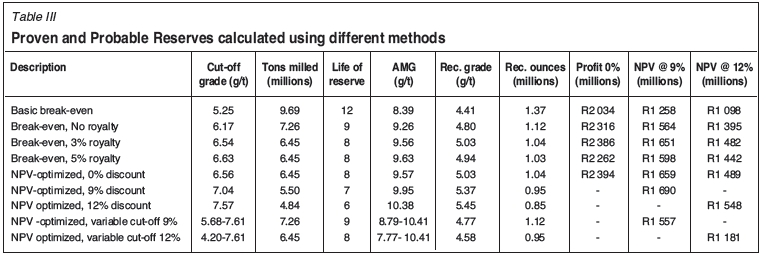
Table II shows the overall measured and indicated resource for the mine analysed for this study. Table III shows the summary of Mineral Reserves (Proven and Probable) that would result by applying the different cut-off grade strategies discussed.
For this summary, the various methods for calculating the cut-off grade have been tabulated indicating the cut-off grade, total tons milled (including dilutions and planned waste), life of reserve, resultant AMG, recovery grade (including PRF), recovered ounces, and the profit or NPV. For the methods where the profit was calculated, this was discounted using either 9% or 12% to allow direct comparison with the methods that were optimized at these two rates. All the methods utilized the same final cash flow model to determine the final profit/NPV. This cash flow included the expected PRF, dilutions and planned waste, mineral resource royalty tax, and income tax based on the gold tax formula. All cash flow models utilized the same commodity price, exchange rate, fixed cost, variable cost, and production rate.
As can be observed, the NPV optimized at 0% resulted in the highest profit. However, when the actual cost of capital and the timing of the extraction are considered, this type of cut-off grade determination results in an overall lower NPV. When optimization purely on NPV occurs, the focus is on the highest grade portion of the orebody initially. This results in a shorter life of mine and lower overall orebody utilization. With this type of approach, the model indicates the orebody is depleted when significant resources still remain underground that could be economically extracted.
The models where the cut-off grade and resultant AMG were recalculated each year (as the orebody was depleted with the approach to maximize the NPV of the remaining ore) were not satisfactory. The life of mine remained the same or higher than when optimizing with the view of maximum profit (0% model with NPV at zero), but the AMG quickly drops as the higher grade portions are depleted initially. While the mine remains profitable for a longer period, the NPV is severely diminished compared to the models where the NPV at 9% and 12% are the prime focus.
The impact of the varying the discount rate on the cut-off grade and NPV is displayed in Figure 4.
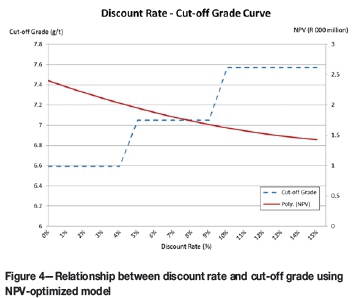
The relationship between cut-off grade and the discount rate is not a smooth curve, but has distinctive step changes. This is a function of the model used and the particular block listing. Different orebody block listings will display this relationship in different forms, depending on the number of blocks and where the peak for optimization occurs for each run of the optimization model as it is selecting a specific block value. The relationship between the discount rate and NPV can be approximated with a smooth polynomial polyline and is a function of the amount of ore mined, the life of mine, as well as the degree of discounting of the resultant cash flow.
Conclusions
The cost of capital and the concept of time value of money have a significant impact on cut-off grades if modelled to maximize NPV. The current trend is to focus on value, and not just overall profit. This has resulted on companies optimizing regarding the DCF and resultant NPV as the primary measure of value. The investors are, however, not the only stakeholders in a mining business. Due consideration should be given to employees, the community in which a mine operates, as well as the State. Thje overriding concern of these would be for a long life of mine as well as maximum exploitation of the orebody.
Cut-off grades can be determined in a number of ways. These range from simple break-even calculations to very complex models considering multiple facets of the mining business, including the effects of variations in the mining environment (Smith et al., 2007). In this study, however, the orebody, ore flow, as well as the cash flow, are the prime focus areas of consideration in determining optimal cut-off grade. A simple Microsoft Excel cut-off grade modelling tool has been developed that links the block listing, ore flow, and cash flow, and uses the Solver optimization tool. The impact of both the mineral resource royalty tax, as well as the income tax, is considered in determining the optimal cut-off grade. The SAMREC Code requires the cost of taxation to be included in the economic analysis in determining what the economically extractable portion of the mineral resource is.
The concept of variation has been ignored as it adds a whole level of complexity, requiring tools like Monte Carlo simulation to address. As these tools are not part of the basic Microsoft Excel package, they are considered beyond the scope of this paper. The orebody considered in this study is a mature South African gold deposit, and it is assumed that all the initial capital included in the tax shield has been depleted. As a result of there being no negative cash flow in the initial years (capital payback), no IRR could be determined for the various model options. Ongoing capital costs are included in the working costs for simplicity of determining the breakeven cut-off grades. When using the NPV-optimized methods, splitting the ongoing capital from the working costs could have benefits in how the taxation is calculated. This would differ for each mining company, according to how they consider their capital structure.
It has been shown that determining cut-off grades with a method that does not take the cost of capital and discount rate into the calculation results in lower NPVs when a discount rate is later applied. It has also been shown that optimizing on NPV alone results in partial extraction of economic ore, and thus lower mineral reserve value. Investors place value on the mineral reserve statement, and lower quantities of economic ore could negatively impact a mining company's investment potential.
Recommendations
Lane (1988) considered how to optimize extraction in the early years of a project to ensure early capital payback, and still get high total ore extraction. He determined different methods to calculate the cut-off grade at different points in a mine's value cycle. He proposed using a budget cut-off in the early years where the cost of capital is added onto the profit, then an optimal cut-off grade through the bulk of the project life. When the available ore dropped to the point that the mill was not running at its maximum capacity, Lane proposed calculating a marginal cut-off grade to extract the ore that had been left previously. In determining the marginal cut-off grade, he proposed removing development costs as well as milling costs, as this ore would have been accessed earlier in the mine's life, and the mill is the most economical when running at its maximum capacity. The spare capacity in the mill could be filled, with no additional milling costs, with ore above the marginal cut-off grade. This would contribute economically, as controlling the total unit cost is critical in ensuring the cut-off grade is valid (Lane, 1988). In the example presented as part of this study, the marginal cut-off grade concept has not been applied, but there would be significant material above this grade. Using a variable cut-off grade strategy as proposed in this study would replace the need to determine a budget cut-off, as this is automatically determined in the model.
Block listings are dynamic. This cut-off grade has been determined at a point in time to direct mine planning primarily for the following 12 months, and guide longer term planning. It also reflects the remaining ore available on the mine, as well as the geological confidence in the orebody at that point in time. As the mine continues to develop and conduct further exploration, Inferred mineral resources will be upgraded to Indicated or Measured mineral resources, and potentially become part of the Mineral Reserve. Considering this, the published Mineral Reserve can never be considered the final amount of ore that will be mined until just prior to mine closure.
Optimizing the cut-off grade with the view of maximizing profit (0% NPV) gives the best balance regarding life of mine, overall tons, and profit. Optimizing using the NPV as the key driver reduces life of mine significantly, for a small benefit in the NPV at both 9% and 12% (2% and 4% respectively). The SAMREC Code does not require a specific statement to be made regarding the cost of capital and subsequent discount rate. The impact of applying the discount rate into the cash flow model on the total declarable reserve ounces is significant if using the NPV as the optimizer driver. This impact was found to be 9% and 19% for the 9% and 12% discount rates respectively.
Using cut-off grades as a primary planning tool is very simplistic. It assumes that the production levels will be maintained at the optimal level. The grade distribution in the orebody is not considered, nor what ore is available for immediate extraction. The resultant ore flow used in generating the cash flow (and the resultant DCF to calculate NPV and IRR) assumes the AMG will be maintained constantly.
References
Cawood, F.T. 2004. Towards a mineral property valuation. Journal of the South African Institute of Mining and Metallurgy, vol. 104, no. 1. pp. 35-43. [ Links ]
Correia, C., Flynn, D., Uliana, E., and Wormald, M. 2013. Financial Management. 7th edn. Juta, Cape Town. [ Links ]
Lane, K.F. 1988. The Economic Definition of Ore. Mining Journal Books, London. [ Links ]
Meissner, J. and Nguyen, T. 2014. An Introduction to Spreadsheet Optimization Using Excel Solver. Meiss Research Group. http://www.meiss.com/download/Spreadsheet-Optimization-Solver.pdf [Accessed 2/12/2014]. [ Links ]
SAMREC. 2009. South African Mineral Resource Committee. The South African Code for Reporting of Exploration Results, Mineral Resources and Mineral Reserves (the SAMREC Code). 2007 Edition as amended July 2009. http://www.samcode.co.za/downloads/SAMREC2009.pdf [Accessed 10 April 2014]. [ Links ]
SAMVAL. 2009. South African Mineral Asset Valuation (SAMVAL) Working Group. The South African Code for the Reporting of Mineral Asset Valuation (The SAMVAL Code). 2008 Edition as amended July 2009. http://www.samcode.co.za/downloads/SAMVAL2009.pdf [Accessed 1 December 2014]. [ Links ]
Smith, G.L., Pearson-Taylor, J., Anderson, D.C., and Marsh, A.M., 2007. Project valuation, capital investment and strategic alignment-tools and techniques at Anglo Platinum. Journal of the Southern African Institute of Mining and Metallurgy, vol. 107. pp. 67-74. [ Links ]

