


Services on Demand
Article
 English (pdf)
 Article in xml format
 Article references
Indicators

Related links
-
 Cited by Google
 -
 Similars in Google
Share

 Permalink
Journal of the Southern African Institute of Mining and Metallurgy
On-line version ISSN 2411-9717
Print version ISSN 2225-6253
J. S. Afr. Inst. Min. Metall. vol.116 n.1 Johannesburg Jan. 2016
http://dx.doi.org/10.17159/2411-9717/2016/v116n1a13
PAPERS OF GENERAL INTEREST
Virgin rock temperature study of Venetia diamond mine
M.Q.W. Jones
School of Geosciences, University of the Witwatersrand, Johannesburg
SYNOPSIS
Temperature surveys in 13 boreholes at Venetia diamond mine, Limpopo Province, South Africa, in 1994 (shortly after the mine opened) and in 2006 (during the feasibility phase of the Venetia underground project) have resulted in a comprehensive database of rock temperatures and geothermal gradients. The database permits clear identification of some factors that perturb rock temperatures, the most important being underground flow of water and recent climate change, and identification of depth intervals showing linear temperature trends that are useful for establishing geothermal gradients. The Venetia data demonstrates the value of such detailed virgin rock temperature studies for mine refrigeration purposes. The average ground surface temperature, estimated by upward extrapolation of the borehole data, is 25.9±0.5°C, and the geothermal gradient, estimated by averaging the gradients in linear sections of the boreholes, is 19.5±1.0 K/km. A plot of unperturbed borehole temperature versus depth below mine datum (696 m above mean sea level) yields a linear array with an intercept of 25.3°C and a slope of 20.1 K/km, which are compatible with the above averages. The average thermal conductivity of Limpopo Belt rocks of similar composition and metamorphic grade to the country rocks at Venetia is 3.01±0.55 W m-1 K-1. The geothermal heat flux calculated from this value and the measured geothermal gradients is 58±3 mW m-2.
Keywords: Venetia diamond mine, mine refrigeration, rock temperature, geothermal heat flux
Introduction
Investigation of mine refrigeration and ventilation requirements depends on a knowledge of virgin rock temperature (VRT) and thermal properties of rocks involved in excavations. Studies of these parameters have been conducted on regional scales in the Witwatersrand gold mining areas and the Bushveld platinum mining areas (Jones, 2003a, 2003b, 2015), but few detailed studies have been conducted for individual mines. Venetia diamond mine is one example where virgin rock temperature has been studied in a thorough and systematic manner.
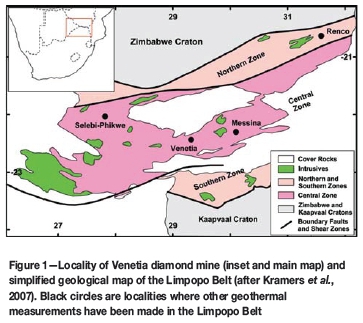
Venetia mine, situated in Limpopo Province in northern South Africa (Figure 1), is the country's largest producer of diamonds. There are 14 known kimberlite pipes in the area and two of them, K1 and K2, are currently being mined in the same open pit operation (Figure 2). Although the existence of alluvial diamonds near the Limpopo River was known as early as 1903, kimberlite pipes were discovered in only 1980. Mining commenced in 1992 and it is estimated that open pit mining can continue until approximately 2020. Beyond this date the life of the mine can most effectively be extended by underground mining. Extensive feasibility studies, including mine refrigeration investigations, during the last decade indicate that underground operations below the existing open pit will permit mining until approximately 2045. The underground project was launched in 2013.
The first detailed rock temperature measurements were made shortly after the mine opened, primarily for academic purposes, by the University of the Witwatersrand (Wits). More extensive surveys were conducted in 2006 during the feasibility stage of the underground project by a commercial company, GAP Geophysics (Pty) Ltd (GAP Geophysics) and subsequently by Wits in conjunction with De Beers Consolidated Mines Ltd (De Beers). The net result is a very detailed database of virgin rock temperatures and geothermal gradients, in 13 boreholes, to a depth of nearly 1000 m below surface. This database permits accurate estimation of rock temperatures as well as extrapolation to greater depths and plays an essential role in the estimation of mine refrigeration and ventilation requirements.
The primary purpose of this paper is to describe and discuss the borehole temperature database. The relevance of thermal conductivity measurements on similar rocks from the Limpopo Belt and kimberlite for mine refrigeration are also discussed. Finally, the data are used to make a new estimate for the geothermal heat flux in the area.
Geological background
Venetia mine is situated in the Limpopo Belt (Figure 1) whicl is situated between the Zimbabwe Craton to the north and the Kaapvaal Craton in the south(Kramers et al., 2007). The cratons consist essentially of relatively undeformed and weakly metamorphosed granite-greenstone terrains that hav undergone little tectonic activity since they stabilized at approximately 2500 Ma. In contrast, the Limpopo Belt is a broad zone of highly deformed and high-grade metamorphic rocks. It is separated from the cratons by prominent shear zones (Figure 1). Although radiometric ages exceeding 3200 Ma are preserved in some rocks, the belt underwent widespread tectonism approximately at 2650 Ma ago and again at approximately 2000 Ma. The Limpopo Belt is subdivided into a Southern Marginal Zone, a Northern Marginal Zone, and a Central Zone, in which Venetia is located (Figure 1). Like the boundaries of the Limpopo Belt with the cratons, these subdivisions are separated by major shear or fault zones.
Rocks constituting the Southern Marginal Zone are dominated by granitic gneisses, intermingled with metasediments and mafic-ultramafic rocks. The Northern Marginal Zone consists predominantly of granitic gneisses with minor mafic-ultramafic rocks (amphibolites) and some metasediments. Rocks constituting the Central Zone form a complex ensemble of gneisses of various composition, schists, and high-grade metasediments and amphibolites. Late tectonic and post-tectonic granitoid and/or syenite intrusions occur in all three zones, and much of the Limpopo Belt is buried beneath younger sedimentary and volcanic cover.
Rocks through which the Venetia kimberlite cluster was extruded are predominantly biotite gneiss, biotite schist, amphibolite, some quartzofeldspathic gneiss, and a younger Proterozoic diabase sill (Barton et al., 2003; Kurszluakis and Barnett, 2003, a detailed geological log of one of the boreholes investigated here, DDH132). These rocks are enveloped by medium- to high-grade metasedimentary rocks For the most part the country rocks discussed in this paper can be collectively referred to as 'granite gneiss'. The kimberlite pipes and their hypabyssal equivalents (intrusive dykes) were emplaced at approximately 520 Ma. The kimberlite is an ultramafic rock but occurs in a variety of forms, from massive volcaniclastic material to volcanic breccias that may include variable amounts of country rock fragments (Brown et al., 2009; Kurszluakis and Barnett, 2003).
Borehole temperature database
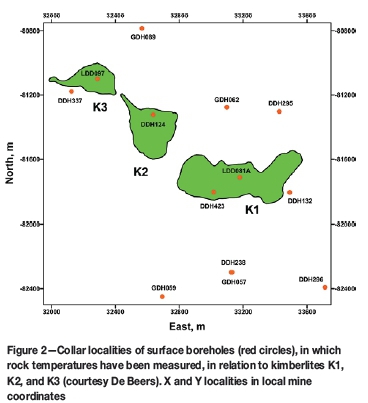
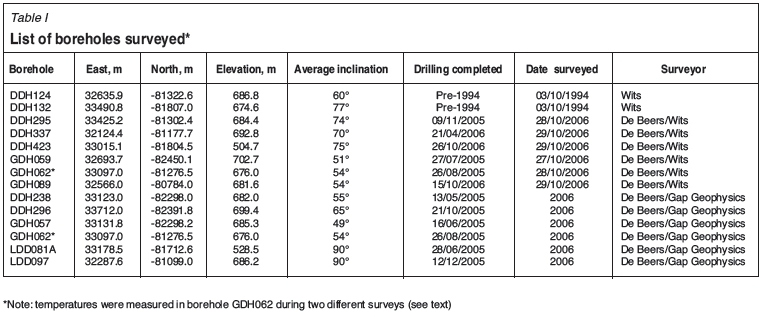
Temperature measurements were made during three separate surveys in 13 boreholes (one of which, GDH062, was surveyed twice) in and around kimberlites K1, K2, and K3 (Figure 2). The first survey was conducted in two boreholes in 1994, shortly after the mine opened, by Wits as part of a national scientific programme aimed at determining the heat flux through the Earth's crust in South Africa. More extensive surveys were conducted in 2006 during the feasibility stage of the Venetia underground project, firstly by GAP Geophysics on behalf of De Beers and subsequently by Wits in conjunction with De Beers. Table I lists important borehole parameters, including locality (in local mine coordinates), elevation in metres above mean sea level, and average dip as well as relevant details regarding drilling and survey dates and surveyors. Four of the holes are collared within the kimberlites and the rest in country rock surrounding the kimberlites.
Borehole temperature surveys
Temperature surveys conducted by Wits were made using a custom-made logging unit. The sensor, a temperature transducer, is housed in a watertight probe attached to an 800 m length of cable, surrounded by a stainless steel sleeve which serves to protect the conductor and minimize cable stretch during surveys. The probe is capable of withstanding hydrostatic pressures to depths exceeding 2000 m. The probe can detect temperature differences of as little as 0.005°C, and calibration experiments ensured that its accuracy is better than 0.05°C. Temperatures were measured at discrete depth intervals of 10 or 20 m along the holes after allowing the probe to equilibrate for two minutes at each depth. Depths were recorded using a calibrated depth counter attached to a pulley over which the cable runs and are estimated to be accurate to within 10 cm. Vertical depths below borehole collar were calculated from De Beers borehole survey data. Further details regarding the measurement procedures are given by Jones (1981, 1987).
Surveys conducted by GAP Geophysics were made using a commercial logging device. In these surveys, temperatures were recorded continuously, while the probe was being lowered down the boreholes, to the nearest 0.1°C. These measurements are therefore intrinsically less precise than, but as accurate as, the above measurements. Temperatures were determined at 20 m intervals along the holes from the digital output of the logger and depths were corrected for borehole inclination as above. Continuous temperature logging may lead to errors if the rate of probe descent is too rapid compared with the probe equilibration time constant. This does not appear to be a problem in these surveys. One of the boreholes logged by GAP Geophysics (GDH062, Table I) was subsequently logged by Wits and the results are within experimental uncertainty, the average difference in temperature at specific depths being less than 0.1°C.
Perturbations of underground temperatures
A number of factors can contribute to errors in determining equilibrium temperatures and thermal gradients. These can be categorized as those associated with the measurements themselves and those associated with environmental problems (Jones and Booysen, 2007).
Potential surveying-related issues include continuous logging, drilling transients, convection in boreholes and uncertainties in determining depth near the bottom of boreholes. The risks entailed in continuous logging are noted above. These can be minimized by ensuring that recordings are made while probes are descending and by careful survey design. Temperature measurements in boreholes shortly after cessation of drilling are subject to thermal transients. In theory it can take months for rock surrounding a borehole to re-equilibrate after drilling (Bullard, 1947), but in practice this appears to be achieved much sooner. All the boreholes surveyed at Venetia were filled with water or drilling fluid. This is actually important because probes take a long time to equilibrate in air, and measurements in dry holes often lead to erroneous results. Although this raises the question of convection in boreholes, this phenomenon appears to be significant only if thermal gradients are very high and borehole diameters are large (Diment and Robertson, 1963; Diment, 1967). It is often difficult to determine whether a probe has reached the bottom of a hole, particularly if the hole is deep and the probe is heavy, and whether true depths are being measured if the borehole inclination is small; measurements close to the base of boreholes can therefore be misleading.
Environmental factors include topography, surface temperature change, heat diversion due to lateral thermal conductivity contrasts, and heat transport by underground water flow. In regions of high relief, the flow of heat away from hills and towards valleys can perturb subsurface temperatures (Bullard, 1938), but this is unlikely to be significant at Venetia except perhaps in the upper 100 or so metres of two boreholes that are collared in the open pit. Temperature profiles in the upper 100-300 m in many boreholes in South Africa, and elsewhere, demonstrate a marked curvature that reflects a surface temperature increase of up to 2°C during the last 100-300 years. This is predominantly due to recent climate change (Jones et al., 1999) but may be exacerbated at Venetia because mining activities effectively increase ground surface temperature. Measurements in shallow holes should therefore be treated with caution. Non-vertical heat transfer in regions of complex geological structure involving rocks of different thermal conductivity may lead to significant perturbations in borehole temperature profiles. Corrections can be made for this effect but the work is tedious and time-consuming. Underground water flows through fissures or permeable lithologies intersected by boreholes constitute the most common cause of borehole temperature perturbations and sometimes render the data useless. Water flows may show up as fluctuating temperatures at particular depths during measurement, but otherwise can be difficult to identify. Water flows often reflect as spikes or discontinuities in temperature profiles and as irregular thermal gradients. Temperatures in affected zones should be discarded, and the data must be examined carefully in order to establish the extent to which temperatures and thermal gradients above the disturbances are affected.
Observations in individual boreholes
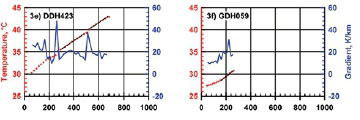
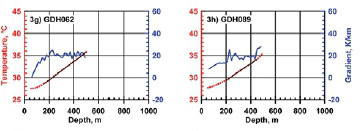
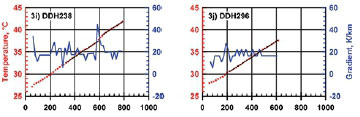
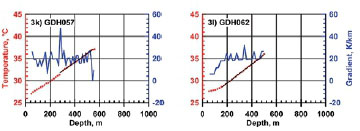
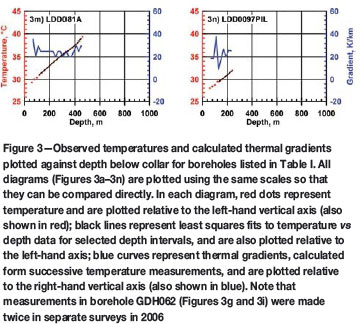
Temperature observations and calculated thermal gradients in each borehole are presented in Figures 3a-3n. The figures are arranged according to the temperature survey and borehole number as listed in Table I. In all these diagrams, temperature and thermal gradient are plotted against vertical depth below the borehole collar. The vertical and horizontal scales are identical so that the results can be compared directly. Red dots represent temperature measurements and refer to the left-hand vertical axes (also shown in red). Black lines are least squares fits to temperature-depth data in linear sections of the borehole profiles. Least squares parameters (intercept and slope) are listed in Table II. The blue curves represent calculated thermal gradients between successive temperature observations and are referred to the right-hand vertical axes (also shown in blue). Salient notes relating to each borehole are presented below and should be read with reference to Table I and Figure 3.
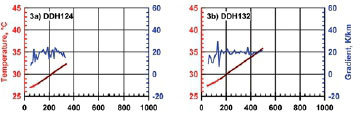
> DDH124 (Figure 3a) is collared in kimberlite but passes into country rock. Temperatures were recorded at 10 m intervals along the hole. The temperature profile shows a clear curvature, reflecting an increase in thermal gradient, at depth shallower than 120 m
> DDH132 (Figure 3b) is collared in country rock but penetrates kimberlite. Temperatures were recorded at 10 m intervals along the hole. The temperature profile shows a clear curvature above 120 m. The spike in geothermal gradient at approximately 140 m is almost certainly due to an aquifer
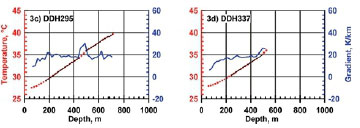
> DDH295 (Figure 3c) is collared in country rock but penetrates kimberlite. Temperatures were recorded at 20 m intervals along the hole. There is a clear curvature in temperature profile above 180 m. The sudden changes in thermal gradient at approximately 450-500 m are most probably due to water flow associated with diabase intersected at approximately this depth
> DDH337 (Figure 3d) is collared in country rock but penetrates kimberlite. Temperatures were recorded at 20 m intervals along the hole. The curvature in the temperature profile extends to approximately 220 m. The increased thermal gradient near the base of hole is associated with the occurrence of diabase and kimberlite
> DDH423 (Figure 3e) is collared in kimberlite in the open pit but penetrates country rock. Temperatures were recorded at 20 m intervals along the hole. The borehole may not have fully reached thermal equilibrium after drilling. Spikes in the thermal gradient at approximately 250-300 m and 490-520 m probably reflect water flows
> GDH059 (Figure 3f) is in country rock. Temperatures were recorded at 20 m intervals along the hole. This borehole is relatively shallow and the results are less reliable. There is a clear curvature in temperature profile above 160 m
> GDH062 (Figure 3g) is collared in country rock but penetrates kimberlite. Temperatures were recorded at 20 m intervals along the hole. This temperature survey was conducted by Wits; the hole was previously surveyed by GAP Geophysics (see below). There is a clear curvature in temperature profile above 170 m
> GDH089 (Figure 3h) is in country rock. The borehole may not have fully reached thermal equilibrium after drilling. Temperatures were recorded at 20 m intervals along the hole. There is a clear curvature in the temperature profile above 200 m. The reason for the increased thermal gradient at base of the hole is not known; it is possibly due to uncertainty in depth since the hole inclination at the base is only 50°
> DDH238 (Figure 3i) is predominantly in country rock. Temperatures were recorded continuously. There is a probable water flow associated with diabase at approximately 580-620 m
> DDH296 (Figure 3j) is predominantly in country rock. Temperatures were recorded continuously. There is a clear curvature in temperature profile above 180 m
> GDH057 (Figure 3k) is predominantly in country rock. Temperatures were recorded continuously. There is a probable water flow associated with a shear zone at approximately 290 m. The reason for the decreased thermal gradient at base of hole is unknown; it is probably due to uncertainty in depth since the hole inclination at the base is only 33°
> GDH062 (Figure 3l). See above. This first survey was conducted by GAP Geophysics. Temperatures were recorded continuously. The borehole may not have reached thermal equilibrium after drilling
> LDD081A (Figure 3m) is collared in the open pit. It is in kimberlite. Temperatures were recorded continuously. The thermal gradient is higher than in most previous boreholes.
> LDD097PIL (Figure 3n) is in kimberlite. Temperatures were recorded continuously. It is a relatively shallow borehole and the results are less reliable. The thermal gradient is higher than in most previous boreholes.
Discussion of virgin rock temperatures
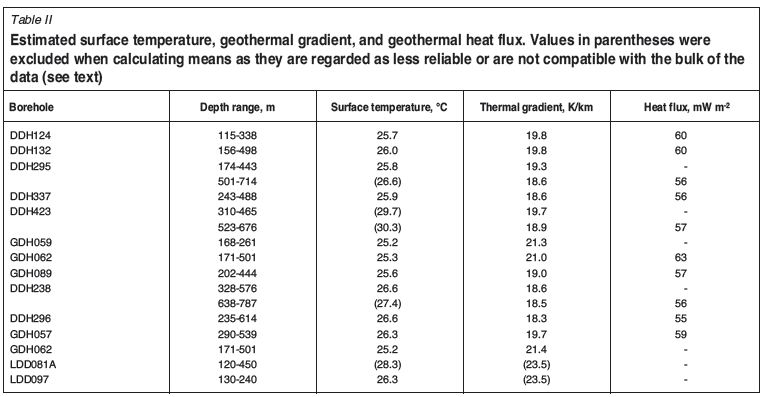
The individual plots in Figure 3 are useful for assessing the data quality, identifying depth intervals with uniform geothermal gradient, and determining least squares parameters relating temperature to depth. Table II lists depth ranges characterized by linear trends in each borehole along with the least squares intercept (or extrapolated surface temperature) and slope (or average thermal gradient).
With the exception of boreholes DDH423 and LDD081A, which are collared in the open pit, the surface temperatures fall in a relatively narrow range (Table II). If the data from these two holes and estimates from the deeper sections of DDH295 and DDH238 (which yield less reliable surface temperature estimates purely because of the depth of the data) are excluded, the mean surface temperature is 25.9±0.5°C (12 values). This is the 'ground surface temperature' for the average collar elevation of the boreholes (except for holes DDH423 and LDD081A), 686±9 m (12 values) (Table I). This temperature is approximately 4°C higher than the mean annual air temperature for the region (the nearest weather station, Alldays, yields a value of 22.1°C for the period January 1999 to December 2002) because excess heat is carried into the ground in summer rainfall regions.
The least squares thermal gradients (column 4, Table II) are relatively uniform except for LDD081A and LDD097PIL, which are significantly higher. This may partly reflect the fact that these holes are in kimberlite. The remaining data average at 19.5±1.0 K/km (15 values).
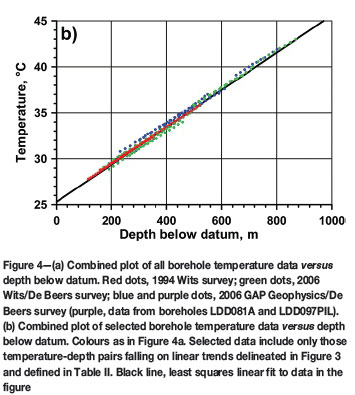
In order to illustrate the regional trend more clearly, individual temperature observations and calculated thermal gradients are plotted in combined diagrams in Figures 4 and 5. This is not possible using depth below collar, because boreholes DDH423 and LDD081A are collared in the open pit approximately 160-180 m below the remaining boreholes. The recorded temperatures at given depths below collar in these two boreholes are therefore offset to higher temperature by approximately 4°C compared with the other holes (see Figures 3e and 3m). The easiest way to correct for this is to plot the data relative to the local datum elevation (696 m above sea level). This procedure has the added advantage in that it directly yields the mean temperature of a particular mining level measured in metres below datum.
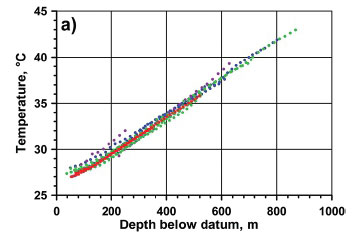
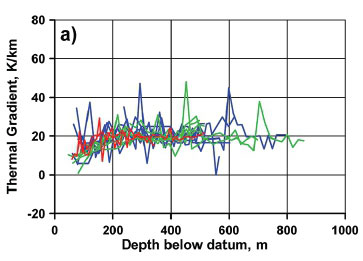
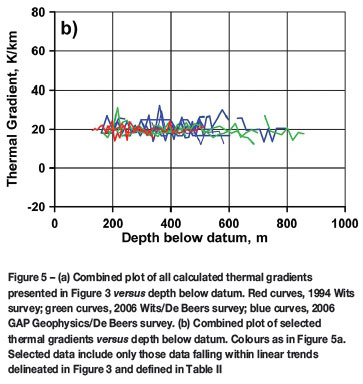
The combined temperature plot using all the data is presented in Figure 4a and the corresponding thermal gradient plot is shown in Figure 5a. These diagrams show the regional trends reasonably well but reveal considerable noise. This is partly due to the climatically and/or mining induced curvature in the upper 200 m of most boreholes and partly to disturbances associated with underground water flow (Figures 3a-3n). As noted above, data from boreholes LDD081A and LDD097PIL also do not match the trends defined by the rest of the data-set (Table II).
Figure 4b was constructed using only those data that define linear trends (Figure 3, Table II) and excluding data from LDD081A and LDD097PIL. The scatter is considerably reduced compared with Figure 4a. There is also far less noise in the corresponding geothermal gradient plot (Figure 5b), which shows that the gradients are close to 20 K/km. The least squares regression line to the data in Figure 4b is T(x) = 25.3 + 20.1x, where T is in degrees Celcius and x is in kilometers below datum. This line provides a direct way of calculating temperature at different levels in underground workings at Venetia. It can also be used with confidence for extrapolating to greater depth provided there are no significant vertical changes in rock type.
Thermal conductivity
A knowledge of the thermal conductivity (K, units W m-1 K-1), density (p, kg m-3), heat capacity (C, J kg-1 K-1), and the derived parameter thermal diffusivity (κ = K/pC, mm2 m-1) is important for transient calculations involving heat flux into underground workings. Unfortunately there are no data from Venetia mine, but estimates can be made based on measurements from other localities or published values.
Typical density ranges for the rocks discussed here are: amphibolite, 2900-3100 kg m-3; diabase, 2800-3100 kg m-3; kimberlite, 2400-3000 kg m-3; granite gneiss, 26002900 kg m-3; schist, 2400-2900 kg m-3. The ranges are quite large, but accurate values are easy to obtain because measurement of density is relatively quick and simple. Heat capacity is relatively uniform for most silicate rocks. For example, average values for various rock types in the Witwatersrand gold mining area fall in the range 810880 J kg-1 K-1 (Jones, 2003b) and the range of averages for volumetrically important rocks associated with platinum mining in the Bushveld Complex is 820-870 J kg-1 K-1 (Jones, 2015); a value between 800 and 1000 J kg-1 K-1 will suffice for most calculations.
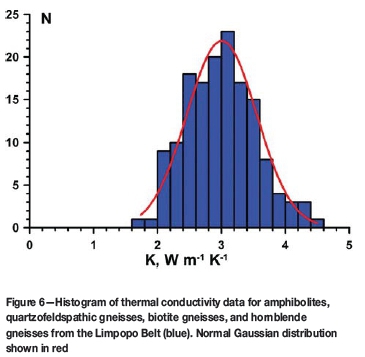
Thermal conductivity is the most variable parameter and has the greatest influence on thermal diffusivity. Numerous measurements have been made, on rocks of similar composition and metamorphic grade to the granite gneisses and associated rocks at Venetia, at three localities in the Limpopo Belt (Figure 1), namely Selebe-Phikwe (Ballard, 1987; Ballard et al., 1987; M.Q.W. Jones, unpublished data, 2015), Messina (Carte, 1954; M.Q.W. Jones, unpublished data, 2015) and Renco (Nyblade, 1992; Nyblade et al., 1990). Figure 6 shows a histogram of 150 analyses conducted on amphibolite, quartzofeldspathic gneiss, biotite gneiss, and hornblende gneiss. The distribution is nearly Gaussian and the mean thermal conductivity is 3.01±0.55 W m-1 K-1. Data for kimberlite are sparse; Ballard (1987) gives a value of 1.9±0.2 W m-1 K-1 on the basis of five measurements, and 21 unpublished measurements by the author yield an average of 1.88±0.21 W m-1 K-1 (M.Q.W. Jones, unpublished data, 2016).
Geothermal heat flux
The borehole temperature data provides the opportunity to estimate the heat flux through the Earth's crust at Venetia. At the surface this parameter is given by Fourier's Law of heat conduction: (¾ = K(dT/dx)0where (dT/dx)0 is the near-surface equilibrium thermal gradient and K is the average thermal conductivity of near-surface rocks.
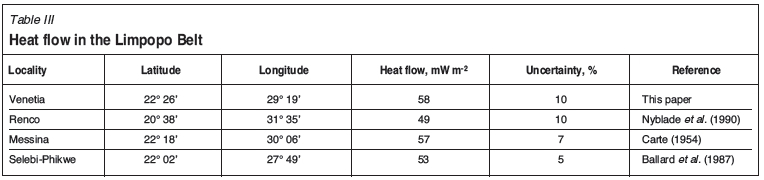
Heat flux values, found by multiplying the average thermal conductivity for country rock (3.01 W m-1 K-1) by the least squares thermal gradients in Table II, are listed in column 5 of the table. Two boreholes, LDD081A and LDD 097PIL, are entirely within kimberlite and have not been used. GDH059 is quite shallow and its value is regarded as less reliable; it has been excluded from further analysis. Deeper borehole data generally lead to more reliable heat flow estimates, and only the deeper sections of DDH295, DDH423, and DDH238 are used here. The second heat flow estimate for borehole GDH062 is really a repeat measurement (Table II) and only the first estimate is used. The average heat flux for Venetia is thus determined as 58±3 mW m-2 (10 values). Because of the absence of conductivity data from Venetia, the estimated percentage error is increased to 10%. The heat flow from Venetia is compared with previous heat flow measurements in the Limpopo Belt in Table III. The results are compatible and the overall heat flow from the Belt is 54±4 mW m-2. This is substantially higher than that in the adjacent cratonic regions (Figure 1) and has important geodynamic implications which will be discussed elsewhere.
Conclusions
Comprehensive borehole temperature surveys at Venetia mine shortly after opening of the mine and during the feasibility phase of the underground project permit detailed analysis of local rock temperature variations. Temperature disturbances associated with environmental factors such as climate change and underground water flow are clearly evident in the database. After removal of such noisy data and outliers, the database yields consistent values for the ground surface temperature, underground thermal gradients, and a linear relationship between virgin rock temperature and depth below local datum. These data are important for refrigeration studies of currently planned underground workings and potentially useful for future extrapolation to greater depth. Thermal conductivity data from country rock of similar composition and metamorphic grade to those encountered at Venetia and on kimberlites permit estimates for rock properties in calculating heat loads on underground workings. The thermal gradients, together with thermal conductivity data, yield a new estimate for the heat flux through the Earth's crust.
Acknowledgements
I am grateful to De Beers Consolidated Mines Ltd for logistical and financial support for surveys conducted by Wits, for providing essential data, and for permission to publish this paper, which would not have been possible without De Beers' thorough feasibility study. Jannie Booysen organized the Wits/De Beers surveys in 2006 and played a big part in making the field measurements. Jay Barton likewise assisted in the 1994 surveys. Geoff Campbell provided useful information regarding the 2006 GAP Geophysics surveys. The author is grateful to Terence McCarthy and two anonymous reviewers for useful comments.
References
Ballard, S. 1987. Terrestrial heat flow and thermal structure of the lithosphere in southern Africa. PhD thesis, University of Michigan, Ann Arbor, USA. 140 pp. [ Links ]
Ballard, S., Pollack, H.N., and Skinner, N. 1987. Terrestrial heat flow in Botswana and Namibia. Journal of Geophysical Research, vol. 92. pp. 6291-6300. [ Links ]
Barton, J.M., Barnett, W.P., Barton, E.S., Barnett, M., Doorgapershad, A., Twiggs, C., Klemd, R., Martin, J., Mellonig, L., and Zenglein, R. 2003. The geology of the area surrounding Venetia kimberlite pipes, Limpopo Belt, South Africa: a complex interplay of nappe tectonics and granitoid magmatism. South African Journal of Geology, vol. 106. pp. 109-128. [ Links ]
Brown, R.J., Tait, M., and Sparks, R.S.J. 2009. Geology of a complex kimberlite pipe (K2 pipe, Venetia Mine, South Africa): insights into conduit processes during explosive ultrabasic eruptions. Bulletin of Volcanology, vol. 71. pp. 95-112. [ Links ]
Bullard, E.C. 1938. The disturbance of temperature gradient in the Earth's crust by inequalities of height. Monthly Notices of the Royal Astronomical Society, Geophysics Supplement, vol. 4. pp. 360-362. [ Links ]
Bullard, E.C. 1947. The time necessary for a borehole to attain temperature equilibrium. Monthly Notices of the Royal Astronomical Society, Geophysics Supplement, vol. 5. pp. 127-130. [ Links ]
Carte, A.E. 1954. Heat flow in the Transvaal and Orange Free State. Proceedings of the Physical Society of London, Series B, vol. 67. pp. 664-672. [ Links ]
Diment, W.H. 1967. Thermal regime of a large diameter borehole: instability of the water column and comparison of air- and water-filled conditions. Geophysics, vol. 32. pp. 720-726. [ Links ]
Diment, W.H. and Robertson, E.C. 1963. Temperature, thermal conductivity and heat flow in a drilled hole near Oak Ridge, Tennessee. Journal of Geophysical Research, vol. 68. pp. 5035-5047. [ Links ]
Jones, M.Q.W. 1981. Heat flow and heat production studies in the Namaqua Mobile Belt and Kaapvaal Craton. PhD. Thesis, University of the Witwatersrand, Johannesburg. 319 pp. [ Links ]
Jones, M.Q.W. 1987. Heat flow and heat production in the Namaqua Mobile Belt, South Africa. Journal of Geophysical Research, vol. 92. pp. 6273-6289. [ Links ]
JoNES, M.Q.W. 2003a. An update in virgin rock temperature analysis of the Witwatersrand Basin. Journal of the Mine Ventilation Society of South Africa, vol. 56. pp. 107-112. [ Links ]
JoNES, M.Q.W. 2003b. Thermal properties of stratified rocks from Witwatersrand gold mining areas. Journal of the Southern African Institute of Mining and Metallurgy, vol. 101. pp. 173-185. [ Links ]
Jones, M.Q.W. 2015. Thermophysical properties of rocks from the Bushveld Complex. Journal of the Southern African Institute of Mining and Metallurgy, vol. 115. pp. 153-160. [ Links ]
Jones, M.Q.W. and Booysen, J. 2007. Rock temperature and thermal gradient. MHSC Handbook on Mine Occupational Hygiene Measurements. Stanton. D.W., Kielblock, J.J., and Johnston, J.R. (eds.). Mine Health and Safety Council, Johannesburg. pp. 237-245. [ Links ]
Jones, M.Q.W., Tyson, P.D., and Cooper, G.R.J. 1999. Modelling climatic change in South Africa from perturbed borehole temperature profiles. Quaternary International, vol. 57/58. pp. 185-192. [ Links ]
Kramers, J.D., McCourt, S., and Van Reenen, D.D. 2007. The Limpopo Belt. The Geology of South Africa. Johnson, M.R., Anhaeusser, C.R., and Thomas, R.J. (eds.). Geological Society of South Africa/Council for Geoscience, Johannesburg/Pretoria. pp. 209-236. [ Links ]
Kurszlaukis, S. and Barnett, W. 2003. Volcanological and structural aspects of the Venetia kimberlite cluster - a case of South African kimberlite maar-diatreme volcanoes. South African Journal of Geology, vol. 106. pp. 145-172. [ Links ]
Nyblade, A.A. 1992. Terrestrial heat flow in east and southern Africa and the thermal structure of Precambrian lithosphere. PhD thesis, University of Michigan, Ann Arbor, USA. 165 pp. [ Links ]
Nyblade, A.A., Pollack, H.N., Jones, D.L., Podmore, F., and Mushayandebvu, M. 1990. Terrestrial heat flow in east and southern Africa. Journal of Geophysical Research, vol. 95. pp. 17,371-17,384. [ Links ]
Paper received May 2015
Revised paper received Jul. 2015
© The Southern African Institute of Mining and Metallurgy, 2016. ISSN 2225-6253.

