


Services on Demand
Article
 English (pdf)
 Article in xml format
 Article references
Indicators

Related links
-
 Cited by Google
 -
 Similars in Google
Share

 Permalink
Journal of the Southern African Institute of Mining and Metallurgy
On-line version ISSN 2411-9717
Print version ISSN 2225-6253
J. S. Afr. Inst. Min. Metall. vol.116 n.1 Johannesburg Jan. 2016
http://dx.doi.org/10.17159/2411-9717/2016/v116n1a1
PAPERS - FURNACE TAPPING CONFERENCE
Tap-hole monitoring technologies
W. Braun; P. Gebski; R. MacRosty; R. Pula; A. Sadri; W. Ying
Hatch, Limited
SYNOPSIS
This paper provides a progress update on three tap-block monitoring technologies that Hatch has been developing with our clients for non-ferrous smelting furnaces. The Tapblock Diagnostic System (TDS) is an advanced on-line monitoring system that uses temperature data along with embedded thermal model results to evaluate the condition of a tap-block over its campaign life. Hatch recently installed a second TDS and this paper provides some details on this second installation. The Taphole Acoustic Monitoring (TAM) system is installed on water-cooled copper tap-blocks and uses the noise from the tapping channel to provide a qualitative indication of wear and deterioration of the tapping channel refractory. In addition, TAM can be used to monitor drilling and lancing performance and potentially could also be used in the future as a guide for automatic drilling and lancing systems. The third technology is the use of fibre optic sensors to measure temperature on the hot face and in the tapping channel of a tap-block. Fibre optic technology allows installation of numerous sensors in key locations where they are very sensitive to tap-block condition, and also provide more extensive spatial coverage than is possible with traditional instruments. This paper provides an update on our efforts to address issues with premature failure of the sensor cables due to corrosion, and also to turn the vast amount of data from the sensor cable into information that can be used by furnace operators.
Keywords: Tap-block, furnace, fibre optic temperature measurement, tap-block diagnostics, condition monitoring, thermal modelling, refractory condition
Introduction
Electric arc smelting furnaces contain highly intensive processes to smelt the charge and retrieve the metal content. The challenge with the furnace is to keep the molten material and the slag safely contained inside the crucible, and this requires plant staff to monitor and maintain the furnace and associated equipment very carefully. The tap-block is the fastest wearing component of the furnace and as a result requires a maintenance programme. The aim of the technologies described in this paper is to obtain reliable measurements from the harsh environment inside and around the furnace and to interpret the measurement data so that the plant staff can make informed decisions early enough to maintain safe and reliable operation of tap-blocks.
Hatch is a major supplier to the platinum and nickel industries, where a tap-block consists of a 1 m3 block of copper lined with approximately 300 mm of ceramic refractory. The copper block is water-cooled internally with an intricate pattern of channels. During tapping, the flow of molten metal or slag through the tap-block gradually erodes the refractory and if the refractory is not maintained correctly, an uncontrolled tap can result. This is obviously very dangerous for operators. Equipment may also be damaged during an uncontrolled tap, resulting in extremely costly repairs and a lengthy maintenance downturn. Hence, the tap-block must be maintained regularly. The plant personnel usually rightly take a conservative approach and maintain the tap-block frequently to reduce the risks of an uncontrolled tap. Better monitoring enables a condition-based maintenance plan, thereby enabling the tap-block to be safely maintained and keeping production losses to a minimum.
The development of the tap-block monitoring systems described in this paper is driven by the desire for a real-time monitoring system.
Tap-hole acoustic monitoring
Background
An acoustic monitoring system for assessing the condition of the refractory lining in a tap-block was developed in close cooperation with Kennecott Utah Copper (KUC). The Taphole Acoustic Monitoring system, or TAM, makes use of acoustic emission events from the tap-block to evaluate the condition of the refractory lining and copper within the block. The prototype TAM system was installed on two KUC tap-blocks for continuous monitoring. A detailed description of TAM can be found in Gebski et al. (2013).
Development and installation
The TAM software processes and displays data from a set of acoustic emission (AE) sensors installed around the tap-hole, typically on the cooling water pipes. Using these pipes as waveguides implies that the computed location of an AE event is always related to a specific position along the cooling coil. This is converted to a particular location in the nearest brick in the tapping channel. However, technically this is not a 3D source location algorithm. The 3D presentation of the results is added only to simplify the interpretation. A potential enhancement to this design would be the installation of specially designed waveguides to improve the sensitivity of the AE sensors. This would also allow use of the actual 3D source location algorithm for evaluating the damage in the tap-block. In either case, the AE signal is transferred from the sensors via preamplifiers to the processing unit.
There are numerous sources of AE around a tap hole. In general, AE is defined as high-frequency elastic waves generated with a material. These are detected and converted to electrical signals. The TAM system aims at detecting the signals related directly to the deterioration of the tap-hole brick inserts in the copper block. This degradation of the tap-hole bricks occurs as a result of the flow of molten material (when the bricks are exposed to a high temperature and corrosive environment) and during the lancing or drilling through the tap-hole. The AE activity (understood as the occurrence of the acoustic events) and AE intensity (defined as the strength of the AE signals) are analysed. The activity is linked to the location of the AE source within the tap-hole, while the intensity translates to the severity of the related damage. The intensity is measured by the signal amplitude and energy, as well as the number of acoustic events. The high-amplitude and high-energy events indicate severe damage to the brick inserts. During lancing or drilling, if similar AE activity is measured at the top, bottom, left, and right sections of the tap-hole then it means that the lancing or drilling was done at the intended location and at the desired angle. If the acoustic activity is shifted towards one area (more events are generated from a specific area) then it indicates damage to that specific zone.
It is important to emphasize the need for calibration of the TAM system for each tap-hole. The first part of the calibration is done during the installation of a new tap-hole brick inserts. Calibrated mechanical impactors are used to generate AE sources at known locations within the block. The system parameters, including the wave speed and the warning and alarm levels, are established through this process. The second stage of the calibration must be done during normal operation of the furnace. One outcome of the calibration process is the noise level. The system thresholds and filters must be programmed accordingly in order to remove the irrelevant data. The noise will typically be related to the flow of the cooling water and other normal operations around the tapping area.
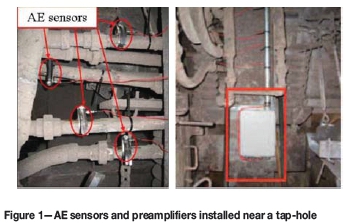
An example installation of selected TAM components is shown in Figure 1. The required number and the optimal type of sensors are determined individually for each tap-hole based on its design and through a calibration process. At KUC, four AE sensors were installed on the cooling pipes. The drilling and lancing activities cause acoustic emissions which travel through the refractory and cooling pipes to the sensors.
In the design of the TAM system, it was critical that both the furnace operators and the personnel on the tapping floor be able to respond accordingly to the TAM's feedback. The design included a human-machine interface (HMI) screen for furnace operators and a light pole near the tap-block for personnel on the tapping floor. Figure 2 shows the main operator screen with a frontal view of a tap-block divided into twelve zones, i.e. four zones on the left, four at the bottom, and four on the right.
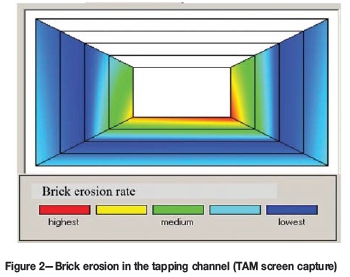
Depending on the difference in time in arrival time at the four sensors, the source of the AE can be localized to one of the twelve zones. The operator screen gives a qualitative indication of the copper or brick erosion rate in the tapping channel, or indicates off-centre lancing or drilling based on the number and intensity of AE events detected in each zone.
The image presented in Figure 2 shows a higher rate of brick erosion in the bottom right section of the block towards the hot face. This parameter is measured and updated on the screen frequently to show which area of the block is currently most affected, allowing lancing and drilling performance to be displayed in real time.
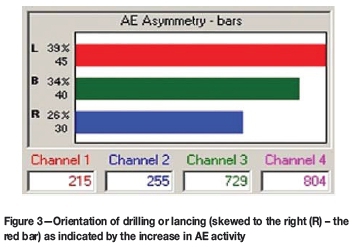
Optimal drilling should result in a uniform distribution of the AE signals detected in the left, right, and bottom sections of the block. Skewed drilling or lancing is detected by an unequal distribution of AE signals as shown in Figure 3, where the drilling and lancing activity is skewed to the right. These results displayed on the screen in the control room and on the tapping floor light pole allow the tapper to take corrective actions and avoid damaging the tap-block. The recorded data is also archived and over the long term it provides trends regarding the tapping practices and the resulting deterioration of the tap-block. This in turn helps to improve the maintenance schedule and to develop optimized tapping routines.
Case study: off-centre lancing
Within the first several months of operation, the TAM system performance and reliability was validated by several incidents, one of which is discussed below.
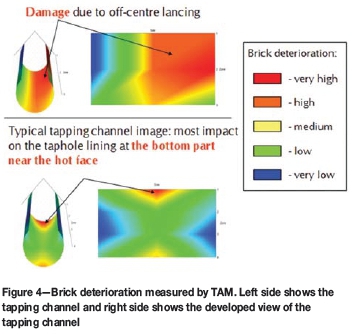
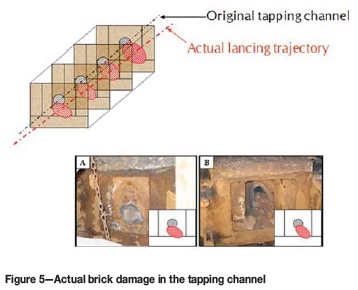
Due to off-centre lancing of a tap-hole, the refractory inserts were severely damaged. Towards the hot face, the hole was drilled approximately 7.6 cm (3 inches) lower than normal and oriented to the right side of the tap-hole. The opening was as close as 2.5 cm (1 inch) from the copper block. The reduction in refractory thickness resulted in less attenuation of the AE signals compared to normal. The locations of the high acoustic intensity zones identified by TAM within the tapping channel are shown in the top part of Figure 4. For comparison, the lower part of Figure 4 shows the acoustic intensity map during normal operation. Clearly, the off-centre lancing results in a cluster of high-intensity AE signals towards the right side of the tapping channel near the hot face. When the refractory inserts were removed, the inspection revealed erosion of the bricks in the area identified by TAM. The most damaged areas were found on the right and bottom of the tapping channel as shown in Figure 5.
Summary ofacoustic monitoring
During the initial two years of operation, the TAM system proved its capability of providing real-time monitoring of tap-holes. In summary:
1. TAM provides a means to reduce the risk of off-centre drilling and lancing to extend the lifespan of a tap-hole
2. The sensors can be retrofitted to a tap-block already in service
3. Although the TAM system can be used for long-term continuous monitoring of tap-hole deterioration, it also provides instant indication of faulty lancing and drilling practices
4. The acoustic emissions are recorded and analysed throughout the furnace operations to monitor for any events related to a potential tap-block breakdown. This includes lancing, drilling, tapping, and the periods when a tap-block is plugged
5. TAM may provide feedback for future automatic drilling and lancing systems.
Fibre optic temperature monitoring for tap-blocks
Background
Several years ago, Hatch introduced fibre optic temperature sensing technology to enhance tap-block monitoring (Gerritsen et al., 2009). This technology, which uses light to measure temperature, was invented decades ago but has more recently found application in industry. The basic principle of operation is that an etched pattern on the core of a fibre optic strand will reflect light at a specific wavelength. The etched pattern changes with temperature such that the wavelength of the reflected light is proportional to the temperature change. Like any temperature sensor, the response to changes in temperature is calibrated to provide absolute temperature measurements.
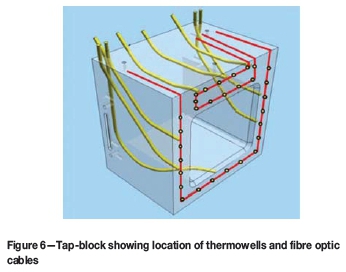
Prior to the use of fibre optics, the best practice to evaluate tap-block condition was a combination of thermocouples to monitor spot locations in the copper and resistive temperature devices (RTDs) and flow meter measurements to monitor the overall heat flux from changes in water temperature. The key benefits of the fibre optic temperature sensors are the small size of the fibre and the ability to install many sensors along a single fibre optic strand. In the case of the tap-block, the fibres are installed across the hot face, on or just below the surface of the copper. Figure 6 shows an example of an installation with two fibre strands (in red) on the copper surface. Sensors are typically spaced at 50-100 mm intervals over the regions of interest. A typical installation will involve the addition of 50 fibre optic sensors per tap-block. In contrast, the yellow tubes show a typical thermowell arrangement where this tap-block can accommodate only eight thermocouples.
In addition to the benefits of increased spatial coverage, the small diameter of the fibre allows the sensors to be located such that sensitivity and longevity can be optimized. In general, the closer the sensors are positioned to the molten bath, the greater the response to changes in refractory thickness. However, in order to ensure survival the sensors need to be located on or inside the copper face to protect them from excessive heat and corrosion.
Installation challenges
In the original installation design in 2009, an alloy tube was used to protect the fibre optic sensor cable. The tube is mounted onto the copper surface and shielded from the bath by refractory. This design works well in furnaces that do not suffer from corrosion, as it provides excellent sensitivity to changes in refractory thickness.
In the installations in South Africa, this design did not work well due to the high rates of corrosion. Even though the alloy tube is corrosion resistant, the temperature readings became unreliable after a period of approximately six months due to the corrosion of the alloy tube. Surprisingly, the fibre cable remained intact even after the protective tube was corroded away.
During the subsequent installation in 2012, several changes were made to the design to increase corrosion resistance. The objective was to increase the life of the sensor and keep it on the surface of the copper to ensure the sensitivity to changes in refractory were maintained. To do this, the corrosion allowance was substantially increased by installing the fibre optic cable in a bar of larger cross-section. While the alloy used in the bar design was similar to the tube alloy, the specific grade was further refined, based on the corrosion mechanisms at the copper-refractory interface.
The bar design lasted substantially longer than the tube design in these furnaces. In most locations it lasted the full year-long campaign. On one of the tap-blocks, in the chamfer area (just above the tap-hole on the hot face) the sensor was still compromised towards the end of the campaign. In terms of longevity, the installation was more successful. However, there were some issues with consistency of measurements between different tap-blocks, which made translating the temperature into refractory condition difficult.
In 2013, two new designs were implemented. The first design is a modified sensor bar where pockets are machined into the surface of the tap-block so as to slightly recess the sensor bar. The pocket and sensor bar surfaces are also machined to a high tolerance to ensure that there is excellent thermal contact between them. Better contact and cooling of the sensor bar will improve both measurement consistency and corrosion resistance. A corrosion-resistant coating was also applied to the sensor bar. The thermal conductivity of the coating is equivalent to the thermal conductivity of the castable refractory, and so it is thermally indistinguishable.
The second design implemented in 2013 involves casting the protective tubes into the copper block. This has clear advantages with respect to protecting the tube from corrosion. Consultation with the designers of the tap-block was crucial to ensure the heat removal capability of the tap-block was not compromised by the addition of the sensor tube. Another important consideration is positioning the tubes to maximize sensitivity to changes occurring on the hot face. This involves a trade-off to keep the protective tubes as far as possible from the water pipes, but still embedded deep enough to avoid the risk of exposing the tube through the hot face during the casting process or subsequent corrosion.
After the tap-block was fabricated, ultrasonic testing (Sadri et al., 2009) was carried out to confirm the position of sensor tube relative to the water pipes and hot face of the tap-block. This was essential to confirm that the tubes had not shifted during the casting process, for the following reasons:
1. The tubes must be a minimum distance from the hot face
2. The relative location of the tubes with respect to the copper hot face surface and the water pipes greatly affects the ability to determine refractory condition from the temperature reading.
Both of these systems were installed in June 2013 and are currently being evaluated. This paper was written relatively early in terms of the planned two-year campaign, but both designs were performing well.
Relating measurements to tap-block condition
Once installed, the sensors greatly increase the monitoring capability on the tap-block. However, the full value of these measurements cannot be realized unless one can interpret the data. For example, it is difficult to understand the significance of a 10°C change unless it can be put into context and related to the refractory wear on the tap-block.
Experience is used to establish the relationship between temperature and condition. The challenge with this approach is that the hot face of the tap-block can be fully inspected only when the tap-block is removed from the furnace, typically after one to two years. The slow rate of feedback limits the value of this approach. The approach that has been followed is to use thermal modelling to establish a matrix of conditions and corresponding temperatures in order to be able to predict the condition of the tap-block. Brick repairs in the tapping channel, which take place every few weeks, allow more frequent feedback to gain confidence with using the thermal modelling approach.
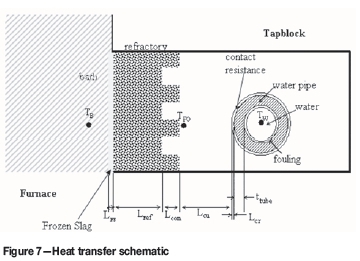
A basic cross-section through a tap-block is shown in Figure 7. Using knowledge of the properties of the materials and the temperature of the bath and water, it is possible to compute the expected measured temperature (TFO) using heat transfer relationships.
The tap-block condition can be evaluated by characterizing the refractory profile over the life of the tap-block (from new to fully worn) and using the model to calculate the associated temperatures at each location. The geometry of the tap-block necessitates the use of three-dimensional models. Transient analysis is also important to understand how the temperatures respond temporally to tapping events. Computational fluid dynamics (CFD) software such as ANSYS Fluent can be used to develop the models and simulate the heat transfer throughout the block.
Thermal modelling
The challenge, as is the case with any model, is ensuring it provides a good match to the process and is therefore able to provide realistic predictions of conditions. Preparing the model is relatively straightforward using the detailed CAD designs of the equipment and the material properties. Determining the boundary conditions for the model is a more challenging task, since in many cases these parameters are not measurable and can change over the life of the tap-block. These parameters must either be established from plant data (such as cooling water temperature, bath temperature) or from the experience of experts in the field (such as the refractory wear profiles). By establishing the relative significance of these parameters for the accuracy of predictions through a sensitivity analysis, it is possible to characterize the impact of the uncertainty in each parameter.
A sensitivity analysis was conducted using the thermal model by varying model parameters within their expected range of variation. For example, bath temperature would not be expected to vary more than ±150°C around the target temperature. From this sensitivity analysis the most significant factors impacting the temperature measured at the copper-refractory interface, in order of impact on the measured temperature, are:
1. Refractory thickness
2. Tap-block thermal resistance
3. Thermal conductivity of refractory
4. Cooling water supply temperature.
Other variables, such as the bath temperature and the bath convection coefficient, were shown to have a fairly limited influence on the measured temperature. Refractory thickness is the variable of most interest for the purpose of establishing the condition of the tap-block. It is a fortunate result of the sensitivity analysis that the refractory thickness has the greatest impact on the measured temperature. Another fortunate result is that the impact of the uncertainty associated with all these parameters decreases as the thickness of refractory decreases. Consequently, when there is little refractory remaining, the measured temperature is almost completely governed by the refractory thickness. This makes the estimate of refractory thickness from temperature data most accurate when the refractory is thin and the results are needed the most.
The effective thermal resistance of the tap-block is defined as the measured thermal resistance between the water and the sensor. It is our experience that the effective thermal resistance tends to be higher than the theoretical value (as determined using theoretical values for the thermal conductivity of the relevant components) and can vary due to location. Most likely this is due to bonding resistance between the water pipes and copper and any scale build-up in the cooling pipes. Thermal modelling studies have shown that ignoring this effect can create significant errors in the prediction of remaining refractory from temperature data. The effective tap-block thermal resistance is unique for each tap-block and sensor location, and ideally should be measured. The bump test described in the section on the Tapblock Diagnostic System describes a method that has been developed to measure the tap-block thermal resistance in the field.
The thermal conductivity of refractory material is known to vary around the manufacturer's specifications. An error in this value will impact the accuracy of the refractory thickness estimate by 1% for every 1% error in the thermal conductivity. Ideally, the thermal conductivity of refractory installed in key locations should be established to within several per cent. To fully understand the thermal conductivity of the refractory, one needs to determine the degree of impregnation from the metal/matte and how this changes with time. Measuring the degree of impregnation at every repair opportunity would enable a better understanding of the change in conductivity as a function of throughput.
The inlet cooling water temperature also has a significant impact on the temperature measured by the sensors. For every 1°C change in water temperature, most sensors will experience a 1°C change. This can greatly bias refractory thickness estimates because the cooling water temperature can vary by several degrees over a single day, and even more over the different seasons of the year. Fortunately, these variations can be eliminated from the fibre optic temperature measurements by measuring the inlet water temperature and subtracting the variations.
Evaluation of temperature measurements
Figure 8 shows the measured temperature response of one of the fibre optic sensors to a sequence of tapping events. This sensor is physically located on the copper hot face above the tapping channel in the centre of the tap-block. The vertical black lines show the tapping events. The green, yellow, and red lines show the expected steady-state tapping temperatures for that sensor for a new, half worn, and fully worn refractory condition.

Several interesting observations can be made from the measured temperature data in Figure 8:
1. Installation of the sensor at the copper-refractory interface provides very good sensitivity to changes in refractory thickness. This expected temperature at this particular sensor covers a range of over 60°C as the refractory deteriorates from a new to fully worn condition. In contrast, thermocouples embedded in the copper may show only 2-3°C increase for the same change in refractory condition from new to fully worn. The increase in sensitivity provided by the surface-mounted sensor greatly enhances the ability to discern a change in the condition of the refractory and confidence in the results
2. The delayed response following the start of the tap is consistent with the refractory's low conductivity and the slow absorption of the energy from the molten material. It is also evident that the temperature continues to rise at the copper-refractory interface after tapping ceases as a result of the energy stored in the refractory (see times between 20:00 and 21:00 in Figure 8). The transient response of the temperature reading is directly related to the amount of refractory. Work is currently under way to develop a relationship between the transient temperature response and the refractory thickness. It is necessary to have an understanding of this relationship for smelting operations that tap occasionally and where the tap-block never reaches thermal equilibrium, as shown following the first two taps in Figure 8
3. Shortly after 23:00, it can be observed that with subsequent tapping there is no associated increase in the temperature above 80°C. This is defined as the steady-state condition for continuous tapping, where the heat load from exposure to the molten material is balanced by the cooling water. In this state, it is possible to evaluate the refractory condition on a consistent basis each time. Based on the wear reference lines (new, half worn, and fully worn) determined from the thermal model, it is expected that this tap-block is approaching a half-worn condition.
The pre-tapping temperature (about 53°C at 19:00 in Figure 8) of the tap-block depends on a number of parameters that cannot be measured and are related to variables such as the time since the last tap and clay plug position. The consequence is that condition assessment during the non-tapping period is very challenging. It has been found that the most reliable time to evaluate the condition of the tap-block is during a period of continuous tapping (see 23:30 to 00:00 in Figure 8). In this state there are fewer unknown parameters that confound the assessment.
Through both simulations and evaluation of plant data from our fibre optic temperature sensors, it has been shown that the tap-block may reach a steady-state temperature corresponding to the refractory condition. In reality, a steady-state temperature is approached by tapping for a sufficient duration, or tapping repeatedly in quick succession as shown around time 23:00 in Figure 8. Through thermal modelling simulations it has been established that this 'steady-state' temperature achieved by tapping in quick succession is within 2-3°C of the temperature reached during continuous tapping. Considering the 60°C temperature ranges from new to worn conditions, this deviation from the temperature reached during continuous tapping is negligible.
Summary of fibre optic sensors
1. A large number of measurements on a small fibre cable allows good spatial resolution to be obtained and enables temperature readings in locations where it is not possible to install thermocouples
2. Thermal modelling is necessary to put the measured values into context and understand the condition of the refractory
3. Evaluation of the temperatures at a steady-state condition approaching continuous tapping provides a consistent basis to evaluate refractory condition
4. Work is ongoing to relate the transient temperature reading from a single tap to refractory thickness for plants where a steady-state tapping temperature is not achieved.
Tapblock Diagnostic System
Background
The Tapblock Diagnostic System (TDS) is an advanced realtime monitoring system that continuously monitors the tap-block throughout its life and accumulates probable wear events to assess the remaining life of the tap-block (Gunnewiek et al., 2008; Gerritsen and Gunnewiek, 2006). The main purpose of the diagnostic system is to help the furnace operators safely manage the operation and maintenance of furnace tap-blocks. The TDS was first developed in 2003 for Teck Cominco and Lonmin Platinum, prior to the fibre optic temperature system, and uses the operating data such as tap-block thermocouple measurements, cooling water temperatures and flow rates to perform the diagnostic calculations and evaluate the residual integrity of the tap-block. Key benefits of this system include the ability to provide early warnings of refractory wear so as to improve safety and maintenance planning.
Since the diagnostic system uses temperature measurements from the thermocouples that are embedded in the tap-block, it is important to verify that the temperature measurements are sensitive to the changes in refractory conditions. Otherwise, the diagnostic system could be ineffective in assessing the tap-block condition and may require more instrumentation closer to the refractory to provide a reliable assessment. In such a case, fibre optic temperature sensors can provide a large number of temperature measurements on the tap-block, as discussed previously, and the diagnostic system can analyse those measurements to assess the condition of the tap-block.
Currently, the diagnostic system is operating at two sites, namely Teck Cominco, Canada, installed in 2003, and Portovesme s.r.l., Italy, installed in 2013. Both plants operate a Kivcet furnace with four tap-blocks, and the diagnostic system simultaneously monitors all the tap-blocks. Several changes have been made to the diagnostic system since the first installation. One of the main changes is the development of a new bump test procedure that can now be performed at any facility to estimate the tap-block thermal resistance. An update on the new bump test procedure and test results are discussed in the following sections. A more general description of the TDS can be found in Gunnewiek et al. (2008).
Bump test procedure
Tap-block thermal resistance is the overall thermal resistance between the thermocouple and the cooling water, which includes the copper block resistance, bonding resistance between the copper block and water pipe, and the cooling pipe resistance together with the resistance of any scale build-up that may be present in the water pipes. It is important to measure the tap-block thermal resistance to obtain an accurate estimate of the refractory thickness from temperature measurements.
A bump test is a field trial that can be performed on a tap-block to measure the thermal resistance. The cooling water is used to temporarily lower the tap-block temperature so that the response of the thermocouples can be analysed to estimate the block's thermal resistance. The response of thermocouples to an induced change in the tap-block temperature is typically characterized by a first-order decay function, and the dynamics of this response vary with block thermal resistance. For example, a higher tap-block thermal resistance results in slow thermocouple response, and a lower thermal resistance produces a faster response. Consequently, the thermocouple data collected during a bump test can be compared to thermal model simulations to estimate the tap-block thermal resistance.
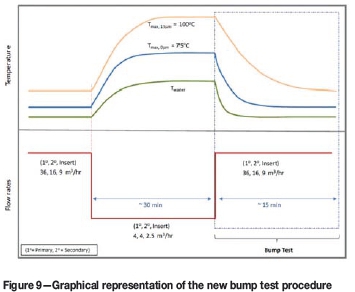
At the Teck Cominco installation, bump tests were performed by abruptly lowering the inlet cooling water temperature. This procedure has produced good results for several years; however, it is difficult to decrease the inlet cooling water temperature for a bump test without access to a source of cold water, which was available at Teck Cominco. A new bump test procedure was therefore designed that instead manipulates the cooling water flow rates to cause an abrupt decrease in tap-block temperature. A graphical representation of the procedure and the expected response is shown in Figure 9. The cooling water flow rate is first reduced to allow the temperature of the tap-block to increase. Once a sufficient temperature rise is obtained, the bump test is initiated by abruptly increasing the cooling water flow rate back to normal so that the tap-block temperature decreases. The actual thermocouple measurements are then analysed to estimate the tap-block thermal resistance.
This procedure can be easily performed at any location once the appropriate bump test flow rates are selected to induce the required change in the block temperature. Thermal model simulations are used to establish the flow rates and duration of the test that achieve a balance between providing sufficient change in tap-block temperature to identify the thermal resistance and maintaining the temperatures within acceptable limits. Furthermore, thermal modelling is also used to determine the transient response of the tap-block to a sudden increase in water flow rate for different tap-block thermal resistances. Such simulation results are used to calibrate the bump test models (essentially first-order transfer functions) that are used together with field bump test data to estimate the block thermal resistance at each thermocouple location.
Results and discussion
A bump test was recently performed on one of the tap-blocks at a client facility using the new procedure. During the test, as expected, the thermocouple temperatures increased upon lowering of the flow rates, reached a steady state, and finally decreased following a first-order response as shown in Figure 10.
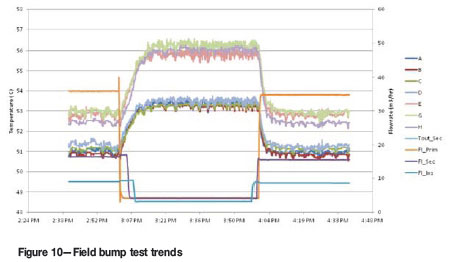
Figure 11 shows the normalized thermocouple data collected during the cooling portion of the bump test overlaid on the simulation data. The simulation curves are obtained at different block thermal resistances represented by 0, 10, 20, 30 and 40 μm gaps in the bonding between the copper block and water pipe. This range of gaps is taken as a generic way to represent any factor affecting the heat transfer through the copper block to the water pipe. Generally, there is no physical gap at the boundary between the copper block and cooling water pipe. A zero gap represents perfect thermal bonding and results in the fastest thermocouple response, whereas a 40 μΐη gap results in a slower thermocouple response as the gap impedes the heat flow from the copper casting into the cooling water. Although this range of block resistance does not represent a problem with the tap-block cooling, the range of values has a significant impact on the interpretation of the temperature readings.
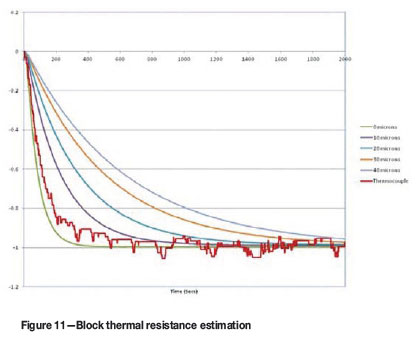
The sample field data shown in Figure 11 clearly indicates that the block thermal resistance is between 0 and 10 μm and the diagnostic system has precisely calculated the values to be 4 μm. Similar analysis at different thermocouple locations indicated the tap-block thermal resistance is between 2 and 6 μm. These values are in the same range as those obtained for the Teck Cominco tap-blocks using the previous bump test procedure, and thus provide confidence in the new procedure.
Once calibrated with the tap-block thermal resistance, the diagnostic system estimates the tap-block health during subsequent taps. It was found that after about six months of operation and nearly 300 taps, the health of the tap-block was about 87%. This means that the tap-block is still in good condition and can safely be used for an extended period of time.
Details of the recent installation
The TDS recently installed at Portovesme s.r.l. was developed in National Instruments control software 'LabVIEW' to simultaneously monitor four tap-blocks. The system was configured to retrieve the operating data from two Siemens S7 programmable logic controllers (PLCs) via OPC, and write important information obtained from diagnostic calculations (tap-block health) to another PLC so that the operators can access the data from anywhere in the plant through the PI historian. So far, the operation of the diagnostic system has been stable, without any reported issues.
In general, the diagnostic system must be designed to present the results in a meaningful way to highlight significant events, and the HMI must quickly point out key conditions that require operator attention and provide the process engineer with insight into particular events of interest with a first-pass analysis. Figure 12 shows a sample operator display for the TDS screen with easy-to-interpret colour indicators (red/yellow/grey) that are used to alert operators to warnings ranging from instrument failure to tap-block degradation. The HMI also permits further investigation into warnings as required by using the sub-screens for each tap-block.
Summary of Tapblock Diagnostic System
1. It is important to know the tap-block thermal resistance to accurately evaluate the condition of the tap-block
2. The new bump test procedure was recently tested at a client facility to measure the tap-block thermal resistance, and the estimated thermal resistances appeared to be reasonable and in the expected range
3. The new bump test based on changing the cooling water flow rate can be used at many more operating plants than the previous test, which required a source of cold water.
Conclusions
Hatch remains committed to the continual improvement of furnace technologies. The Taphole Acoustic Monitoring system provides on-line and real-time information to tapping personnel at smelters on the tap-hole condition and can assist with tapping practices. As a result, TAM has strong potential for becoming an integral component of future automated tapping systems that are of interest to many furnace operators.
The new fibre optic temperature measurement technique provides the capability to monitor tap-blocks accurately and with an increased number of measurements. The vast amount of data provided by this system is difficult for plant operational staff to interpret manually, and therefore the computer-based Tapblock Diagnostic System has been developed to assist with the analysis of the data and prediction of the health of the tap-block.
The TDS has been successfully implemented in two plants. The system has made use of a new bump test technique to verify the thermal resistance of a tap-block. The field results have provided confidence in the new test procedure, and this approach can be used at any facility to measure the tap-block thermal resistance.
Acknowledgements
The authors would like to thank the input received from the corporations that have implemented the various Hatch technologies in their tap-blocks. The contributions from staff at Anglo American, Lonmin Platinum, Teck Cominco, Portovesme s.r.l., and Xstrata have been invaluable for the understanding of water-cooled tap-block condition monitoring in the industry and furthering knowledge of a very complex and vital piece of furnace equipment.
The authors also gratefully acknowledge the help of D. George-Kennedy, J. Mullen, R. Van Wagoner, and A. Mattys of Kennecott Utah Copper (KUC) for their help in the development of the Taphole Acoustic Monitoring (TAM) system.
References
Gebski, P., Sadri, A., Ying, W., George-Kennedy, D., Nexhip, C., Krippner, D., and Kaur, R. 2013. Advances in continuous monitoring of water-cooled tapblocks for pyrometallurgical furnaces, CM Journal, vol. 4, no. 1. pp. 1-12. [ Links ]
Gerritsen, T. and Gunnewiek, A.H. 2011. Diagnostic system and method for metallurgical reactor cooling elements. US patent 7 976 770. Hatch Ltd. [ Links ]
Gunnewiek, L., Suer, Jl., Macrosty R., Gerritsen, T., and Karges, A. 2008. Developing a tapblock diagnostic system. Third International Platinum Conference, 'Platinum in Transformation', Sun City, South Africa, 5-9 October 2008. South African Institute of Mining and Metallurgy, Johannesburg. pp. 203-210. [ Links ]
Macrosty, R., Nitschke, S., Gerritsen, T., and Crowe, C. 2007. Advances in furnace monitoring: instrumentation. 6th International Copper-Cobre Conference (Cu2007), Toronto, Canada, 25-30 August 2007. The Metallurgical Society of CIM, Westmount, Quebec. [ Links ]
Sadri, A., Gebski, P., and George-Kennedy, D. 2008. Development of the Taphole Acoustic Monitoring (TAM) system for water-cooled copper tapblocks. 47th Annual Conference of Metallurgists, Winnipeg, Manitoba, 24-27 August 2008. CIM, Montreal. [ Links ]
Sadri, A., Gebski, P., Ghorbani, H., Mcgarrie, G., and De Vries, T. Monitoring deterioration of waffle cooler thickness at Polokwane Smelter, JOM, vol. 61, no. 10. pp. 69-73. [ Links ]
©The Southern African Institute of Mining and Metallurgy, 2016. ISSN2225-6253. This paper was first presented at the, Furnace Tapping Conference 2014, 27-28May 2014, Misty Hills Country Hotel, Muldersdrift, South Africa.

