


Serviços Personalizados
Artigo
 Inglês (pdf)
 Artigo em XML
 Referências do artigo
Indicadores

Links relacionados
-
 Citado por Google
 -
 Similares em Google
Compartilhar

 Permalink
Journal of the Southern African Institute of Mining and Metallurgy
versão On-line ISSN 2411-9717
versão impressa ISSN 2225-6253
J. S. Afr. Inst. Min. Metall. vol.115 no.11 Johannesburg Nov. 2015
http://dx.doi.org/10.17159/2411-9717/2015/v115n11a14
PAPERS OF GENERAL INTEREST
Rock engineering aspects of a modified mining sequence in a dip pillar layout at a deep gold mine
Y. JoosteI; D.F. MalanII
IHarmony Gold, South Africa
IIDepartment of Mining Engineering, University of Pretoria, Pretoria, South Africa
SYNOPSIS
Scattered mining was practised on Kusasalethu Mine (previously Elandsrand Gold Mine) prior to 1998, but at deeper mining levels it was no longer feasible, since it would have resulted in unacceptably high stress levels and energy release rates. Longwall mining was not adopted at these depths as the mine required a more flexible mining method owing to the highly variable grade and the presence of geological structures. A mining method was developed that consisted of dip stabilizing pillars for regional support, as well as bracket pillars to clamp geological structures. A strict sequence of extraction was followed and this, together with the particular layout, was called the 'sequential grid mining method'. This method addressed two key problems, namely negotiating adverse geology and the erratic grade of the Ventersdorp Contact Reef (VCR) orebody. However, a significant drop in production rates resulted in the need for alternatives and improvements to the original mine design. Modifications to the design were proposed in order to increase production rates, and an investigation to consider the rock engineering implications of these modifications was conducted. The study indicated that the modified method, called the 'multi-raise mining method', appears to be feasible and might address some of the production problems that were experienced with the original sequential grid design. An analysis of actual seismic data showed no significant differences between the original sequential grid mining and the implemented multi-raise mining. The numerical modelling of the mining layouts showed slightly higher interim energy release rates (ERRs) and average pillar stress (APS) levels during the extraction process. The final values are nevertheless identical to that of the original sequence. The study also investigated the use of a modelled moment method to analyse future seismic trends. The study illustrated that the expected seismic trends will be very similar for the multi-raise method compared to the original sequential grid mining method. This study is nevertheless considered of a preliminary nature and ongoing monitoring and analysis of seismic data at the mine is required to verify the response of the rock mass to the modified sequence and increased extraction rate. In particular, future work needs to investigate the effect of mining rate (advance rates in individual panels as well as volume of mining in particular raise lines) on the level of seismicity.
Keywords: Deep mine layout, sequential grid mining, sequence of extraction, mining rate
Evolution of deep gold mine layouts
The deep mining layouts in the gold mines of South Africa evolved gradually over time in an attempt to control the rockburst problem. In the early decades of the 20th century, decline shafts were used to gain access to the gold-bearing reef. Scattered mining with mine pole or mat pack supports, often supplemented with pillars and sand fill, was used with considerable success in shallow mining areas. Rockbursting, mainly caused by remnants at deeper levels, became a serious problem during the 1940s. Longwall stoping was first introduced at ERPM Mine to reduce the problems related to mining-induced seismicity. Hill (1942) showed that more than 90% of the seismicity that occurred on ERPM could be linked to the 'isolated pillars' left behind by the scattered mining layouts. He proposed that these pillars could be largely avoided by implementing the 'longwall' mining method. This was subsequently implemented at Crown Mines and ERPM.
The longwall layouts seemed to be largely successful, except for large damaging seismic events that still occasionally occurred. This was particularly problematic when mining through or in close proximity to geological structures, and became worse as the mining depths increased. A few years later, stability pillars where introduced. The advantages of these pillars were described by Cook and Salamon (1966). Studies conducted by Deliac and Gay (1984) and McGarr and Wiebols (1977) showed that the occurrence of rockbursts was significantly reduced in the mining areas protected by the stability pillars compared with areas where no pillars were used. Salamon and Wagner (1979) argued that large seismic events are likely to occur infrequently and that the level of seismicity in areas protected by stability pillars will be lower than traditional longwall faces without pillar protection. Unfortunately, the rockburst problem in the mining industry did not disappear with the introduction of the modified layouts. Hagan (1987) noted that the rockburst fatality rates escalated to unacceptable levels in the late 1970s at Western Deep Levels Mine.
The energy release rate (ERR) concept was introduced in the 1960s and is essentially a measure of stress concentration. The expected correlation with seismicity and mining conditions was illustrated by a number of workers (e.g. see Jager and Ryder, 1999). ERR cannot be used to estimate the rockfall hazard, but it is quite useful when considering the situation with regards to rockbursts. Various studies conducted in deep longwall mines indicated that the rockburst problem is related to the average energy release rates in the stopes.
► Joughin (1966) reported the first results relating the incidence of rockbursts at Harmony Gold Mine to ERR
► In 1979, Salamon and Wagner reported similar results for the East Rand Proprietary Mines (ERPM)
► At Western Deep Levels, Heunis (1980) conducted a detailed investigation over a period of 4 years. This also showed a strong correlation between ERR and the incidence of rockbursting.
The success obtained at ERPM and Blyvooruitzicht mines with pillars resulted in a systematic pillar design being implemented at Western Deep Levels in 1979 to assist with the rockburst problem (Tanton, McCarthy, and Hagan, 1984). A series of breast-mining panels made up a so-called 'Christmas tree' shape longwall. The longwalls were mined both east- and westwards. Strike-orientated barrier pillars approximately 35 m in width were left between the major longwalls. The layout attempted to maintain the face stresses as low and as uniform as possible during the extraction of the entire working area. The ERR criterion was used as an aid in the assessment of average stress levels at the working faces, as well as indicators of possible seismic incidence in geologically undisturbed mining situations (Hagan, 1987).
The strike stability pillar layout has advantages and disadvantages when compared to the scattered mine layout. The disadvantages of the longwalls with strike stability pillars are as follows (Frusso-Bello and Murphy, 2000):
► Minimal advanced off-reef development results in inadequate information regarding geological structures. Planning of the mine is therefore problematic
► The majority of geological structures are being mined through, which results in a large amount of off-reef mining operations
► Geological structures with large throws cannot be negotiated and new development is required to access the reef. This increases costs significantly
► The method is development-intensive.
The advantages of the longwalls with the strike stability pillars are as follows:
► No remnants or additional pillars will be formed that need to be mined in the future
► The access development is protected against high stresses as it is positioned in overstoped ground
► Faster access to reef is possible and revenue can therefore be generated quicker
► Mining operations can be concentrated, and this makes management and logistics of the mining activities easier
► Better ventilation control can be achieved. This is always a problem in the scattered mining environment.
Migration to sequential grid layouts
In recent years, deep-level mines situated in the West Rand region of the Witwatersrand goldfields adopted layouts that incorporate the systematic use of dip stabilizing pillars. This layout is largely motivated by its flexibility for mining an orebody that is disrupted by geological structures, situations where the reef grade is erratic, and with the occurrence of damaging seismic events associated with the geological structures. The other major contributor to the selection of the sequential grid method in preference to the mini-longwall method is the stability of the pillars (dip versus strike pillars). Lenhardt and Hagan (1990) showed that strike stability pillars on the Carbon Leader Reef (CLR) were prone to failure. The dip pillar stability concept was applied by Murie (1980) to a section of Kusasalethu Mine (70 to 73 level) and he found that the ERRs were reduced by 50% compared to the scenario where only bracket pillars were used to clamp geological structures. Applegate and Arnold (1990) were the first to propose the 30 m wide dip stability pillars spaced 200 m (170 m skin-to-skin spacings) apart that would result in approximately 85% extraction. By early 1990, the design was implemented from 76 to 85 level. Part of the initial mine design was the incorporation of bracketing geological structures to address the seismic hazard associated with these geological structures. The key principles of the proposal were that all significant geological structures must be bracketed and dip stabilizing pillars should be located in low-grade areas where possible.
A key aspect is that Applegate (1991) showed that the ERR levels can be controlled when following a specific sequence of mining. This is achieved by keeping leads and lags to 10 m or less as far as is practically possible. As the overall face configuration is bottom panel leading, the 10 m lead / lag rule will assist in maintaining the overall face shape required to limit the ERRs associated with the top panels.
The mining sequence of the original sequential grid method can be described as follows:
► Overall sequence is mining outwards from the shaft on strike, moving from raiseline to raiseline to the eastern and western boundaries of the mine (dip towards the south)
► Deeper levels will be started up later than the shallower sections, resulting in a V-shaped down-dip mining configuration
► Mining at each new raiseline proceeds first towards the shaft to form the next pillar
► If the pillar formation is completed, mining commences on the opposite side of the raiseline, mining away from the shaft towards the next pillar position.
The sequence of the sequential grid mining method is shown in Figure 1. It is during the second mining stage for each raiseline that stope spans reach their maximum size, but as the mining proceeds in the direction of the solid ground, the effect of the large span is minimized. This, together with the use of backfill, will assist with a decrease in closure rates and ERR levels.
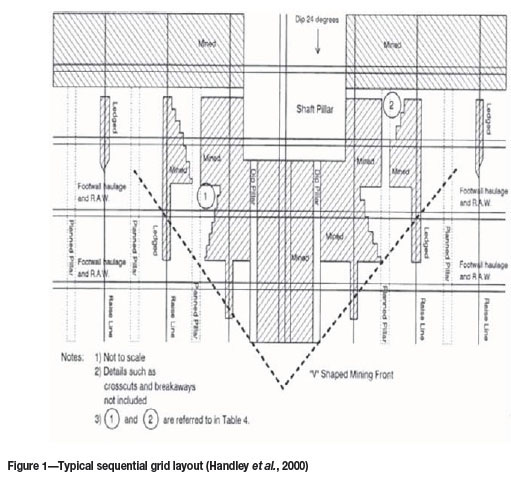
The original decision to implement the sequential grid mining method at Kusasalethu Mine was based on the following factors (Handley et al., 2000):
► Less off-reef development, thus less capital required
► Improved flexibility with respect to mining and planning. This is important for a variable grade orebody
► Grade recovered is better due to improved selection of mining locations
► An improvement in the reduction of seismicity due to bracketing of geological structures
► Strike stabilizing pillars require ventilation slots, which involves dangerous mining. This will not be necessary for the sequential grid mining as the dip pillars form natural ventilation areas
► Strike gullies are more stable as the gullies are not developed parallel to the stabilizing pillars
► Sequential grid mining requires that the development remains ahead of the mining. This will ensure that improved geological information is available.
A few negative aspects are nevertheless associated with the sequential grid layouts (Handley et al., 2000):
► The strict mining sequence that is required to obtain the grid format can result in the lack of flexibility in mining and planning
► The strict sequencing of the panels can result in lower production rates
► Sequential grid mining requires a higher upfront capital input to establish more mining faces compared to longwall mining
► The long-term potential stability of the dip stability pillars is still unknown. On 18 May 2008, for example, a magnitude 3.1 seismic event occurred in the back area on an old dip stabilizing pillar at Kusasalethu Mine.
The problems listed above need to be resolved before the sequential grid layout can be claimed to be the preferred mining method in the deep mining environment. One key question at Kusasalethu Mine was whether the design can be altered to increase production rates without increasing the rockburst hazard. This problem was investigated in this paper. The revised method proposed for the mine will be referred to as multi-raise mining and is discussed in more detail in the next section.
Modifications to the sequential grid at Kusasalethu Mine
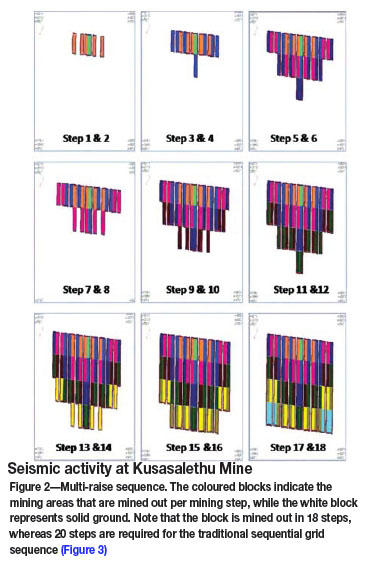
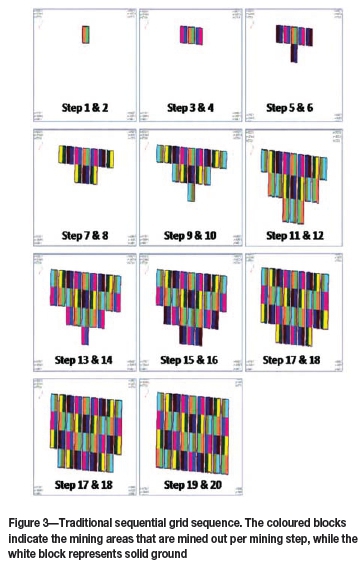
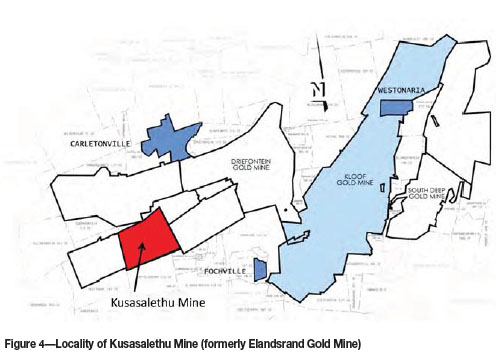
To address the issue of slow production rates, a change to the original design was proposed where multiple raises are mined simultaneously. The multi-raise mining method differs from the sequential grid method mainly by the number of raiselines that are being mined on a specific mining level. Stoping therefore occurs in a number of raiselines simultaneously on the various mining levels. The major advantage of this method compared to the sequential grid method is that the extraction rate is higher, resulting in a decrease in the extraction time of a specific mining block due to increased flexibility of the mining plan. Although multiple raises are mined on the same level simultaneously, the other sequential grid rules as discussed above still apply. Figures 2 and 3 illustrate the difference between multi-raise mining and the sequential grid sequence. The coloured blocks indicate the mining areas that are mined out per mining step, while the white block represents solid ground. Of importance here is the increase in the extraction rate between the two mining sequences and that the V-shaped down-dip configuration is not achieved by multi-raise mining. Kusasalethu Mine is situated on the far southern section of the West Rand goldfields (Figure 4). It forms part of the central portion of the greater Witwatersrand Basin and mines the Ventersdorp Contact Reef (VCR). The hangingwall is Ventersdorp lava, which is characterized by a uniaxial compressive strength (UCS) of approximately 300 MPa. The footwall is competent quartzite, (UCS 180-250 MPa) which extends to a depth of approximately 430 m below reef on the eastern boundary and about 550 m below reef on the western boundary. This high-strength zone enables haulages and most of the other related development to be sited in the footwall without problems.
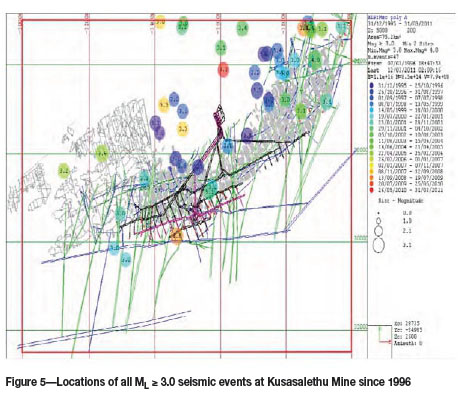
As early as 1983, the first seismic network was in operation at Kusasalethu Mine. A second system, which was developed by the Western Deep Levels Rockburst Prediction Project, was installed in 1987. The expanded seismic network covered approximately 15 km2 of the mine's lease area. The network recorded on average 200 seismic events per day. The current Institute of Mine Seismology (IMS) seismic network on Kusasalethu Mine consists of 17 operational seismic stations. Expansion of the seismic network is currently underway with the installation of four additional seismic stations between 88 and 105 level. A large number of seismic events have been recorded since the IMS network became operational at the end of 1992. The current database extends from 1996 and consists of 837 024 seismic events with magnitudes between -3.0 and 4.0 ML. Figure 5 shows the locations of all seismicity with ML> 3.0 since 1996. On average, approximately 8000 seismic events per month are recorded.
Comparison of the two mining methods
To investigate the differences between the two mining methods, a numerical modelling study was conducted and actual seismic data from the mine was analysed. Of particular interest was whether the modified method will lead to higher ERR levels and whether an increase in seismic activity could be detected from the actual seismic data collected at the mine. It should be noted that this preliminary study focused only on an idealized layout with no geological structures to obtain an improved understanding of the modified layout. For actual layout design, the effect of geological structures needs to be investigated in future and ESS modelling will also be required.
Numerical modelling
Numerical modelling was conducted to compare the pillar stress changes and ERR levels between the multi-raise sequence and the original sequential grid sequence. The numerical modelling was conducted using MINSIM 2000 and the following input parameters were used. These are similar to those used by Appelgate (1991) when he investigated the original sequential grid mining layout:
► Grid size - 10 m
► Poisson's ratio - 0.2
► Young's Modulus - 70 GPa.
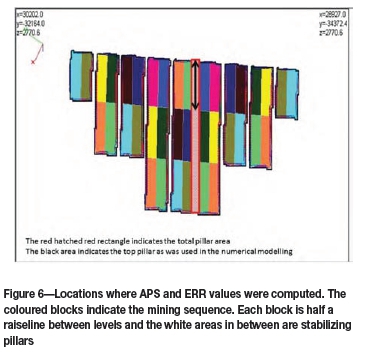
Two numerical modelling parameters, average pillar stress (APS) and energy release rate (ERR), were computed to compare the two mining sequences. Figure 6 depicts the location were the APS and ERR values were obtained from the numerical modelling results. Two areas were identified where numerical results were computed: the red hatched rectangle (in the middle of the mining layout) depicts the total pillar area and the black arrow depicts the smaller top pillar area. As the two mining methods resulted in a different sequence in the block being mined, it was decided to monitor this 'centre' pillar area first to compare the two techniques and obtain initial indications of possible abnormally high stresses as the mine layout progresses outwards to the boundaries of the block in question.
A comparison using energy release rates (ERRs)
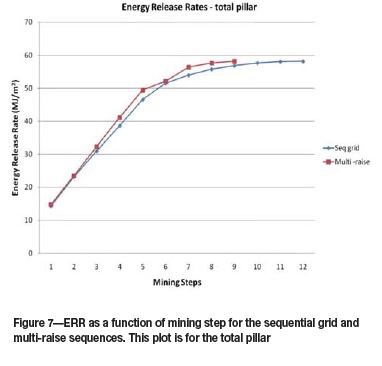
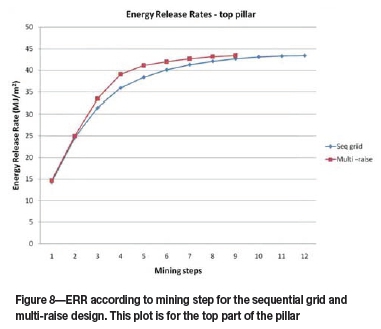
The ERR concept was introduced in the 1960s and it is a useful measure of stress concentrations ahead of stope faces. ERR takes into account the effect of depth and the geometry of the mined-out areas and is related to the convergence that occurs in the stopes. Figure 7 shows the average ERR values for the total pillar area (red rectangle in Figure 6) for both the sequential grid and multi-raise sequences. Figure 8 shows the average ERR values obtained for the top part of the pillar indicated by the black arrow in Figure 6.
The following can be noted from the results obtained when computing the average ERR values for the total pillar and top part of the pillar (Figures 7 and 8).
► The two mining sequences result in a similar trend of rapid increasing ERR values when the mining is still in close proximity to this pillar. This rate decreases gradually as the mining moves away from this central pillar
► The maximum ERR value (58.2 MJ/m2 for the total pillar and 43.4 MJ/m2 for the top part of the pillar) is obtained during step 12 for the sequential grid sequence and during step 9 for the multi-raise sequence. The value for the top part of the pillar is less than that for the entire pillar as the top part is situated next to the solid abutment which reduces the stress in this part of the pillar compared to further away from the abutment. The maximum values for the two sequences in Figures 7 and 8 are identical as the final mined geometry is similar. This is to be expected as with elastic modelling, the final results are path-independent for identical final geometries
► The average ERR value obtained in the initial steps is slightly higher for the multi-raise method compared to the sequential grid mining. This is not unexpected, as mining is more rapid for the multi-raise method and it results in higher stresses on the pillars and increased closure earlier in the mining sequence. The difference in ERR is nevertheless small. The maximum difference for the two sequences was obtained during step 5 for the entire pillar (5.9%) and step 4 when considering when considering only the top part of the pillar (8.1%).
A comparison using average pillar stress (APS)
APS is commonly used as one of the parameters to design and assess the stability and performance of pillars. If the mining layout is regular, tributary area theory can be used to determine the APS value for a specific pillar (Jager and Ryder, 1999):
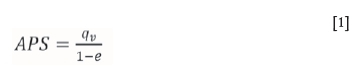
where qvis the virgin stress and e the extraction ratio. The APS as computed by the numerical modelling program MINSIM 2000 is shown in Figures 9 and 10 for the top pillar and the total pillar area respectively (see Figure 6). Napier and Malan (2011) illustrated that care should be exercised when calculating APS values using boundary element programs. The APS values computed by these codes are dependent on element size, and for large element sizes the APS can be significantly underestimated. Ideally, the APS should be computed for two different element sizes and a more accurate value can then be obtained by extrapolation to a 'zero' element size. For the purposes of this study, the absolute APS values were not required, but only consistent values for comparison between the two mining sequences. Only one set of simulations for each mining sequence was therefore completed using an element size of 10 m.
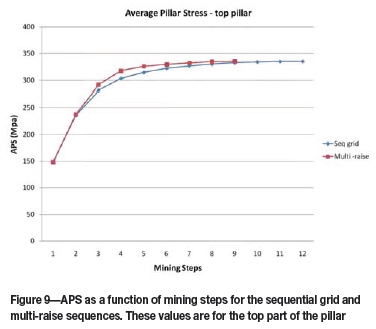
The following can be noted from the simulated APS results:
► The difference between the two design methods when comparing the APS on the centre pillar is minimal. Both mining sequences result in similar trends of increasing APS
► The APS value obtained during the early mining steps is slightly higher for the multi-raise sequence than for the sequential grid sequence. For the top part of the pillar (Figure 9), a maximum difference for the two sequences was obtained during step 4 (4.5%). For the entire pillar area, the difference was less at 3.0%, which occurred during step 5
► The maximum APS value (335.4 MPa for the top part of the pillar and 386.4 MPa for the entire pillar) was reached during step 12 for the sequential grid sequence and during step 9 for the multi-raise sequence. As expected, the top part of the pillar had a lower APS value as it is adjacent to the solid abutment.
A comparison using modelled moment estimates
For a given change in mining configuration, various attempts have been made in the past to estimate seismic hazard using numerical modelling. A few examples applicable to the South African gold mining industry include Ryder (1988), Wiles et al., (2001), Hofmann (2012), and Scheepers et al., (2012). For this current study, a method was used to estimate the moment tensor of the deformation associated with each mining step. For this method, the mining area is enclosed in a box or sphere which plays the role of the source volume. Assuming all deformation associated with a particular mining step is associated with one seismic 'event', one can estimate the resulting moment from the changes in the elastic displacements and tractions on the elements of the box or sphere. The method was recently described by Malovichko et al. (2012). This technique was also recently further explored by the IMS numerical modelling unit. In summary the method involves the following steps:
► Define a sphere around the mining volume of interest that contains all the material subjected to deformation or dislocation associated with a mining step. This volume must be small enough to capture the elastic stress and strain change caused by the mining, but large enough to ensure that the material outside can be assumed to be a linear elastic material
► Discretize the sphere surface using small flat elements. The elements must be small enough to ensure the constant-traction and constant-displacement approximation for each element gives accurate results, but large enough to ensure practical solution times
► Run the numerical simulation for the state before and after the mining step and compute the changes in tractions and displacements at the centroids of the elements on the sphere
► Calculate the moment tensor as per Malovichko et al. (2012).
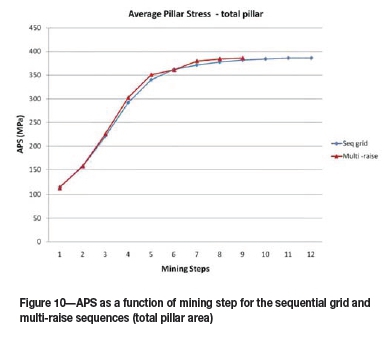
The seismic moment that is calculated is referred to as the modelled moment for each mining step. The results of the modelled moment analyses for the Kusasalethu mining layouts were calibrated using the seismic history of the mine and the IMS in-house numerical modelling program, ISM. Figures 11 and 12 show the location of the eight modelled moment areas selected to analyse the two different sequences described above. The same blocks were used to compare the two mining methods, so the block selection is considered a reasonable first attempt to compare the two sequences.
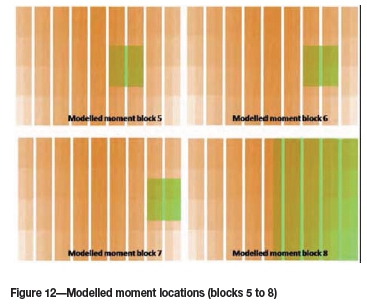
Figures 13 and 14 illustrate the modelled moment results for each selected area for both of the mining methods. From these results it is deduced that:
► The three areas (blocks 2, 3, and 8) with the largest modelled moment at the end of the mining cycles are the same for both of the mining methods, with modelled moments ranging between 2.0 and 2.5
► The three areas with the largest modelled moment are also the three largest areas that include the most mining
► The other five areas (blocks 1,4,5,6, and 7) have very similar modelled moments at the end of the mining cycle.
► All the blocks follow a similar path to the final step, with the multi-raise method reaching higher magnitudes earlier on. This is due to the shorter extraction time compared with the sequential grid layout.
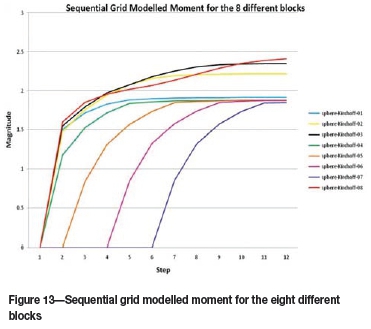
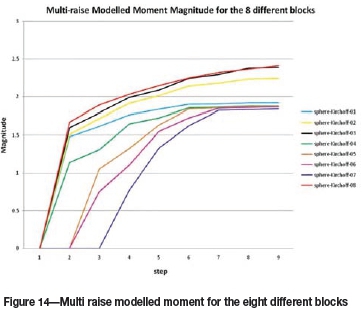
In summary, when comparing the results obtained using the modelled moment method, little difference can be noticed between the two mining sequences. The only difference is that larger magnitudes can be expected earlier on with the multi-raise method due to the shorter extraction time.
Seismic data and production analyses
The multi-raise mining method was implemented from raiseline 35 between 98 and 102 levels at the end of 2006. Figure 15 shows the western section of the mine where the multi-raise mining method was implemented together with all seismic events with ML> 2.0 since 2000 until March 2009 with the Mmax=3.1. Only two seismic events with ML> 3.0 were recorded in the area, the last of these occurring on 31 July 2002.
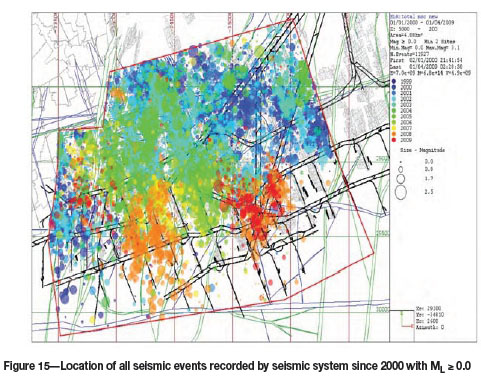
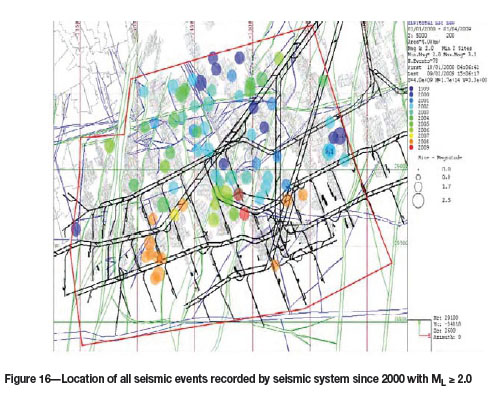
Figure 16 shows the larger magnitude events with ML> 2.0 that occurred in the area from 2000 until 2009. The migration of the seismic activity in a southern direction coincides with the general trend in mining. The colours representing the seismic activity in this plot are based on annual intervals as portrayed in the legend.
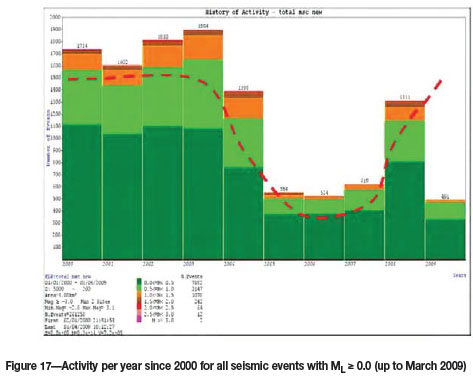
The time series depicting the occurrence of seismic activity with ML> 0.0 for the period 2000 to March 2009 is shown in Figure 17. The distribution is based on yearly intervals and the following important features emerge from this representation of the seismic activity:
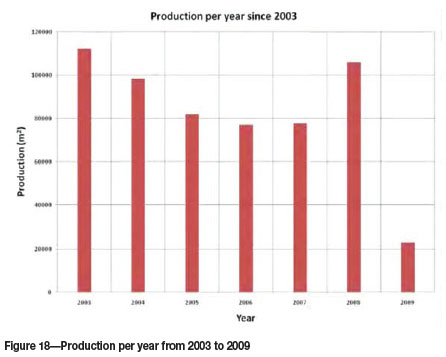
► There has been a general decrease in seismicity since 2005, with a peak in 2008. This is closely related to the production, which follows a similar trend as can be seen in Figure 18
► The decrease in activity for 2009 is due to the fact that the data-set represents only the first three months in 2009.
Production data
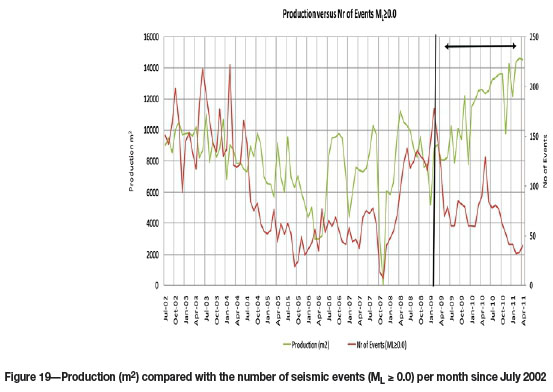
Production data dating back to July 2002 was obtained for the area selected in Figure 16. Production information prior to this is unfortunately not available. The production and associated seismicity for the 7-year period were analysed to determine if any changes in the seismic response could be attributed to the subsequent changes in mine design (change from sequential grid to multi-raise sequence). The production figures (m2) since July 2002 were firstly compared with the number of seismic events recorded with ML> 0.0 i.e. activity rate. The two series are compared in Figure 19. The following points emerge:
► A correlation in the downward trend is visible from the end of 2003 until July 2006
► From July 2006 until March 2009, the production rate is much higher than the associated seismic response, but the two series appear to follow the same trend
► Visual examination of the two series reveals a reasonable correlation up to March 2009. Beyond that, the production data and seismicity appears to show a strong negative correlation.
Seismic hazard estimation
Probabilistic assessment of the seismic hazard involves specifying the likelihood, maximum magnitude, location, and nature of seismic events that might have damaging effects on underground working areas and attempts to estimate the peak acceleration of the ground movement close to underground infrastructure. Seismic hazard is defined as the probability of occurrence of a seismic event or ground motion exceeding a specified level within a given period of time (Jager and Ryder, 1999). The occurrence of mine tremors is not strictly a random process. A statistical approach to the analysis of seismic events provides a reasonable basis for seismic hazard assessment to assist in estimating expected losses or assessing different mine designs.
Observations indicate that seismic events induced by mining activities show some of the same characteristics as those noticeable in crustal seismology. One of the relations that are readily applied between both fields of seismology is the frequency-magnitude relation that was introduced by Gutenberg and Richter:
where n is the number of seismic events with magnitude m, and a and b are intercept and slope parameters for the logarithmic relationship. Numerous papers have been written on this frequency-magnitude relation and they all show that the relation holds for virtually all magnitude ranges. Criticism of the relation is centred on its unsatisfactory behaviour for the larger magnitude seismic events, where it overestimates the likelihood of occurrence. The maximum magnitude capable of occurring in any active mining area can be estimated by either of two methods, namely a deterministic or a probabilistic approach. We used a visualization software package developed by Hamerkop Scientific Services to portray the results of maximum magnitude based on a probabilistic approach.
One of the basic elements in assessing seismic hazard is to recognize seismic sources that could affect the particular location at which the hazard is being evaluated. These sources are often called seismogenic sources. Defining and understanding seismogenic sources is a key component of seismic hazard analysis and requires knowledge of the regional and local geology as well as past seismicity. Earthquake hazard parameters such as maximum expected magnitude (Mmax), activity rate, and b value of the Gutenberg-Richter relation are evaluated for each seismogenic zone.
In the application of statistical estimations of seismic hazard on Harmony Gold mines, several assessments have been carried out over a period of time. The following limitations of the methodology have been identified (Kijko, 1997; Stankiewicz, 1998a, 1998b, 2000; Ebrahim-Trollope, 2001):
► Mining has a dynamic nature and changes constantly in space and time. This method cannot be extrapolated over very long periods of time without analysing the mining direction and volume. These are two of the variables that can cause differences in the hazard calculated for a particular mining area
► The method is used comparatively between similar geotechnical areas in which at least one of the areas has previously been mined out. In other words, you can 'forecast' what might happen for a particular mining area when a similar area has been mined out in the past. Method of mining, mining rate, and geology play an important factor when comparing and selecting mining areas for analysis
► The method is applicable to a single source mechanism and therefore all source mechanisms as discussed beforehand need to be identified for a particular geotechnical area. There is a distinctive bimodal distribution for seismic events with different source mechanisms. It is therefore important to understand the different sources of seismicity in a region before interpreting the result obtained from the hazard estimation. The choice and size of the selected area must be geologically similar to the mining area of interest
► The method requires a consistent and reliable database. For example, no changes to software programs should be made that might result in source parameters being calculated differently. Loss of periods of seismic data will influence the results obtained by the seismic analyses
► The selection of the mining area and the time period for the seismic hazard estimation can be problematic. Care should be exercised when the selection of the area is done to ensure that an acceptable log-linear distribution is obtained that will not result in the over-or underestimation of the seismic hazard. The lack of an acceptable log-linear distribution often highlights possible errors in the choice of mining area or time period
► The hazard estimation results obtained from the analysis are averaged over the time period of the analysis and more hazardous time periods, within the period selected, cannot be identified.
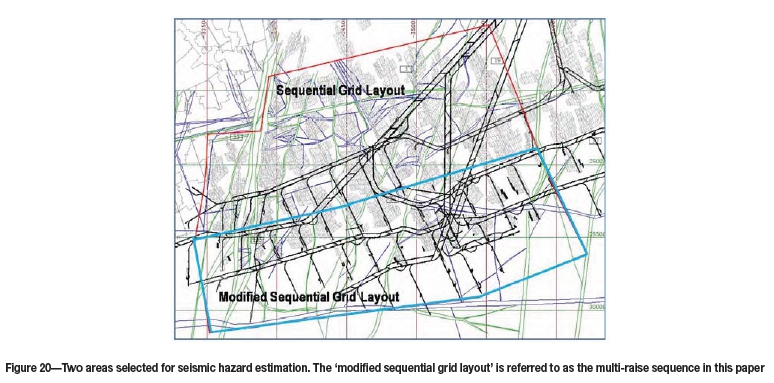
To identify and determine the seismic hazard associated with a specific mine design, the seismicity of the area in question needs to be determined prior to the change in mining method, as well as for a significant time period after the method was changed. The two analyses can then be compared to determine if the changed mine design resulted in any significant changes to the response in seismicity. The area as shown in Figure 20 was used to select the two areas where the two mine sequences were implemented.
Seismic analysis of the sequential grid layout
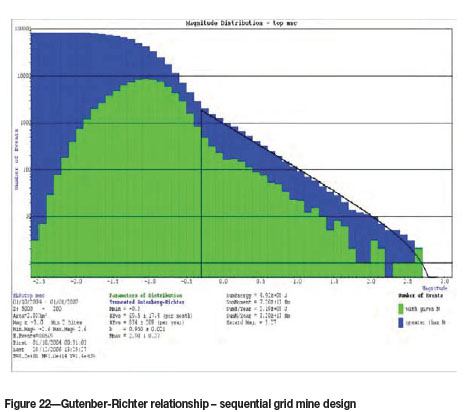
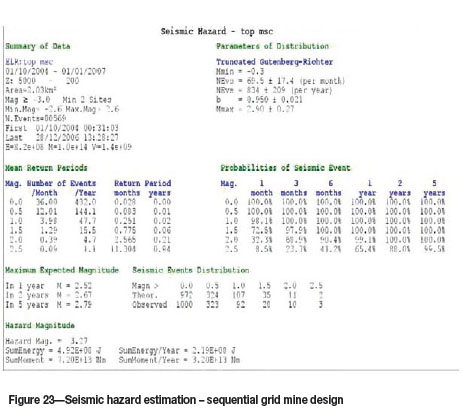
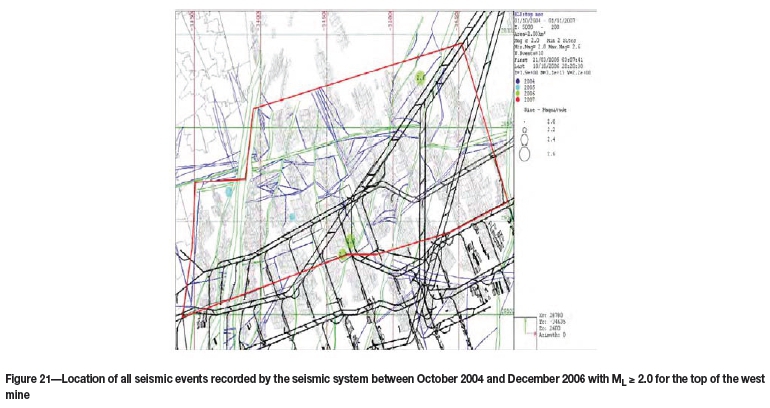
The probabilistic seismic hazard according to the program Korhaan was determined for the top of the west section of Kusasalethu Mine as depicted in Figure 21. Figure 22 shows all seismic events with ML> 2.0 for time period October 2004 until December 2006, with the largest event being a ML = 3.1. A relatively good Gutenberg-Richter relation is obtained from the seismic data-set available. The data-set is a bit sparse for magnitudes larger than 1.8, and a peak is visible for magnitudes between 2.0 and 2.2. The results obtained from the seismic assessment for the original sequential grid sequence are shown in Figures 22, 23, and Table I.
Seismic analysis of the multi-raise sequence
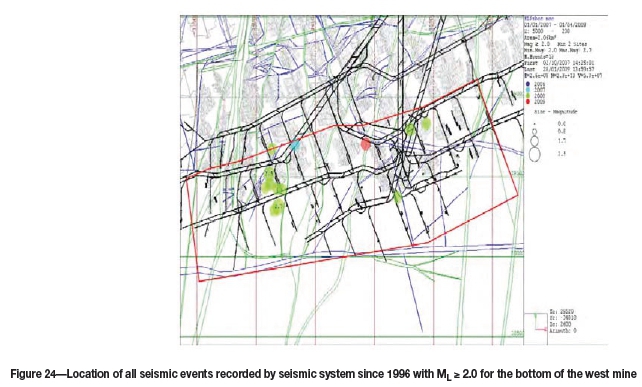
The probabilistic seismic hazard was determined for the bottom of the west section of Kusasalethu Mine as depicted in Figure 20. Figure 24 shows all seismic events with ML> 2.0 for time period January 2007 until March 2009, with the largest event being a ML = 2.7. The results obtained from the seismic assessment for the change in design (multi-raise) are shown in Figures 25, 26, and Table I. A relatively good Gutenberg-Richter relation is obtained from the seismic dataset available. The data-set has the same trend as for the original design for the larger magnitude events and is a bit sparse from magnitude larger than 2.5. A peak is visible for magnitudes between 2.0 and 2.5.
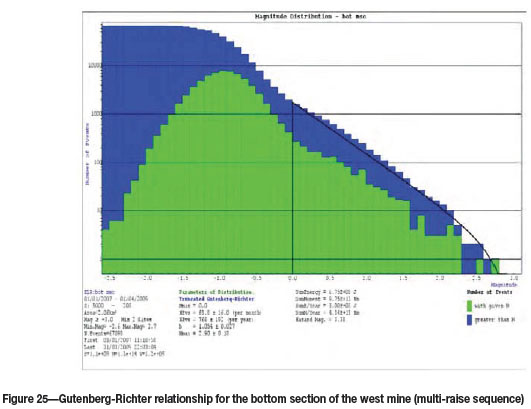
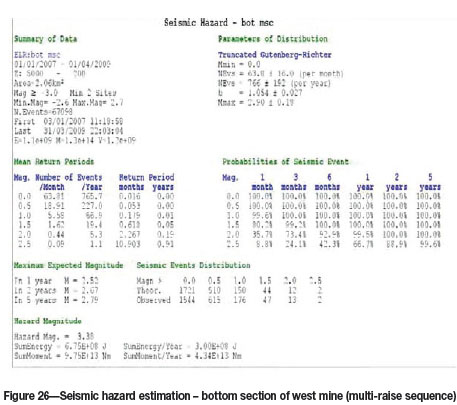
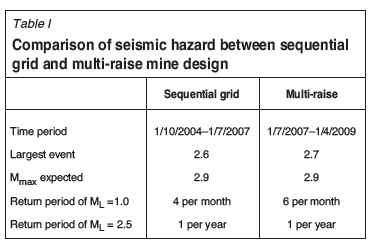
Table I compares the seismic hazard of the original sequential mining sequence with the multi-raise mine sequence. The results obtained from the current study reveal no significant differences between the two mining sequences in terms of the relevant maximum magnitude and return period for seismic events with ML> 2.5 seismic hazard parameters. The number of seismic events with ML = 1.0 shows a 33% increase for the multi-raise mine design when compared to the sequential grid mine design.
Effect of mining rate
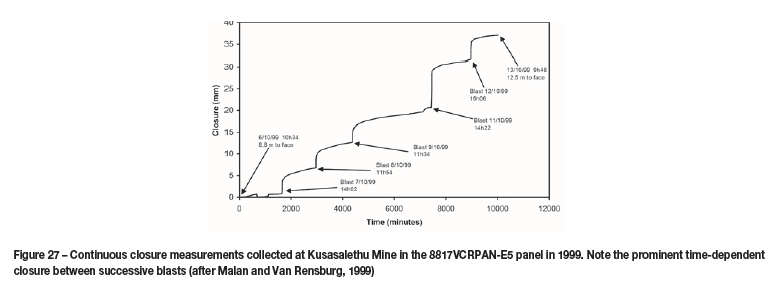
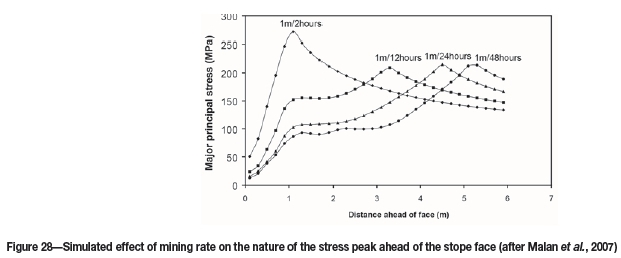
From the preceding analysis, it appears that the multi-raise mining sequence will not have adverse effects on the mine stability when compared to the original sequential grid method. A factor not considered, however, is the effect of mining rate. As the multi-raise mining sequence utilizes more attack points per level, the overall volume of mining is larger for a similar period. This can be seen in Figures 2 and 3, where an area can be mined out in five steps whereas nine steps are required for the same area if the sequential grid mining rules are followed. Unfortunately, very little information is available in the literature on the effect of mining rate. Some basic mining rules are often applied in the industry, such as slow mining rates in remnants and restricting the number of crews in particular raiselines prone to seismicity. This effect of mining rate has never been properly quantified, however. Malan et al. (2007) describe the time-dependent behaviour of the fractured rock mass when conducting closure measurements in deep gold mine stopes. The presence of this time-dependent behaviour implies that mining rate will play a role in the response of the rock mass. Figure 27 illustrate closure measurements conducted at Kusasalethu Mine in 1999. Although the brittleness of the rock mass is clearly illustrated by the large jumps in closure at blasting time, noticeable time-dependent rock movements were recorded between successive blasts. Malan et al. (2007) also conducted inelastic numerical modelling with a time-dependent constitutive for the failed rock. This illustrated that the position of the stress peak ahead of the face will be a function of mining rate, and high rates may lead to stress peaks close to the face and a higher risk of strain-bursting (Figure 28). The effect of different volumes of mining over a larger area is not clear, however.
Conclusions
A study was conducted to compare the original sequential grid mining sequence with a new multi-raise sequence. The layout geometry for these methods is essentially similar, but higher production rates are possible with the multi-raise sequence as it allows for simultaneous attack points on the same level. A study of the seismic data for adjacent mining areas where the two methods were used found no significant differences in terms of the seismic response. A numerical modelling study of the two methods illustrated only small differences in the simulated energy release rates (ERRs) and average pillar stress (APS) levels during the extraction process. As to be expected with elastic modelling, the final values for the two mining methods are similar as the final geometries are identical. The interim ERR and dip pillar APS values are slightly higher for the multi-raise sequence as the volume of extraction is more rapid. The numerical models were also used to conduct a modelled magnitude assessment.
This also showed no significant differences in the anticipated seismicity for the two mining sequences. Based on the study and the data available at this stage, it is concluded that the multi-raise mining sequence has no adverse effects on the mine stability when compared to the original sequential grid method. This work is nevertheless considered as being of a preliminary nature and ongoing monitoring and analysis of seismic data at the mine is required to verify the response of the rock mass to the modified sequence and increased extraction ratio. In particular, future work needs to investigate the effect of mining rate (advance rates in individual panels as well as volume of mining in particular raiselines) on the level of seismicity.
Acknowledgements
This work formed part of the MSc study of the first author at the Department of Mining Engineering, University of Pretoria. Harmony Gold supported the publication of this paper and the authors wish to express their sincere thanks to management. In addition, Kevin Riemer provided valuable support and encouragement during the compilation and analysis of the seismic data.
References
Appelgate, J.D. and Arnold, D.A. 1990. Stabilising pillar design - 76 to 85 levels, Internal report, Elandsrand Gold Mine, Anglogold. [ Links ]
Appelgate, J.D. 1991. Rock mechanics aspects of sequential grid mining. MSc dissertation, University of the Witwatersrand. [ Links ]
Cook, N.G.W. and Salamon, M.D.G. 1966. The use of pillars for stope support. Chamber of Mines of South Africa, Unpublished report. [ Links ]
Deliac, E.P. and Gay, N.C. 1982. The influence of stabilizing pillars on seismicity and rockbursts at ERPM. Proceedings of the 1st International Congress on Rockburst and Seismicity in Mines, Johannesburg. pp. 257-263. [ Links ]
Ebrahim-Trollope, R. 2001. Gutenberg-Richter relationship and mine induced seismicity as observed at the African Rainbow Minerals mines -Klerksdorp. Proceedings of the Fifth International Symposium on Rockbursts and Seismicity in Mines. Van Aswegen, G., Durrheim, R.J., and Ortlepp, W.D. (eds.). Symposium Series S27. South African Institute of Mining Metallurgy, Johannesburg. pp. 501-508. [ Links ]
Hagan. T.O. 1987. An evaluation of systematic stabilizing pillars as a method of reducing the seismic hazard in deep and ultra-deep mines. PhD thesis, University of the Witwatersrand, Johannesburg. [ Links ]
Handley, M.F, De Lange, J.A.J., Essrich, F., and Banning, J.A. 2000. A review of the sequential grid mining method employed at Elandsrand Gold Mine. Journal of the South African Institute of Mining and Metallurgy, vol. 91. pp. 145-157. [ Links ]
Heunis, R. 1980. The development of rock-burst control strategies for South African gold mines. Journal of the South African Institute of Mining and Metallurgy, vol. 80, no. 4. pp. 139-150. [ Links ]
Heunis, R. 1980. The development of rockburst control strategies for South African gold mines. Journal of the South African Institute of Mining and Metallurgy, vol. 80, no. 4. pp. 139-150. [ Links ]
Hill, F.G. 1942. A system of longwall stoping in a deep level mine with special reference to its bearing on the pressure burst and ventilation problems. Association. of Mine Managers of the Transvaal. Papers and Discussions, vol. 1. pp. 257-276, Johannesburg. [ Links ]
Hofmann, G. 2012. Correlating modelled elastic energy release with recorded seismicity in a deep tabular mine. Proceedings of the Second Southern Hemisphere International Rock Mechanics Symposium (SHIRMS 2012), Sun City, South Africa, 14-17 May 2012. Southern African Institute of Mining and Metallurgy. pp. 407-423. [ Links ]
Jager, A.J. and Ryder, J.A. 1999. A handbook on rock engineering practise for tabular hard rock mines. Safety in Mines Research Advisory Committee, Johannesburg. [ Links ]
Joughin, N.C. 1966. The measurement and analyses of earth motion resulting from underground rock failure. Research Report, No. 73/66. Chamber of Mines of South Africa, Johannesburg. [ Links ]
Kijko, A. 1997. Seismic hazard estimation for the northern part of Shaft No. 5. Consultancy Report for Vaal Reefs Exploration and Mining Company. [ Links ]
Lenhardt, W.A. and Hagan T.O. 1990. Observations and possible mechanism of pillar-associated seismicity at great depth. Proceedings of the. International Deep Mining Conference, Johannesburg, September 1990. Vol. 2. Technical Challenges in Deep Level Mining. South African Institute of Mining and Metallurgy, Johannesburg. pp. 1183-1194. [ Links ]
Malan, D.F. and Janse van Rensburg, A.L. 2000. Continuous closure measurements at Elandsrand Mine (8817VCRPAN-E5/E6), Internal Report. [ Links ]
Malan, D.F., Napier, J.A.L., and Janse van Rensburg, A.L. 2007. Stope deformation measurements as a diagnostic measure of rock behaviour: A decade of research. Journal of the Southern African Institute of Mining and Metallurgy, vol. 91. pp. 145-157. [ Links ]
Malovichko, D., Van Aswegen, D., and Clark, R. 2012. Mechanisms of large seismic events in platinum mines of the Bushveld complex (South Africa). Journal of the Southern African Institute of Mining and Metallurgy, vol. 112. pp. 419-429. [ Links ]
McGarr, A and Wiebols, G.A. 1977. Influence of mine geometry and closure volume on seismicity in a deep level mine, International Journal of Rock. Mechanics and Mining Sciences and Geomechanics Abstracts, vol. 14. pp. 139-145. [ Links ]
Murie, A. 1980. The regional effect of leaving unpay blocks of ground and/or a system of regular spaced rib pillars for the scattered mining areas above 2238 level. Internal memorandum. Elandsrand Mine. [ Links ]
Russo-Bello, F. and Murphy, S.K. 2000. Longwalling at great depth in a geologically disturbed environment - the way forward. Journal of the South African Institute of Mining and Metallurgy, vol. 100, no. 2. pp. 91-100. [ Links ]
Ryder, J.A. 1988. Excess shear stress in the assessment of geological hazardous situations. Journal of the South African Institute of Mining and Metallurgy, vol. 88. pp. 27-39. [ Links ]
Salamon, M.D.G. and Wagner, H. 1979. Role of stability pillars in the alleviation of rockburst hazards in deep mine. Proceedings of the 4th Congress of the International Society for Rock Mechanics, Montreux, vol, 2. pp. 561-566. [ Links ]
Scheepers, L.J., Hofmann, G, and Morkel, I.G. 2012. The study of seismic response to production for a grid mining layout. Proceedings of the Second Southern Hemisphere International Rock Mechanics Symposium (SHIRMS 2012), Sun City, South Africa, 14-17 May 2012. Southern African Institute of Mining and Metallurgy, Johannesbrg. pp. 387-406. [ Links ]
Stankiewicz, T. 2000. Seismic Hazard Estimations for remnants in the 2K, 2F, 2P, 2G blocks Reef. AngloGold Consultancy Reports, GeoHydroSeis. [ Links ]
Stankiewicz, T. 1998a. Preliminary estimation of seismic hazard for Vaal Reefs No. 11 Shaft. Internal Report. Anglogold. [ Links ]
Stankiewicz, T. 1998b. Estimation of seismic hazard associated with reef blocks. Internal Report. Anglogold. [ Links ]
Tanton, J., McCarthy, T., and Hagan, T. 1984. Introduction of stabilizing pillars to reduce rockbursts at Western Deep Levels. Proceedings of the 1st International Congress on Rockbursts and Seismicity in Mines, Johannesburg. pp. 245-252. South African Institute of Mining and Metallurgy, Johannesburg. [ Links ]
Wiles, T., Lachenicht, R., and Van Aswegen, G. 2001. Integration of deterministic modelling with seismic monitoring for the assessment of the rockmass response to mining: Part 1 Theory. Proceedings of the Fifth International Symposium on Rockbursts and Seismicity in Mines. Van Aswegen, G., Durrheim, R.J., and Ortlepp, W.D. (eds.). Symposium Series S27. South African Institute of Mining Metallurgy, Johannesburg. pp. 379-387. [ Links ]
Paper received Jul. 2013
Revised paper received Apr. 2015.

