


Services on Demand
Article
 English (pdf)
 Article in xml format
 Article references
Indicators

Related links
-
 Cited by Google
 -
 Similars in Google
Share

 Permalink
Journal of the Southern African Institute of Mining and Metallurgy
On-line version ISSN 2411-9717
Print version ISSN 2225-6253
J. S. Afr. Inst. Min. Metall. vol.115 n.11 Johannesburg Nov. 2015
http://dx.doi.org/10.17159/2411-9717/2015/v115n11a13
PAPERS OF GENERAL INTEREST
The economics of exhaustible mineral resources - concepts and techniques in optimization revisited
C. Hutton
Brenthurst Capital Resources
SYNOPSIS
The last commodities supercycle (2003 to 2011) was characterized by a belief in volume at any cost, where absolute output was deliberately prioritized over productivity considerations. This practice fuelled over-optimistic forecasting and planning, which in turn contributed to the economic crisis that followed. The sudden collapse of commodity prices has resulted in mining companies scrambling to find the right balance between optimizing current operations and preserving sufficient flexibility to grasp future opportunities. The runaway costs of building and operating mines have almost squeezed out profit margins, while lower ore grades are inflating production costs. Mining companies therefore need to look at the business with fresh eyes, and develop strategies to attract equity capital as traditional approaches are simply not working anymore. This is especially so in the context of a dwindling investor base that continues to demand greater returns, despite a significantly lower appetite for risk. This paper revisits the micro-economic concepts and demonstrates how pressure from shareholders to prioritize output contributed to spiralling costs and value destruction. Practical techniques are described to model cost curves to optimize a Mineral Resource endowment and address the need to right-balance a business and preserve agility.
Keywords: production prioritization, economies of scale, u-shaped cost curves, optimal rate of production, maximum Mineral Resource utilization, sustainable gains, sustainable shareholder returns
Introduction
Henry Lazenby (2014) for the Mining Weekly writes, 'Bruised and battered, the global mining industry today is undergoing a sea change. Practices and policies that might have worked wonders in the past are not as relevant today, and new approaches to running profitable mining operations need to be found.' One significant practice the mining industry had during the last commodities supercycle (2003 to 2011) was chasing volume at any cost; absolute output was deliberately prioritized over productivity considerations (Goldsmith, 2013). Lazenby contends that in the face of falling and volatile commodity prices, many mining majors 'across all commodity groups are currently grappling with sagging profits and low company valuations. This is often regarded as the result of the industry's "sins" of the past, when companies were in pursuit of growing their output at all costs in a high commodity price environment.' Lee Hodgkinson, KPMG's Canadian mining industry leader and quoted by Lazenby, says that 'mining companies are now trying to find the right balance between optimizing current operations and preserving their agility to grasp future opportunities. The runaway costs of building and operating mines have almost squeezed out profit margins [whilst] lower grades of ore are inflating production costs. Mining companies need to look at the business with fresh eyes, and develop strategies to attract equity capital as it seems clear that some of the traditional approaches to the mining business are simply not working anymore.'
It is the intention of this paper to challenge the practice of chasing production and to provide an alternative practice in support of miners 'looking to optimizing current operations whilst preserving their agility to grasp future opportunities.' To address this issue the micro-economics of a mining business are revisited, integrating multifarious concepts to consider the optimal economics of exhaustible mineral resources. Minnitt (2007) states that the challenge of the past has been that while much has been written on the subject of classical economic concepts, adoption has been slow and limited. Minnitt concedes that in the past, academic literature on the subject did not provide much in the way of usable concepts and techniques, and consequently practitioners relegated these concepts to academia with no practical application in the real world. Moreover, in a related publication he suggests that the subject matter is often shrouded in 'complex mathematics that detracts from its value and as a consequence has not been as widely applied as might otherwise be the case' (Minnitt, 2004). Considering the need for miners to 'look at the business with fresh eyes' and Minnitt's concerns about the lack of usable concepts, this paper seeks to address both challenges in pursuit of the optimal economic extraction of an exhaustible mineral resource.
To do justice to this subject matter it is necessary to address it in three parts, namely:
► Part 1-Prioritizing of the rate of production
► Part 2-Modelling the rate of production
► Part 3-Integrating the rate of production with economic mineral resource modelling.
Part 1 explores the prevailing hypothesis that increasing output will deliver continuing economies of scale compared to the alternative hypothesis of Minnitt et al. that considers U-shaped cost curves implying an optimal level of production, while Part 2 addresses Minnitt's lamentations that the tools and techniques were not available at the time of writing his paper and therefore adoption of his hypothesis was slow if, at all. The techniques articulated rely on accepted econometric techniques and empirical data-sets. Part 3 focuses on incorporating the U-shaped cost curves in an integrated model to consider both the cost curve and an orebody's 'DNA' exemplified by a grade-tonnage curve to estimate the maximum value creation over the life of the orebody.
Prioritizing the rate of production
The stagnation of commodity prices through the 1980s and 1990s discouraged producers from investing in capacity expansions. During the following decade global commodity prices soared, driven by strong demand from emerging economies, with the boom exceeding that of the 1970s in both duration and magnitude (Connolly and Orsmond, 2011). Mining companies responded rapidly by prioritizing capacity expansions to capture greater market share. This narrative soon translated into 'Go Big or Go Home' as the prevailing rationale dictated that in addition to capturing a greater market share, increased scale also promised enticing productivity gains that were simply too good to forego. Shareholders soon started rewarding those stock companies that could articulate growth strategies and large project pipelines. Examples of this strategy included Anglo Platinum, who advised in 1999, that its 'board has made the decision to increase its production from the 1999 calendar year base of some 2 million ounces to 3.5 million ounces by the end of calendar year 2006.'1 As recently as 2013, Endeavour Mining expanded the Tabakoto mill from 2000 t/d to 4000 t/d, while BHP Billiton was considering further expansions at the world's largest mine, Olympic Dam.
Fast-forward to 2015, and mining companies that had been riding the 'supercycle' of higher commodity prices supported by demand from emerging markets now find that their profit margins are being eroded by falling commodity prices and out-of-control cost inflation. Their response has been to announce aggressive cost reduction programmes that include reducing headcount, closing unprofitable operations, and deferring capital expenditure to reduce cash costs. While these actions 'might be effective in reducing controllable cash costs in the near term', Goldsmith (2013) cautions that in the long-term, 'sustainable gains which depend on strong underlying improvements in the efficiency of operations and invested capital may be compromised.' Ernst and Young (2013) bemoan that 'the same investor base who so long ago was pushing for growth and rewarded those that had the most attractive growth pipeline, now has a lower appetite for risk but at the same time is still is demanding greater returns.' To be successful at restoring investor confidence, miners will need to more fully understand the potential impact of macro- and micro-events ... and consider new approaches to running profitable mining operations if they are to continue to survive and thrive (Lazenby, 2014)
Two schools of thought
While it is accepted that there is no single panacea for driving sustainable profitability, one significant factor often overlooked is the cost of not challenging the prevailing hypothesis of the micro-economics of the business of mining. Two key classical micro-economic concepts have been contested during this last supercycle. While miners embraced the concept that increasing rates of production would yield greater productivity and profitability, academics warned that prioritizing mass production at all costs had a fatal flaw. Minnitt (2007) articulates the case for diseconomies of scale being realized, maintaining that beyond a critical level of production total unit costs begin to rise, eliminating any further gains and risking diminishing returns. In this section the two hypotheses will be considered.
Support for prioritizing production at all costs Rudenno's (2008) work supports the notion of continued economies of scale as production output is successively increased. He derived what he describes as 'power' cost curves from a data-set of 95 mining development projects located in 33 countries. The data-set includes base metal, precious metals, coal, uranium, and iron ore projects. An example of one of these power curves is shown in Figure 1. An equation describing the regression curve in Figure 1 is:

where T is in Mt/a.
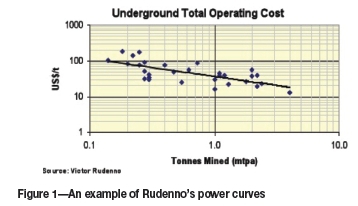
Similar curves with best-fit regression lines have been derived for capital costs, mining costs, and processing costs, differentiating between opencast and underground mining operations. These regression equations have been applied by Rudenno to determine expected capital investment requirements and associated total unit costs at different levels of production. While Rudenno cautions that this tool represents an average that requires refinement, it nevertheless implicitly supports the hypothesis that continuing economies of scale can be achieved with increased levels of production. To demonstrate this, Rudenno's equation (Figure 1) is used to derive the classical micro-economic curves illustrated in Figure 2. (The micro-economic theory concepts of average total costs (ATC), average fixed costs (AFC), average variable costs (AVC), and marginal costs (MC) are well established in academic literature.)
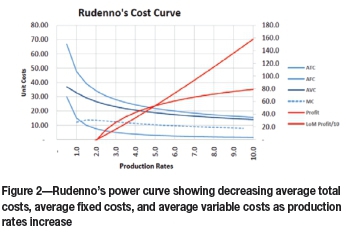
In Figure 2, as the rate of production (described on the horizontal axis) is increased, the ATC continue decreasing, implying continuing economies of scale. The benefits of adopting this hypothesis are seemingly obvious in that as higher volumes are mined, so lower ATC translate into increased profit margins which in turn translate into increasing shareholder returns. Most significantly in a rising price environment, this benefit is amplified as increased output/sales also attract increased revenue, compounding profit margins already inflated from gains realized through economies of scale. This hypothesis provided a compelling argument in support of 'Go Big or Go Home', and miners who prioritized production during the last supercycle were rewarded by the market accordingly.
Support for an optimal rate of production
Minnitt (2007) proposed an alternative hypothesis of cost response in relation to increases in production. He reproduced an S-curve after Pappas and Hirschey (1985) and Sesink-Clee (1991), describing the theoretical relationship of cost to varying rates of production in absolute terms and illustrated in Figure 3. If q is the rate of production the total cost, with fixed costs (FC) of 20, is given by Equation [2].
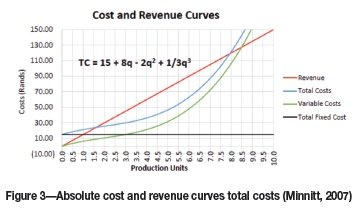

With a commodity price of ZAR2 15 per ton, the total revenue (TR) is given in Equation [3].

The equations are illustrated in Figure 3 indicating that the cost curve is not linear in nature but rather concave.
The total cost (TC) curve indicates that beyond nine units of production, profits are negative and therefore no further economic benefits can be achieved by further prioritization of output. To compare Rudenno's curve with those of Minnitt et al., the cost curves illustrated in Figure 3 are reduced to unit costs consistent with classical micro-economic curves and illustrated in Figure 4.
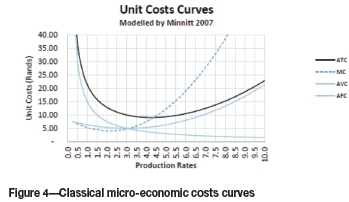
The underlying hypothesis of these curves is clearly evident and suggests that an optimal rate of production exists (4.5 in this example), beyond which point diseconomies of scale are realized. The challenge, however, is that while the theoretical basis has been demonstrated by Minnitt (2007), no empirical evidence was presented to support this hypothesis, as in the case for Rudenno.
Empirical evidence
Miners have been exhorted to better understand the macro and micro events contributing to the industry's costs inflation if they are to survive. Minnitt (2007) has implicitly proposed that a significant part of a mining enterprise's inflation can be attributed to rising costs related to increased production that extends beyond an optimal level of production, and that profitability is compromised beyond this optimal level. The 2003 to 2011 supercycle can be considered a useful global 'experiment' for testing the robustness of the hypothesis that significant benefits can be achieved by prioritizing production, as exemplified by Rudenno's curves.
Gravelle et al. of PwC (2014) published a report in which the financial performance of the world's top 40 miners was consolidated. Figure 5 illustrates that for the period 2004 to 2013, revenue increased at a compound annual growth rate (CAGR) of 11%, which was attributed to both rising commodity prices and an expansion in output. On the cost frontier, total costs increased on a CAGR basis of 12%, while operating costs on a CAGR basis rose at a slightly lower CAGR rate of 10%, albeit matching the trend in revenue. The steady increase in operating costs can conceivably be attributed to the general rise in costs as a result of competition for high input factor costs.
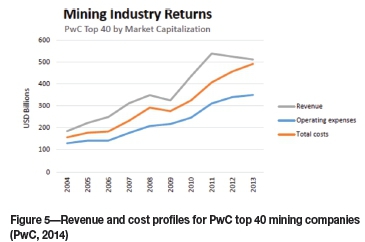
The divergence in total costs and operating costs evidenced in the cost trends for the period is the result of escalating non-cash line items such as depreciation, amortization, and impairment, which escalated by over 7000% on a CAGR basis for the period. Despite being a non-cash item, these costs impact on shareholders' returns insofar as they reduce profits legally available for distribution while cash remains unavailable for distribution. It is often stated that only cash costs are relevant, but it is argued that any barrier to shareholders' claims to cash should be considered with equal merit. One technique now being invoked to reduce the depreciation and amortization charge is to impair assets and thus mask the redundancy of previous investment activity. Since miners were encouraged to increase capacity and invest in new mining projects it is not surprising that depreciation and amortization would also increase, but perhaps not at the rate reflected.
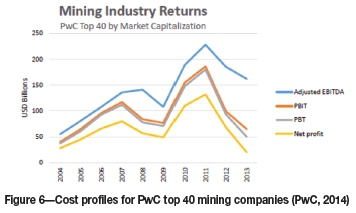
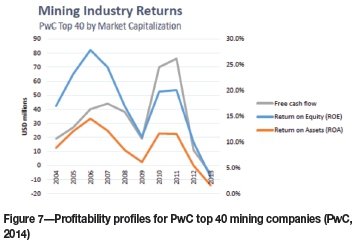
Despite the upward trend, the profitability of the top 40 miners illustrated in Figure 6 for the period 2004 to 2011 was significantly less than what shareholders could have expected had yields been maintained or improved. Since increasing output was based on the premise that greater economies of scale would be achieved - implying improved productivity - financial yield metrics should have registered positive trends too. Counter-intuitively, free cash flow (FCF), return on equity (ROE), and return on assets (ROA), illustrated in Figure 7, all trended downwards for the most part of the commodity boom. Although profitability 'bubbles' can be seen, these benefits were wiped out when massive impairments were raised in the accounts of miners, which in turn caused a free-fall in their respective share prices - all well documented. Invoking the total shareholder return (TSR) metric for a period extending beyond 2011 will most likely diminish the exuberance of the short-term gains posted and provide a more sobering assessment of the strategy to prioritize production. That said, these profitability trends belie the fact that any productivity gains anticipated by prioritizing production were simply not realized, and if anything, contributed to a macro and micro environment that conspired to inflate costs exponentially.
In short, the empirical evidence does not support the hypothesis of continuing economies of scale as output is increased. If anything, the progressive overall increase in production caused price disequilibrium in the macro environment for both input factors and ultimately the precipitous fall in commodity prices as inventory stocks reached saturation. Any gains to shareholders evaporated, making a mockery of the notion of sustainable long-terms gains. Treadgold (2015) cites Citigold, who state that companies such as Rio Tinto are 'digging their own graves' with overproduction. Treadgold also writes that undeterred by the evidence, the mining industry ploughed ahead in what has now become a self-destructive race to the bottom as big, low-cost miners chase market share so they can claim the title of 'last man standing'.
Comparing the implications of the alternative hypotheses
It can be demonstrated that the prevailing hypothesis in the mining industry, best articulated by Rudenno's work, may have been a significant contributor to the sustained erosion of margins and profitability. Using Rudenno's information, a financial model was constructed to compare the effects and implications of the two cost hypotheses described. By way of demonstration, Figure 8 illustrates two curves; the first assumes constant economies of scale in line with Rudenno's work, and the second, with an arbitrarily selected level/point of cost inflexion, implies diseconomies of scale in line with Minnitt et al.
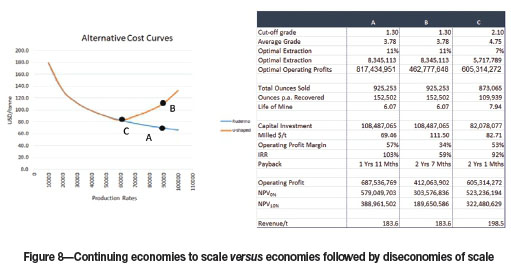
A number of metrics are detailed in the spreadsheet in Figure 8, the critical metrics being net present value (NPV), internal rate of return (IRR), capital investment, and total average cost (TAC). Three points of measure are illustrated: A, B, and C.
In this example and at a rate of production of 90 kt/ month, point A reflects superior economic metrics when compared to point C. By comparison, point A anticipates a NPV10% of US$389 million, an IRR of 103%, and a TAC of US$70 per ton. In contrast, point C reflects a NPV10% of US$322 million with an equivalent IRR of 92% and TAC of US$83 per ton. Considering these two outcomes, point A undoubtedly represents superior returns and a rate of production that should therefore be adopted. Surely the case for prioritizing production is made?
If, however, the U-shaped cost curve of Minnitt et al. is operative, an alternative set of economics will be realized for a rate of production of 90 kt/month and represented at point B. The corresponding NPV10% at point B is US$189 million with an equivalent IRR of 59% and TAC US$112 per ton. The metrics of point B are less compelling than the metrics of point C, and herein lies the rub.
Firstly, adopting point A's level of production in favour of point C's level of production requires a greater capital investment. Secondly, if shareholders are advised that the returns of point A are to be expected, when in fact the returns of point B will be realized, management's credibility will suffer. Thirdly, the profit anticipated at point A will be diminished to almost half in this example, implying that an opportunity cost is foregone when compared to point C. Furthermore, while lower profits are registered, commodity output is greater comparing points B and C, feeding surplus product into the macro-economy, which arguably will contribute to price reduction and further reduce profitability. Point C represents an optimal level of production achieving the highest level of profitability while at the same time delivering less product to market and thereby enabling equilibrium price stability.
Discussion
Consulting houses called upon to assist miners in this predicament report that the tendency is to focus on productivity improvement, cost control, capital allocation, improved portfolio planning, innovation and efficiency, and the leveraging of available resources. In short: repackaged consulting products with new spin. This paper, however, challenges a fundamental paradigm against the backdrop of the empirical evidence presented by PwC (2014). With the benefit of hindsight it is difficult to see how increased output achieved the investment returns anticipated by miners and shareholders alike. From the evidence it seems that increasing output had the opposite effect on investment returns, as highlighted in the previous section, and that ignoring diseconomies of scale can result in unfulfilled expectations and cause miners to invest in over-capacity that can never deliver the anticipated financial returns as envisaged by the 'Go Big or Go Home' advocates. It is argued that while it may be tempting for some miners to rationalize the causal relationship of industry inflation in macro-economic terms, concluding that they had little or no control, more astute miners may wish to reconsider the insights of Minnitt et al. If this is indeed so, perhaps miners should be considering more fundamental questions such as:
► How to best extract maximum economic value from existing exhaustible resources in a sustainable manner that achieves the right balance between optimizing current operations and still preserving their flexibility to grasp future opportunities?
► How do miners optimally manage lower grades of ore contributing to production cost inflation in addition to cost increases related to micro- and macro-economic forces?
► How do miners minimize the pressures of having to replace good orebodies with new discoveries?
► How do miners determine optimal levels of production to ensure that investment activities yield maximum yield and avoid overcapitalization and redundancy?
► How do miners weather the commodity cycle and preserve profit margins so as to avoid a repeat of record impairments and keep non-cash costs in check in order that profits can be distributed to shareholders without reverting to impairment strategies?
► How to profitably extend the life of existing projects to maximize value considering that miners exploit exhaustible resources?
It has been established that Minnitt et al's hypothesis implies that expanding the capacity of production units to the point where diseconomies of scale are realized serves only to compound inflationary effects as unit costs start rising independently of industry cost pressures. Miners typically respond to rising costs by high-grading their 'endowments', and more so when commodity prices start falling. This reaction inevitably leads to a vicious spiral as a high-grading strategy shortens mine life; and shortened mine life can result in smaller mineable reserves, which in turn results in premature exhaustion of mineral resources, leading to a further round of impairments and accelerated depreciation charges.
The author therefore agrees with Goldsmith (2013), who warns that miners' ... reaction of headcount reductions and expenditure curtailment might be effective in reducing controllable cash costs in the near term, but that long-term sustainable gains depend on strong underlying improvements in the efficiency of operations and invested capital.' To achieve this the author echoes Lazenby's advice that in order for mining companies to survive in an increasingly hostile environment, 'mining companies need to look at the business with fresh eyes . as it seems clear that some of the traditional approaches to the mining business are simply not working anymore.'
Part 2 of this paper will look at tools and technique to apply Minnitt et al's hypothesis to empirical data-sets to establish a foundation for an integrated modelling technique for mineral resources that will provide miners with the tools to optimize operations while at the same time giving them the flexibility to take advantage of commodity cycle opportunities.
Modelling the rate of production
In Part 1 of this discourse namely, revisiting the economics of exhaustible resources, the case for considering Minnitt et al's (2007) U-shaped cost curve hypothesis was presented and compared to that of continuing economies of scale with increased production exemplified by Rudenno's (2008) work. Empirical evidence of the world's top 40 mining companies, sourced from PwC, does not support the hypothesis of continuing economies of scale as pursued by miners during the past decade. Considering yield trends (return on equity and return on assets) it is hard to see how shareholder value creation was a priority, as these metrics trends declined on average during the supercycle (2003 to 2011) for the top 40 mining companies. Since this was not the expected outcome, Minnitts et al's (2007) hypothesis of diseconomies of scale was revisited and the implications of a U-shaped cost curve considered. Minnitt et al's hypothesis provides a compelling case for the micro-economic effects affecting and amplifying cost inflation during the decade long supercycle.
The challenge for miners has been the ability to apply Minnitt et al's (2007) hypothesis. Minnitt conceded that in the past, academic literature on the subject did not provide much in the way of usable concepts and techniques and consequently practitioners relegated these concepts to academia with no practical application in the real world. Moreover, in a related publication he suggests that the subject matter is often shrouded in 'complex mathematics that detracts from its value and as a consequence has not been as widely applied as might otherwise be the case' (Minnitt, 2004).
Minnitt's challenge is now embraced and this section endeavors to describe practical techniques in applied microeconomics in deriving U-shaped costs curve from empirical data-sets. A graphical format is relied upon in an effort to demystify the mathematics and to demonstrate that these concepts and techniques are easily applied using modern desktop computing.
Curve fitting and the selection of a functional form
The econometric technique of regression analysis is invoked to assist with deriving the classical curves. It is perhaps useful to pause for a moment and consider the frame of reference in the application of the econometric techniques and principles relied upon by the author. According to Studemund (1992), econometrics is the quantitative measurement and analysis of actual economic and business phenomena. He explains that econometrics attempts to quantify economic reality and bridge the gap between economic theory and business reality using techniques that bridge the gap between useful concepts and practical methodologies. To this end, Studemund dedicates an entire book to the science of single-equation linear regression analysis (SLRA). While this is an exhaustive work, summarizing the basic principles advanced by Studemund is useful in that it provides a common frame of reference. The first and most significant step after considering the quality of the empirical data-set in SLRA is the selection of the functional form. In selecting an appropriate functional form, the following guidance is provided by Studemund:
► Theoretical considerations usually dictate the form of a regression model;
► The basic technique involved in deciding on a functional form is to choose a shape that best exemplifies the underlying economic or business principles and then to use the mathematical form that produces that shape
► The choice of a functional form is a vital part of applied regression, requiring a good understanding of economic theory and common sense.
A second and important point of reference that the author offers is the concept of 'linear' regression. While linear regression is often thought to be a linear construct (a straight line). it is significant to consider that many different 'nonlinear' functional forms are used in linear regression, including exponential, semi-log, polynomial, and inverse expressions among others in addition to the straight line. Linear regression therefore refers to an equation that is linear in its coefficients rather than linear in its variables. This important note is significant as it provides the basis of the technique described below. A quadratic function, for example, can therefore be used in SLRA to describe a particular econometric function and still honour the rules of linearity. When considering micro-economic theory and Minnitt et al's hypothesis, the U-shaped cost curve can be described by a quadratic equation that can be used in an SLRA construct. For the purposes of this paper these principles are accepted, but for fuller discourse of this field of study the reader is referred to Studemund (1992).
To scientifically apply SLRA, Studemund outline the following steps:
1. Model specification (functional form)
2. Data collection (sufficiently descriptive, sufficiently granular)
3. Estimation and evaluation of the equation (Excel regression tool)
4. Results (interpretation based on common sense). This framework is adopted and described below to derive Minnitt's U-shaped cost curve based on an empirical data-set.
Derivation of u-shaped cost curves from empirical data
Model specification
Kohler (1992) describes three micro-economic functional forms, namely: constant economies to scale, continuous economies to scale and economies/diseconomies to scale, with the latter option defining U-shaped cost curves. In Part 1 of this discourse two functional forms were considered and compared, namely: continuous economies to scale best, described by Rudenno's work, and economies/diseconomies described by Minnitt et al. Constant economies is not considered as empirical data, suggesting that mining costs do indeed benefit from increased output, but perhaps not without regard to Minnitt et al's hypothesis.
Data collection
The empirical data used was sourced from a reputable mining company and describes the production rate and cost per ton data for the period 2004 to 2006 for a single mine. Before using this data it was normalized to account for inflation, with the base year being 2006. This data is plotted on the theoretical curve in Figure 9.
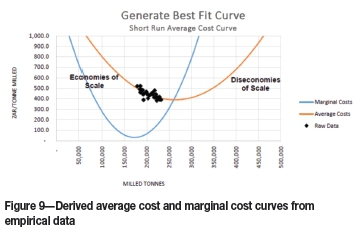
Estimation and evaluation of the equation
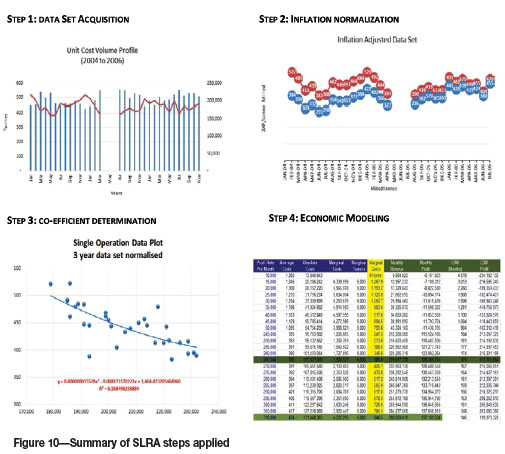
Figure 10 describes four key steps in the derivation of the cost curve based on an empirical data-set. The table formulated in Step 4 is similar to Minnitt's construct and is graphically illustrated in Figure 9. The average cost curve with its marginal cost curve are plotted reflecting the classical economic curves described by scholars after Minnitt (2007) and Kohler (1992). Steps 1 and 2 illustrate the normalization of unit cost data collected for the period 2004 to 2006, while Step 3 adopts a polynomial expression, namely x2 + x + c, based on the theoretical understanding after Minnitt et al. The derivation of this curve is relatively simple given the principles of SLRA and desktop computing. The standard Excel regression toolkit was used to derive the regression equation. The polynomial functional form selected is based on economic theory after Studemund (1992).
Results
In this 'real world' example, the average cost curve is intersected by the marginal cost curve at a rate of production of 265 kt/month. Considering the plotted data points from the data-set (green circles), the inference is that economies of scale can still be achieved by increasing the rate of production to 265 kt/month. In the context of this paper, 256 kt/month is the optimal rate of production beyond which diseconomies of scale will be realized, implying that beyond this point of production, unit costs will start rising.
Discussion
Minnitt (2007) bemoaned the fact that miners were slow to adopt classical micro-economics for two reasons: the tools and techniques were unavailable; and the concepts were often shrouded in complex mathematics. It has been conclusively demonstrated above that this is no longer the case and that provided historical costs have been retained, miners can very easily apply the technique outlined. Importantly, and having demonstrated the techniques and tools and how accessible these are, it is probably worth considering Studemund's cautionary remarks with regard to black-box thinking and the importance of critical evaluation. Studemund states that:
Any good econometrician is one who can diagnose faults in a particular approach and can figure out how to repair them. The limitations of regression analysis must be fully perceived and appreciated when using the technique and its findings ... [which can largely be overcome by] a good understanding of economic theory and common sense.' It is probably appropriate to state too that in the world of estimation it is common sense to understand that results are approximations with inherent windows of error, and therefore this technique seeks to achieve results that are approximately correct rather than precisely incorrect - to invoke an old proverb.
This technique has not, however, been without its critics. Some mining practitioners have suggested that Studemund is incorrect in his position that economic theory should dictate the functional form and that the functional form should rather be determined by considering the data and its spread. The illustration above (used to demonstrate the technique) exhibits data that posts to the left of the point of inflexion of the average cost curve, and no data-points are exhibited to the right of the point of inflexion. As a consequence, some mining practitioners have been quick to dismiss the technique as flawed on the basis that the curve seemingly does not honour the data.
While the issue of data not exhibiting to the right of the point of inflexion may cause some practitioners some unease, it is argued that incomplete data-sets should not be the single justification for dismissing this technique. Indeed, when considering Studemund's work and the widely used technique of SLRA notwithstanding Minnitt et al's work, it is argued that this technique has the necessary theoretical and applied support. Moreover, consideration should be given to the fact that this curve represents a pre-2011 data-set, and is likely to now exhibit data-points beyond the point of inflection, assuming the interpretation of the empirical data supplied by PwC is correct.
Despite this argument it is conceded that there may be continued reluctance by mining economists to adopt Minnitt et al's hypothesis and the techniques described above until sufficient examples of data-points to the right of the inflexion point are forthcoming. Post the recent commodity supercycle and considering that the prioritization of production did not realize the anticipated results and financial returns (when considering the empirical data presented by PwC), perhaps it is now an appropriate time to re-run this technique on larger data-sets to provide practitioners with the required comfort. Mining companies that are looking at the business with fresh eyes and who are willing to challenge some of the traditional approaches may wish to reconsider the causal relationship between increasing production and anticipated economies of scale.
A second topic of importance is the consideration that the above analysis has only considered costs with respect to, and related to, ore tons. While it can be easily argued that the cost per ton of ore is the appropriate metric to understand input costs, consideration has to be given to cost per output of the commodity mined, namely: cost per ounce, cost per pound etc. Failure to consider both cost metrics may also lead to results that do not yield desired outcomes. The challenge is probably best explained as follows.
Whilst costs are generated by volumes of ore tons mined, the ultimate measure of performance is cost per unit of commodity mined. To confirm this, most (if not all) industry cost curves exhibited by market analysts consider only the cost per unit of commodity produced. It is therefore worth highlighting that this metric is complicated by the fact that some producers who may be cost-inefficient on a cost per ore ton basis are saved by virtue of mining a high-grade ore deposit. Cost efficiency and cost discipline therefore can only be measured on a cost per ore mined/processed basis rather than on the cost per unit of commodity produced. Not to do so is to disguise the opportunity cost of ill-discipline.
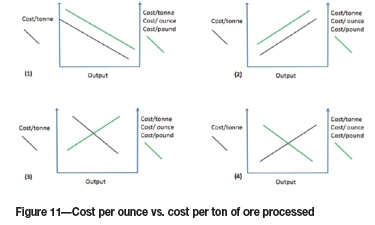
To illustrate this concept attention is drawn to Figure 11, which attempts to explain the dilemma graphically. For example, if one had two identical gold deposits (or copper, nickel, etc.) and one was high grade while the other low grade, and both produced the same output or rate of production, then the low-grade deposit would post a higher cost of production as compared to the higher grade deposit using the US$/ounce metric. Perversely, the lower cost producer could be the more cost-efficient miner when measured on a cost per ore mined/processed basis. Four different scenarios can be determined given this construct. Figure 11 illustrates the issue:
► Frame (1) depicts reductions in unit costs for both ore tons produced and the cost per unit of commodity. Both trends are negative sloping, implying that true economies of scale are being achieved
► Frame (2) illustrates where diseconomies of scale are being realized as both metrics show a positive trend, being the scenario that miners would wish to avoid
► Frame (3) describes a scenario where production tons are prioritized at the expense of commodity tons - in essence the deposit is not being managed to achieve the maximum shareholder returns. Possible reasons could be that either that significant dilution is being realized or the average mined grade of the deposit is suboptimal
► Frame (4) depicts the mirror image of scenario 3 and could be the result of high-grading the mineral endowment to drive short-term cash flows at the expense of life of mine and sustainable long-term returns.
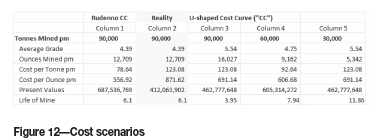
By extension of this logic and referencing metrics from the integrated modelling technique, presented below, it can be demonstrated that increasing the grade without consideration to reducing the rate of production is harmful to future returns. In column 1 (Figure 12) and having applied the hypothesis of continuing economies of scale, it is anticipated that 12.7 thousand ounces of gold per month (kozpm) will be produced at an operating cost (including royalty fees) at US$78.64 per ton and an associated US$ 556.92 per ounce. If the reality is that a U-shaped cost curve is operative and keeping the same rate of production and grade constant, the metrics realized will be US$123.08 per ton and US$871.62 per ounce(column 2). If in fact this is the reality then typically miner will raise the cut-off grade to increase the average grade in an effort to reduce unit costs - being costs per ounce in this case (column 3). This strategy does not affect the cost per ton, which remains at US$123 (column 4). However, the cost per ounce falls from US$871.62 to US$ 691.14. This is typically termed high-grading and is a useful strategy to generate near-term cash flows but is not without long-term consequences. High-grading affects life of mine, and in this example it is almost halved from over 6 years to just under 4 years with present values increasing only marginally (column 3) from US$412 million to US$462 million. Increased NPV is often cited as a good enough reason to support a particular strategy, but this should always be considered in the context of alternative strategic outcomes. It is noteworthy that the practice of high-grading results in similar economic metrics when mining at a rate of 30 kt/ month (ktpm) (column 5), but with the exception that mining at 30 kt/month leads to a longer life of mine and is therefore a superior strategy to high-grading. High-grading also introduces another significant business risk, namely that the shorter the life of a deposit the greater the risk with respect to replacing it with a similar or better deposit, notwithstanding that additional development capital investment is required. High-grading is therefore not a sustainable strategy and is harmful to shareholder returns even if it generates higher near-term cash flows. Given this example, the only feasible and sustainable strategy would be to reduce the rate of production (assuming that a U-shaped cost curve is operative) to harness economies of scale and increase profitability. Column 4 illustrates that the average mined grade of 4.75 g/t is lower than the high-grading strategy of 5.54 g/t and yet produces a higher present value as a result of lower unit costs; US$92.64 per ton and US$606.68 per ounce.
PwC, quoted in Part 1 of this paper, was critical of short-termism and stated that while 'miners' current survival actions may be effective in reducing controllable cash costs in the near term, long-term sustainable gains which depend on strong underlying improvements in the efficiency of operations and invested capital may be compromised. The discussion relating to Figure 3 can be summarized below in Figure 4. Frame 1 represents true economies of scale as both metrics (ore unit costs and commodity unit costs) fall in tandem. Frame 2 illustrates the scenario where diseconomies of scale are realized and should be avoided. Frame 3 represents a strategy where cost per unit of ore reduces whilst the cost per unit of commodity rises. This typically happens when miners focus on driving the unit cost of ore production down at the expense of grade and is perhaps the most unprofitable strategy as the reduction in grade causes the production cost of the commodity produced to spiral, thereby negatively impacting on revenue. Frame 4 describes a high grading strategy described above where the unit cost of the commodity produced reduces whilst the unit cost of ore mined spirals upwards.
This discussion with respect to Minnitt et al's work highlights the fact that if economies of scale are considered without regard for the commodity being mined, then achieving economies of scale for every ore ton mined may result in an outcome illustrated in Frame 3 of Figure 4, being the least desirable outcome after Frame 2. Minnitt et al's framework does not consider this and assumes a fixed grade and mineral endowment. Previous work by Minnitt (2004) does consider the optimization of the cut-off grade, but he does not integrate the two concepts. In Part 3 a framework is presented integrating the derivation of the optimal cut-off grade with the concept of economies of scale and adopting a U-shaped cost curve.
Integrating the rate of production with economic mineral resource modelling
Guzman and Bhappu (1995) concluded that net present value (NPV) and internal rate of return (IRR) criteria were the most commonly used metrics for mining investments while payback period was a secondary, albeit important, consideration. NPV is a rigorously definable concept that maximizes the total wealth and is therefore the most suitable elementary objective to be maximized in the estimation of the economically optimum production capacity. It is, however, recommended that the assessment of a proposed mining venture should be supplemented by the measures of wealth growth, payback period, and payback time lag. In considering Minnitt et al's (2007) hypothesis it was noted that the author considered that the discussion by Minnitt on economies of scale was divorced from determining cut-off grade and therefore determining the maximum grade and payability of an exhaustible resource. It was shown that two cost metrics prevail as they relate to cost in mining economics, namely: cost per ore unit and cost per unit of commodity produced.
Optimizing one without regard for the other will - in the author's opinion - lead to a suboptimal result in maximizing NPV. What is required is a formulation that considers both these metrics and demonstrates how present value and then NPV can be maximized. Van Heerden (2015) offers a modelling concept that resonates a simple yet sophisticated outcome. Van Heerden demonstrates the underlying grade-tonnage curve which can be used to compute the profit maximizing cut-off grade that is peculiar to a specific mineral resource. However, by combining both Minnitt's and Van Heerden's work into a single integrated modelling tool, the author believes that a superior outcome is achieved in the economic modelling of a mineral resource.
Three-dimensional optimization modelling of an exhaustible resource
At the heart of this integrated technique is the use of a grade-tonnage curve to determine the optimal moments that can be supported by any given resource. It is argued that the signature of any geological deposit is measured by a grade-tonnage curve, which is useful to incorporate into an economic model. Grade-tonnage curves (Figure 13) are commonly generated by resource scientists using accepted estimation techniques such as kriging. Secondly, it is also assumed that the estimation technique allows for the construction of a grade-tonnage curve.
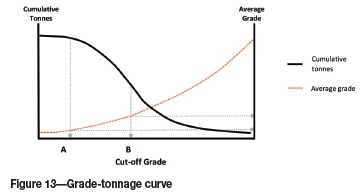
A grade-tonnage curve (GTC) graphically profiles the cumulative distribution of grade to tonnages and shows at lower cut-offs (Point A) that utilization of an exhaustible resource is high with a corresponding high payability and by implication rates of development are low as selectivity is low, but the opposite is true at high cut-off grades (Point B) (Minnitt, 2004). Importantly, the life of mine for the latter is shorter than for the former proposition defined by the cut-offs. While it is beyond the scope of this paper, save for completeness of thought, it should be noted that the slope of the GTC is affected by both the natural grade dispersion as well as the selected support size used in the estimation. This point is an important consideration when invoking this technique in optimizing the rate of production using orebody economics, as it may influence the selection of mining method, which in turn will have an effect on the rates of production.
Considering the dilemma between the costs of a unit of ore versus the cost of a unit of commodity mined as discussed earlier, the challenge is to determine the optimal trade-off between grade mined and payability of the mineral endowment. Simply put, miners have to consider the best trade-off between exploiting the endowment (Point A) versus Point B (illustrated in Figure 13) with the objective of maximizing NPV. Too high an average grade of production will result in a shortened economic life of a deposit, while too low a grade will result in suboptimal returns on investment since that longer life investments are affected by the discount rate.
The determination of the point where the highest grade can be mined for the longest period of time speaks to optimal valuation moments and maximum economic utilization. By integrating macro-economic concepts in the determination of an optimal 'cut-off' for an exhaustible resource, the maximizing moments can be easily demonstrated with a view to balancing the trade-offs between Points (A) and (B).
Model integration detail explained
Figure 14 depicts a spreadsheet representation of a grade-tonnage curve in the first instance. It illustrates a simple spreadsheet model integrating the U-shaped cost curve in the determination of an optimal cut-off grade to maximize the average grade mined for the maximum life and in so doing, maximize the NPV of a mineral endowment. The example is based on a real-world data-set for a gold mine in Africa and explains how the grade-tonnage curve and U-shaped cost curves can be integrated into a single economic model.
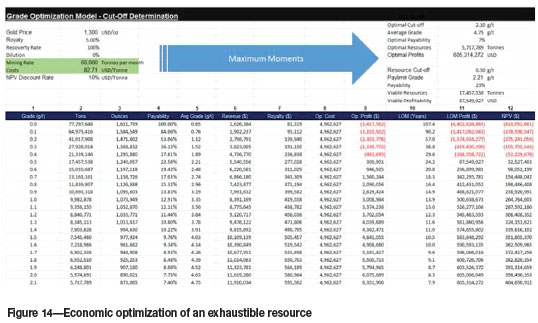
In column 1 of Figure 14 the 'cut-off' grade, defined as the minimum grade defining the cumulative tonnage of a resource, is recorded. In column 2 the cumulative tonnage of the mineral resource corresponding to the cut-off grade in column 1 is described. Column 3 describes the in situ tenor (in this case gold ounces) corresponding to the cumulative tonnage, while column 4) describes the cumulative per cent or payability of the mineral resources at varying cut-offs. Column 5 shows the corresponding average grade of the cumulative mineral resource at the corresponding cut-off grade. Columns 1 to 5 contain data that is typically generated by an estimation technique used by geostaticians describing the mineral endowment.
Typically at this point the resource is then handed over to engineer a mining reserve. It may be useful to revisit the definitions of a Mineral Resource and Mineral Reserve and to indicate that these concepts do not imply that the definition of a Mineral Reserve represents the value maximization of a mineral endowment. A Mineral Resource is typically defined as the mineralization and natural material of intrinsic economic interest which has been identified and estimated through exploration and sampling and that has reasonable prospects for economic extraction. Mineral Reserves may subsequently be defined by the consideration and application of technical, economic, legal, environmental, socio-economic, and governmental factors. By this definition, the reserve does not have to represent an economically optimized outcome to deliver maximum shareholders returns; rather it merely has to show reasonable economic returns.
It is argued that in many instances optimal economic moments are not considered and a Mineral Resource is often simply converted into a Mineral Reserve without regard for determining optimal moments to achieve maximum sustainable returns. It is argued that if micro-economic concepts are not integrated with an ore deposit's 'DNA' represented by a grade-tonnage curve, it is unlikely that a mineral endowment has been optimized.
To this end the construct, column 6 onwards in Figure 14 describes how optimal economic moments can be determined without the noise of complicated mathematics. Assuming a gold price of US$1300 per ounce, the quantum revenue moments along the grade-tonnage curve can be computed and represented in column 6. Column 7 represents a royalty rate applied and is self-explanatory, while operating costs (column 8) are considered static through the grade-tonnage curve for a fixed production rate. Column 9 represents the operating profit, which is the difference between revenue and costs, namely column 6 less columns 7 and 8. The life of mine is computed by dividing the cumulative tonnage at varying cut-off grades with the selected rate of production and is represented in column 10. Multiplying the life of mine with monthly profit, life-of-mine profit is calculated (column 11). Finally, column 12 describes the life-of-mine profits at a discounted rate. This then represents the basic mechanics of an integrated model invoking micro-economic concepts with the concept of a grade-tonnage curve to determine optimal moments for maximum economic utilization of an exhaustible resource.
The spreadsheet presented in Figure 14 can be reduced to a graphical representation as illustrated in Figure 15. The profit maximization curve representing columns 1, 5, and 11 in Figure 14 determines the optimal life-of-mine moments. In this instance, the life-of-mine profits are shown to optimize at a cut-off grade of 2.1 g/t with a corresponding average grade of 4.75 g/t where the present value of operating profits is at an optimum.
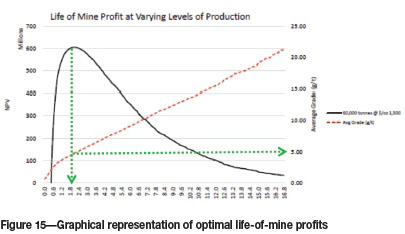
The cost of capital is excluded from consideration as this model considers the marginal cost of production in order to determine optimal moments and so avoids unduly escalating the cut-off grade, which will in turn reduce the payability and even feasibility of developing the mineral endowment. By determining the maximum present value and then deducting the capital investment estimate, the maximized NPV can be determined. In practice the present value determined in this equation represents the operating profits before capital deductions in the valuation model. The outputs of this model are then integrated in a standard valuation model incorporating capital investment, working capital, taxation etc. to determine the maximum net free cash flow (NFC).
The integrated model allows mining economic practitioners to test the impact of key variables on the optimal economics and to consider how a derived cut-off is influenced by variables such as the rate of production, unit cost of production, and the commodity price in a single integrated manner. Figure 16 illustrates how the rate of production influences the optimal cut-off grade considering that the cost of production is a function of a U-shape cost curve. The three black profiles represent varying cut-off grades for varying rates of production as a function of varying costs. The underlying cost hypothesis is a critical influence.
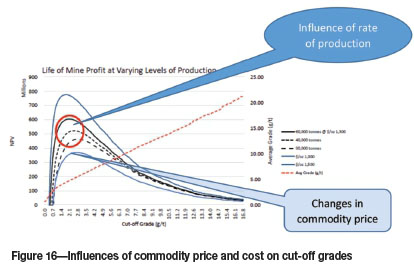
For the sake of completeness - and superimposed on the illustration - are optimal cut-off points that are influenced by the commodity price assumed. The model is therefore able to assist practitioners in understanding the influence of changing commodity prices on the optimal cut-off and therefore payability of the mineral resource endowment. In this example, gold prices of US$1000, 1300, and 1500 per ounce were applied, with the highest commodity price yielding the lowest cut-off grade and the lower commodity price yielding the higher cut-off grade.
The integration of all these concepts, namely commodity price, endowment grade, rates of production and economies of scale, and concomitant costs, can therefore be succinctly modelled. Given this framework, miners no longer have to consider the economic utilization of a mineral endowment in a segmented way. Rather, the optimal moments of a Mineral Reserve can be rapidly derived from the Mineral Resource and the impacts of key variables on the payability of the endowment comprehended.
While the illustration in Figure 16 describes how relevant moments of optimization can be displayed, Figure 17 presents a three-dimensional construct. The critical variables and the interplay between them, namely the rate of production, the cut-off grade, and the optimal life-of-mine present value, are clearly illustrated.
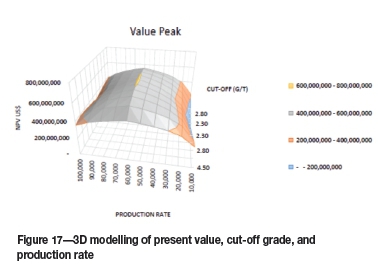
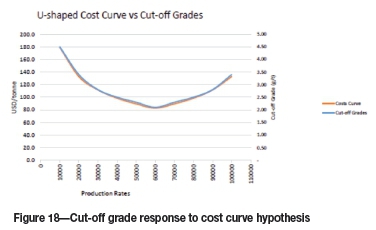
As an aside, it is worth highlighting that the cut-off grade (z-axis) declines and then increases. This is the result of the U-shaped cost curve assumed in this modelling. By way of demonstration, Figure 18 illustrates that as economies of scale are being induced through increased output, so cut-off grades fall in tandem with unit cost of production. In the event that diseconomies of scale are realized as hypothesized by Minnitt (2007) and in order to maintain profitability, cutoff grades would have to rise as production rates continue increasing. The slope of cut-off grades required to maximize cash returns at varying levels of production is seen to mirror the cost curve in Figure 18 and is consistent with the same effect in Figure 17.
This value surface in Figure 17 presents a succinct summary illustrating how the rationale of integrating the production rate as influence by the U-shaped cost curve and grade signature represented by a grade-tonnage curve influences the determination of maximum valuation for a mineral resource. This modelling represents an important tool in the process of engineering value maximization and provides a critical framework when proceeding with feasibility studies of any commodity endowment.
Discussion
Although the author is at ease following Studemund's guidance with regard to selecting a functional form on the basis of theoretical considerations and the arguments of Minnitt et al. to adopt a U-shaped cost curve, industry practioners will likely be convinced only when data-driven analysis can be presented to confirm Minnitt et al's hypothesis. While PwC's empirical evidence may cause some practitioners to at least pause and consider the relevance of the U-shaped cost curve, the more skeptical will likely be convinced only when sufficient data-sets are forthcoming to prove the hypothesis. The author has little doubt that this can be achieved by interrogating the databases of mining companies for the period 2003 to 2011, considering that production rates were prioritized and costs have spiralled out of control. It is argued that although macro-economic rationalizations may be relied upon to explain spiralling costs during the supercycle, to ignore micro-economic phenomenon will be to repeat the same outcomes in the next supercycle.
While miners await the next commodity boom, a useful application of this integrated methodology is that alternative mining methods can be quickly assessed on the overall value proposition. Considering that miners are moving into an environment where orebody discoveries are larger but at lower grades, understanding how to maximize value by balancing the trade-offs will distinguish the truly good management teams from the rest of the pack.
By way of example, understanding the effect of the slope of alternative grade-tonnage curves may dictate that an alternative mining method(s) with alternative cost profiles be considered to achieve maximum value. For example, Figure 19 illustrates two cumulative grade-tonnage curves. The impact of an increasing cut-off grade on available mineable tons is clearly illustrated; namely that the reduction in mineable tons on curve CTC1 is significantly less than that for curve CTC2.
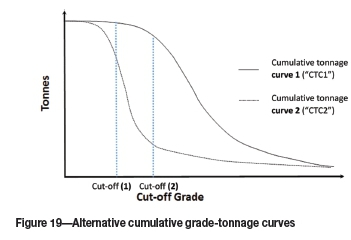
CTC1 would suggest that mining engineers have the flexibility to consider significantly more mining methodologies, while CTC2 limits alternative mining methods as a result of its sensitivity to an increasing cut-off grade. CTC1 can sustain high volume or lower volume or more selective mining methodologies, whereas it is argued that CTC2 would only support high-volume mining methods.
In addition to this consideration, it is also worthwhile noting that since new orebody discoveries typically bear lower grades, understanding how a mineral endowment's 'DNA' influences maximum economic utilization is a priority. Typically, lower-grade deposits require higher volume mining methods, and not considering the cumulative tonnage profile may lead to significant opportunity cost.
By considering this integrated approach, mining companies that find the right balance between optimizing current operations and preserving their flexibility to grasp future opportunities are better able to develop strategies and articulate more favourable value propositions to attract equity capital and return shareholder value on a sustainable basis through the commodity cycle. Practically, capital preservation is primarily achieved as investment on redundant capacity is saved, and profit margins are maximized regardless of the commodity cycle - thus enabling a mining business to generate surplus cash flows, giving them a significant competitive edge. Those mining businesses that prudently manage the cycle through optimal management of their mineral resource endowments will have the financial muscle to take advantage of cheap assets sales in the downturn and generate alpha returns during the up-cycle.
Conclusion
Part 1 of this paper explored the prevailing philosophy in the mining and investment industry; that increasing output will deliver continuing economies of scale and therefore chasing volume at any cost was deliberately prioritized over productivity considerations. This practice was supported by the work of Dr. Rudenno, who published 'power' curves to estimate capital and operating costs at varying rates of production. The underlying assumption of theses curves was that 'bigger is better' as larger operations yielded lower unit costs of production and therefore, by implication, higher profit margins. Empirical evidence from the world's top 40 mining companies (after PwC) suggests that this practice did not produce the anticipated bottom line returns. In fact, the data shows that during the period profitability trends were negative rather than positive. Schizophrenically, the same investor base that not too long ago was pushing for growth and rewarding those miners with the most attractive growth pipeline is now demanding greater discipline around capital allocation, cost control, and productivity. Treadgold (2015), writing for the Mining Journal, crows that institutional investors started to blow the whistle two years ago that an over-production crisis was brewing - just two years ago! Yet despite being scapegoated by institutional investors, miners continue to take their cue from the very same quarters that now decree that the panacea to the industry's ills is to incur massive impairments, retrench staff, curtail or defer long-lead capital investments, and instill greater cost discipline. PwC's sober insight, in contrast, is at risk of being drowned by the cacophony: 'This reaction of headcount reductions and expenditure curtailment might be effective in reducing controllable cash costs in the near term, but long-term sustainable gains depend on strong underlying improvements in the efficiency of operations and invested capital. Accordingly, productivity has become one of the most important topics as the industry aims to restore and sustain shareholder value.'
Using an integrated model it has been shown that ignoring the concept of the U-shaped costs curve leads to over- capitalization and higher cost operations at the top end of production, ultimately decimating shareholder value. Mining companies need to find the right balance between optimizing current operations while preserving their flexibility to grasp future opportunities. There is no longer any doubt that prioritizing production is a costly strategy, and the well-documented fallout has shown it to be a deadly endgame for many miners and investors alike. Minnitt et al's powerful argument in support of a production optimum should be a key consideration for any miner looking to revisit their business strategies and prevent a re-run of recent events.
Part 2 of this paper addressed Minnitt's concerns with respect to barriers to adoption by practitioners. Given modern desktop computing and the application of standard single-equation linear regression analysis (SLRA), this technique is now highly accessible. While this paper represents a first step to advance Minnitt et al's thinking, there is no doubt that with greater adoption and acceptance, this technique will evolve and develop and become an important part of a miner's toolkit. Much can still be learned about the application of the U-shaped cost curves in designing and operating mines - and even a portfolio of mines; but to achieve this, further empirical data needs to be acquired and analysed. Nevertheless, given the institutional backlash, this is arguably an ideal time to re-introduce Minnitt et al's work into the debate.
Minnitt et al's hypothesis is even more useful if integrated with mineral resource modelling. Part 3 of this paper addresses a significant potential weakness that arises if micro-economic modelling ignores mineral resource modelling. Focusing only on achieving economies of scale with respect to ore tons being mined and processed may fail to capture economies of scale related to a targeted commodity, e.g. copper, gold, platinum etc. A key complication in mining mineral resources is that the 'commodity' mined is not the 'commodity' sold. Figure 16 has highlighted the dangers of ignoring the modelling of both ore mined and the commodity being targeted for sale. Consequently, the author describes an integrated modelling technique that considers both a mineral resources gradetonnage curve and its micro-economic cost curves as advocated by Minnitt et al. The optimal rate of production, being the key determinant of the lowest unit cost of production, is shown to be a key determinant of the optimal cut-off grade of a mineral resource, as illustrated in Figure 18. The significance of this is that determining the optimal cut-off grade establishes the maximum cash flow that a mineral resource can yield. This modelling technique highlights that the cost of production is as important an influence on the cut-off grade determination as the price of the commodity.
In the words of Treadgold (2015), 'Undeterred by the evidence, the mining industry ploughed ahead with expansion projects in what has now become a self-destructive race to the bottom as big low-cost miners chase market share so they can claim the title of "last-man-standing"'. So the question is this: will management teams continue chasing rainbows, undeterred by the evidence, or will they look at their business with fresh eyes and challenge traditional ideas and develop strategies that will attract and reward shareholders with sound business philosophies that are sustainable in the long-term and through the cycles?
References
Ballington, I., Bondi, E., Hudson, J., Lane, G., and Symanowitz, J. 2004. A practical application of an economic optimization model in an underground mining environment. Orebody Modelling and Strategic Mine Planning, Perth, November 2004. Australasian Institute of Mining and Metallurgy, Melbourne. [ Links ]
Bhappu, R.R. and Guzman, J. 1995. Mineral investment decision making. Mineral Economic Management Meeting, Washington, DC. [ Links ]
Breedt, M.F. and van Heerden, D. 2015. Post pit optimization strategic alignment. Mining Business Optimisation Conference, 11-12 March 2015. Southern African Institute of Mining and Metallurgy, Johannesburg. [ Links ]
Ernst and Young. 2013. Expensive acquisitions? Cost overruns? Implications for impairment testing. Mining & Metals: Refining IFRS. pp. 1-7. [ Links ]
Goldsmith, T. 2013. Mine: A Confidence crisis. Review of Global Trends in the Mining Industry 2013. PwC. [ Links ]
Joseph, M.F.W. 1933. A discontinuous cost curve and the tendency to increasing returns. Economic Journal, vol. 43, no. 171. pp. 390-398. [ Links ]
Kohler, H. 1992. Economics. Heath Publishers, Canada. [ Links ]
Krige, D.G. Not dated. Capital Investment and Risk Analysis for a New Mining Project. University of the Witwatersrand, Johannesburg. [ Links ]
Lazenby, H. 2014. New Focus. http://www.miningweekly.com/article/mining-majors-prioritising-returns-over-production-volumes-as-profits-company-valuations-sag-2014-04-04-1 [ Links ]
Marshall, A. 1920. Principles of Economics. 9th edn. Macmillan, New York. [ Links ]
Minnitt, R.C.A. 2004. Cut-off grade determination for the maximum value of a small Wits-type gold mining operation. 31st International Symposium on Application of Computers and Operations Research in the Minerals Industries, Cape Town, South Africa, 14-16 May 2003. pp. 415-421. South African Institute of Mining and Metallurgy, Johannesburg. [ Links ]
Minnitt, R.C.A. 2007. Frontiers of usefulness: The economics of exhaustible resources. Journal of the South African Institute of Mining and Metallurgy, vol. 107, no. 8. pp. 539-555. [ Links ]
Mitchell, P. 2013. Switching direction. Margin protection and productivity improvements in mining and metals. http://www.ey.com/Publication/vwLUAssets/EY-Mining-and-Metals-Switching-direction/$FILE/EY-Mining-and-Metals-Switching-direction.pdf. [ Links ]
Napier, J.A.L. 1981. Investment criteria and choice of production rate in the planning of gold-mine production. Journal of the South African Institute of Mining and Metallurgy, vol. 81, no. 7. pp 221-228. [ Links ]
PwC. 2014. Mine 2014. Realigning expectations. Review of Global Trends in the Mining Industry 2014. [ Links ]
Runge, I. 2012, Economics of mine planning and equipment selection - Part 1. Pincock Perspectives, no. 113. [ Links ]
Samuelson, P.A. 1972. Jacob Viner, 1892-1970. Journal of Political Economy, vol. 80, no. 1. pp. 5-11. [ Links ]
Samuelson, P.A. 1976. The monopolistic competition revolution. Monopolistic Competition Theory: Studies in Impact, Essays in Honor of Edward H. Chamberlin. Kuenne, R.E. (ed.). Wiley, New York. [ Links ]
Semple, C. 2014. Digging deeper to all in cost disclosure. Mining's new frontier. PwC. [ Links ]
Silberberg, E. 1999. The Viner-Wong envelope theorem. Journal of Economic Education, vol. 30, no. 1. pp. 75-79. [ Links ]
Studemund, A.H. 1970, Using Econometrics, a Practical Guide. 2nd edn. Harper Collins, USA. [ Links ]
Tisato P, 1995. Exhaustible resource depletion: a modified graphical approach. Journal of Economic Education, vol. 26, no. 1. pp. 51-57. [ Links ]
Treadgold, T. 2015. Mining Journal, February. p. 11. [ Links ]
Van Heerden, D. 2015. Understanding the impact of different cut-off parameters. Newsletter, no. 9, January 2015. [ Links ]
Viner, J. 1931. Cost curves and supply curves. Zeitschriftfür Nationalökonomie, vol. 3. pp. 23-46. [ Links ]
Paper received Feb. 2015
Revised paper received Apr. 2015.
1 http://www.angloplatinum.com/investors/invest_sub/press_def.asp?/CetegoryID=5&Related=True
2 ZAR: South African rands

