


Services on Demand
Article
 English (pdf)
 Article in xml format
 Article references
Indicators

Related links
-
 Cited by Google
 -
 Similars in Google
Share

 Permalink
Journal of the Southern African Institute of Mining and Metallurgy
On-line version ISSN 2411-9717
Print version ISSN 2225-6253
J. S. Afr. Inst. Min. Metall. vol.115 n.10 Johannesburg Oct. 2015
http://dx.doi.org/10.17159/2411-9717/2015/v115n10a11
Glow discharge optical emission spectroscopy: A general overview with regard to nuclear materials
S.J. LötterI, II; W. PurcellI; and J.T. NelII
IDepartment of Chemistry, University of the Free State, South Africa
IIThe South African Nuclear Energy Corporation SOC Ltd
SYNOPSIS
Glow discharge optical emission spectroscopy (GD-OES) is an analytical technique used in the analysis of solid, conducting materials. Though primarily of interest as a depth profiling technique on samples with varying layers of both conducting and non-conducting materials, it is also capable of rapid bulk analysis of homogenous, solid samples. GD-OES combines the advantages of ICP-OES (wide detection range, speed, and lack of interferences) with the solid sampling of XRF techniques. This allows the analyst to not only quantify the elemental composition of a sample, but to evaluate it in terms of homogeneity with depth, a field in which auger electron spectroscopy (AES) and secondary ion mass spectrometry (SIMS) have traditionally been the primary techniques. Although GD-OES does not replace these useful techniques, it does offer various advantages over them, making it an excellent complementary analytical tool.
In GD-OES analysis, a low-pressure glow discharge plasma is generated with the sample material acting as a cathode, accelerating the cations in the plasma towards the sample surface. This bombardment causes the sample material to 'sputter', essentially knocking free atoms or molecules of analyte material, which are then drawn into the plasma where they are excited. The light emitted by this excitation is then diffracted to separate the wavelengths emitted by the specific elements and detected by a spectrophotometer. The intensity of the signal is directly proportional to the quantity of analyte element present in the sample, allowing simple calibration and quantitative determination of the elements.
Technological improvements made in the past twenty years or so have significantly increased the usefulness of GD-OES for surface analysis. Faster plasma stabilization and start-up allow for the quantification of surface layers as thin as 1 nm. Sputter rates have been accurately measured for many common materials, allowing them to be built into software libraries in the instrument's control software. This dramatically expands the usefulness of this software and the ease of performing analyses.
GD-OES analysis of nuclear materials allows for the rapid determination of the elemental composition without the requirement of initial dissolution. The thickness of any corrosion layers on nuclear materials can also be determined.
Keywords: glow discharge optical emission spectrometry, GD-OES, nuclear materials.
Introduction
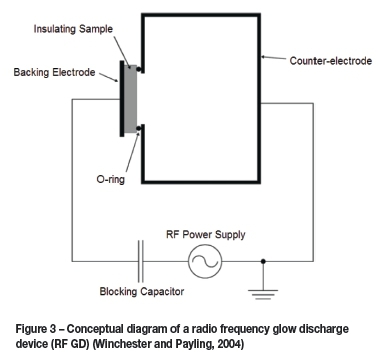
Glow discharge optical emission spectroscopy (GD-OES) combines the detection range, speed, and lack of interferences of an inductively coupled plasma optical emission spectroscopy (ICP-OES) instrument with solid sampling reminiscent of X-ray fluorescence (XRF) techniques. Its ability to perform depth profiles of materials that contain layers of varying composition and thickness allows not only for the quantification of a sample, but also the evaluation of its composition in terms of homogeneity. Unfortunately the method is not yet as well established as other techniques. In order to be at its most effective it requires conductive samples. GD-OES was developed by Grimm in 1967 (Payling, Jones, and Bengtson, 1997). It was initially used to analyse solid metallic samples (bulk analysis) where all surface effects were eliminated by a pre-burn. In the 1970s, Roger Berneron, among others, began investigating the phenomena that occurred during this pre-burn period and developed GD-OES as a surface analytical technique. In 1988 M. Chevrier and Robert Passetemps first successfully applied an RF potential to a conventional Grimm-type source (GD) to produce an RF device that was able to also analyse non-conductive samples.
Currently, GD-OES is still used mainly in the analysis of solid metallic samples (Azom.com, 2004). Its most useful application is as a depth profiling technique on samples with varying layers of both conducting and non-conducting materials (Shimizu et al., 2003), but it is also capable of rapid bulk analysis of homogenous samples (both conducting and non-conducting). A typical analysis takes only a few minutes, which is one of the main advantages of GD-OES, especially where quick results are required, for example at a smelter. In GD-OES analysis, when using a Grimm-type direct current (DC) lamp source, a potential difference of the order of 1 kV is applied between two electrodes in a cell containing a gas, usually argon, at low pressure (around 1 Torr) (Bogaerts and Gijbels, 1998). This causes the gas to ionize into positive and negative ions, forming the plasma. The electrons are accelerated towards the anode, sustaining the plasma and generating more positive ions. The positive ions are similarly accelerated towards the cathode, the sample material. The resulting bombardment of the sample material causes it to 'sputter', essentially knocking free atoms or molecules of analyte material. These atoms are then drawn into the plasma where they too are excited. A diagram of this process can be seen in Figure 1. A radio frequency (RF) lamp may also be used for analysing non-conducting samples (Winchester and Payling, 2004), see Figure 2. The sputtered analyte is then drawn into the high-energy plasma where it is excited into a higher electronic energy state. In order to return to their ground state the analyte ions emit a photoelectron of a wavelength characteristic of the element emitting it.

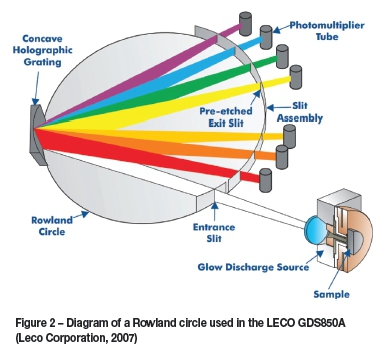
In GD-OES the characteristic light emitted by this excitation/de-excitation process is passed into a spectropho-tometer through an entrance slit, and is then diffracted by a concave holographic mirror grating that contains 3600 lines per millimetre. This is done in order to separate the emitted light into wavelengths that are specific for each element. The individual wavelength intensities can then be detected using either a charge-coupled device (CCD) or a photomultiplier tube (PMT). The intensity of the signal is directly proportional to the quantity of analyte element present in the plasma, allowing simple calibration and quantitative determination of elements. In practice this is often achieved using a Rowland circle (Figure 3) with PMTs positioned behind exit slits that are positioned at the wavelength corresponding to characteristic emission lines of various elements. This allows the instrument to read all of these lines simultaneously, greatly increasing sample throughput rate at the cost of the ability to generate a complete spectrum. As there is only a single PMT installed for most elements in this type of spectrometer, detection of interferences is more difficult than with scanning sequential instruments. A sequential instrument would, however, not be capable of the most useful aspect of the GD-OES, which is its ability to perform depth profiling. The signals that are captured by the PMTs are recorded by a computer at a typical rate of 10 000 to 30 000 measurements per second.
Technological improvements made in the past twenty years or so have significantly increased the usefulness of GD-OES for surface analysis (Azom.com, 2004). Faster plasma stabilization and start-up times allow for the quantification of surface layers as thin as 1 nm. Sputter rates have been accurately determined for many common materials, allowing them to be built into the software libraries of the instrument's control software. This significantly expands the usefulness of the software. Improvements in calibration systems allow for the changing of instrumental conditions without the need to completely recalibrate, saving time and effort.
In glow discharge mass spectrometry (GD-MS), a mass spectrometer is attached to the GD source rather than an optical detector. This allows for a much lower limit of detection at the cost of linear dynamic range. The instrument is otherwise essentially the same as a GD-OES instrument. A collision cell can be used at the interface between the glow discharge plasma and mass spectrometer in order to minimize interference from polyatomic species formed in the plasma.
As GD-MS still makes use of a glow discharge plasma sampling system it shares the GD-specific advantages and limitations of the GD-OES. Due to the cost of a mass spectrometer a GD-MS instrument is generally significantly more expensive than an OES instrument.
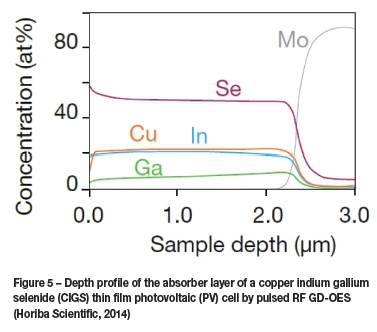
Modern instruments are equipped with sophisticated software packages that use libraries containing the sputter rates of known materials and advanced algorithms. These are used to calculate both the depth and mass composition of the layers, as seen in Figure 4 and Figure 5. Figure 4 shows the depth profile of a hard-disk platter with seven distinct layers clearly visible, while Figure 5 shows the composition of the surface of a photovoltaic cell.

Instrumentation
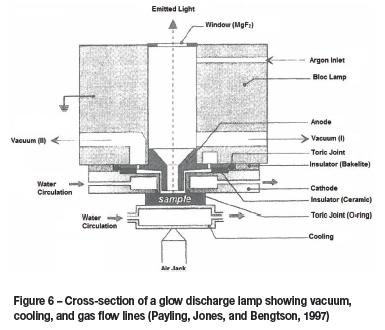
A GD-OES instrument is a fairly simple piece of equipment to operate, in comparison to other instruments capable of similar analyses. Once a sample is properly prepared, sample introduction consists of simply placing a sample over the O-ring at the lamp opening and allowing the vacuum to hold it in place. A simple cross-section of a standard Grimm-type GD lamp can be seen in Figure 6.
When positioning a sample it is preferable to ensure that no previous GD craters overlap with the surface to be analysed. Care must be taken that samples are non-porous and smooth. If they are not, the vacuum will not be strong enough to form the GD plasma, the instrument will detect this, and the sample will be ejected before analysis can begin. If the seal is tight the sample will then be held in place by the reamer, a pneumatically controlled 'air jack' with an integrated drill bit. This reamer serves multiple functions, including holding the sample in place, cleaning the anode between analyses, and serving as a conductor to allow the sample to act as cathode (when using the DC lamp). When moving into position the reamer impacts the sample with some force, which can break brittle samples.
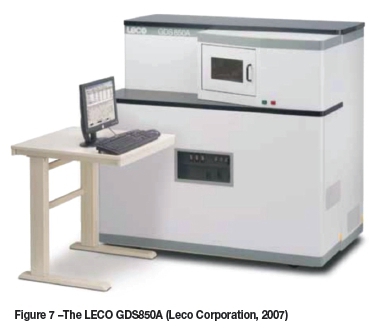
The LECO GDS850A (Figure 7) supports both a DC and an RF lamp. The RF lamp is intended for use with nonconducting materials and has a lower effective applied power. It was found that using this lamp with the copper anode allowed only for the analysis of very thin, regular, nonconducting layers on a conducting substrate. The DC lamp is able to generate a greater applied power, which can increase sensitivity but is also more prone to short-circuits.
In order to ensure that the Rowland circle is in alignment, the instrument is equipped with two PMTs mounted at diffraction angles for detecting the characteristic wavelengths of iron. These two iron 'lines' are used when profiling the instrument. This is done by analysing a sample containing iron. Detecting these two lines allows the instrument to confirm the position of the spectrometer's entry slits. As the instrument stores calibration data it is necessary to drift-correct a method's calibration before quantitative analysis. This is performed by analysing standard samples, preselected in the method, and adjusting the calibration according to the intensities detected. This drift must be done whenever a different method is used but the warm-up and profiling need to be performed only once per working period.
The use of GD-OES in the nuclear industry
As previously mentioned, the most striking capability of GD-OES is its ability to accurately and rapidly determine a depth profile of multiple layers of varying composition on a substrate. The raw data from a GD-OES analysis is given in time versus intensity of emission, as can be seen in Figure 8, where layers of U02F24.5H20, and UF4 are seen bonded to a nickel substrate. This data, along with known sputter rates for each material, allows for the characterization of the various uranium species present on the surface of the material.
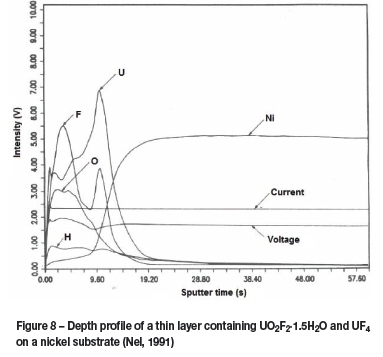
In the 1980s the erstwhile Atomic Energy Corporation of South Africa (AEC) used GD-OES intensively to study surface and interface phenomena like corrosion, surface cleanness, passivation of surfaces, decontamination efficiency, plating, etc. (Nel, 1991). Valuable information could be obtained by analysing surfaces of materials that were exposed to UF6, as indicated in Figure 8. The types of uranium compounds that were found on a surface were used by nuclear engineers and scientists to choose the best materials for construction or to diagnose chemical and material problems that occurred during plant operation.
GD-OES was also routinely used for the bulk analysis of materials that are used in nuclear and uranium enrichment plants. Examples of these are high nickel-containing alloys, normal and special stainless steels (e.g. 316, 304, and 17-PH), Monel, Inconel, aluminium alloys, copper, and brass, etc. The impurity specifications for nuclear materials are usually extremely strict and the low limit of detection of GD-OES makes this technique extremely powerful in the nuclear industry.
In the current programme of the Advanced Metals Initiative (AMI), and especially the Nuclear Materials Development Network (NMDN), one of the main focuses is the development of nuclear-grade zirconium metal and the study of corrosion of zirconium alloys.
GD-MS has been used in the analysis of spent uranium oxide fuel (Robinson and Hall, 1987) prior to recycling. It is necessary to confirm that the reprocessing plant is working efficiently and that fission products, activation products, and corrosion products are successfully removed. GD-MS offers a faster and more quantitative approach than traditional methods, such as spark source mass spectrometry (SSMS), without the need for time-consuming interpretation of results by highly skilled operators.
Experimental
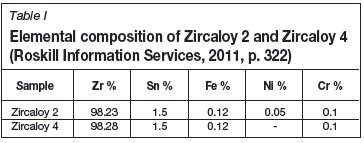
Samples of Zircaloy 2 and Zircaloy 4, obtained from ATI Wah Chang, were exposed to air at 600°C for periods of either 16 or 32 hours. The samples were allowed to cool rapidly in air and then analysed by GD-OES to determine the thickness of the oxide layer formed. A sample of zirconium metal, obtained from Alfa Aesar, was analysed as well in order to provide a baseline from which to compare the degree of the growth of the oxide layer. The elemental composition of the Zircaloy materials can be seen in Table I.
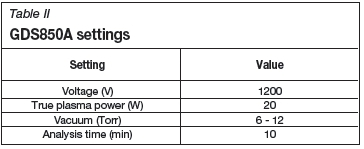
The GD-OES instrument was calibrated using NIST standards 1212a, 1234, 1235, 1236, 1237, 1238, and 1239, obtained from Pelindaba Analytical Laboratories. The photomultiplier tube power settings were determined using the automated software tool built into the control software, with applied voltages ranging between 400 and 900 V. Instrument settings can be seen in Table II. As the RF lamp was used the Teflon isolation puck was utilized in all determinations and was kept at a constant temperature of 12°C by an external chiller. This puck is similar to the cooling puck used with the DC lamp but, in addition to cooling, also electrically isolates the sample from the reamer.
Results and discussion
Oxygen readings in all cases were higher than expected, but this was likely a calibration issue. As the oxygen calibration values were for dissolved oxygen in the metal standards rather than the stoichiometric levels found in the oxide layers, the intensities detected were several orders of magnitude higher than the calibration range. Oxygen values must thus be described as semi-quantitative. As the objective of the study was to determine the thickness of the layers rather than their elemental composition, this was not considered too great of a difficulty.
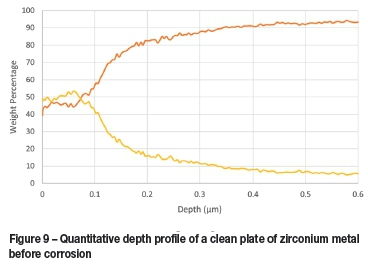
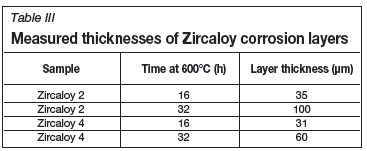
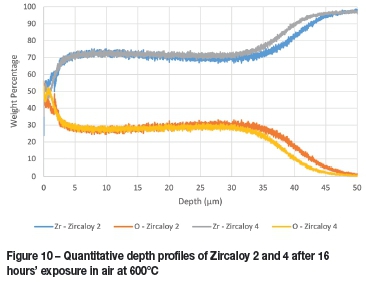
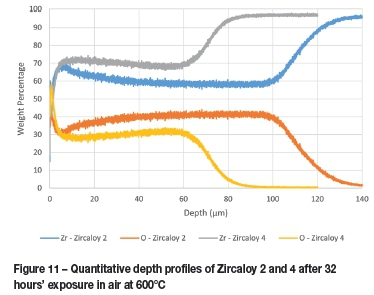
The oxide layer formed naturally at room temperature by zirconium metal was found to be approximately 100 nm thick with approximately another 200 nm required for the transition to mostly pure zirconium, as seen in Figure 9. The thickness of the corrosion layers varied between 31 and 100 μm, depending on the duration of and temperature at which the corrosion test was performed (Table III). The least corrosion was exhibited by Zircaloy 4, with layer thickness marginally thinner than those seen with Zircaloy 2 at 16 hours but significantly thinner after both had been corroded for 32 hours. These results are clearly visible in Figure 10 and Figure 11. The increase in oxide layer thickness of 285.7 % for Zircaloy 2 can clearly be seen in Figure 12, while the Zircaloy 4 showed an increase of only 193.5 % (Figure 13). As expected, Zircaloy 4 exhibited a significantly better resistance to corrosion than Zircaloy 2.


These results clearly show the obvious utility of GD-OES for the rapid determination of oxide layers on nuclear fuel cladding. It can be highly useful as a method to quantify the corrosion of known and experimental materials for nuclear application. Its usefulness extends to the determination of layer thickness and composition for known and potential coatings on nuclear and non-nuclear materials.
References
Azom.com. The A to Z of Materials. 2004. http://www.azom.com/article.aspx?ArticleID=2449 [Accessed 9 July 2013]. [ Links ]
Betti, M. and de las Heras, L.A. 2004. Glow discharge spectrometry for the characterization of nuclear and radioactively contaminated environmental samples. Spectrochimica Acta Part B, vol. 59. pp. 1359-1376. [ Links ]
Bogaerts, A. and Gijbels, R. 1998. Fundamental aspects and applications of glow discharge spectrometric techniques. Spectrochimica Acta Part B, vol. 53. pp. 1-42. [ Links ]
Horiba Scientific. 2014. Ultra fast elemental depth profiling. http://www.horiba.com/fileadmin/uploads/Scientific/Documents/Emission/GDPROFILER_Series.pdf [Accessed 18 April 2015]. [ Links ]
Leco Corporation. 2007. GDS850A Glow Discharge Spectrometer. http://www.leco.com/component/edocman/?task=document.viewdoc&id=49&Itemid=0 [Accessed 4 September 2013]. [ Links ]
Nel, J.T. 1991. Oppervlakanalises van uranielfluoriedlagies met 'n gloeiontlad-ingslamp. DPhil thesis, University of Pretoria. [ Links ]
Payling, R., Jones, D. and Bengtson, A. 1997. Glow Discharge Optical Emission Spectrometry. Wiley, Hoboken, NJ. [ Links ]
Robinson, K. and Hall, E.F.H. 1987. Glow discharge mass spectrometry for nuclear materials. Journal of Metals, vol. 39. pp. 14-16. [ Links ]
Roskill Information Services. 2011. Zirconium: Global Industry Markets and Outlook. 13th edn. London. [ Links ]
Shimizu, K., Habazaki, H., Skeldon, P. and Thompson, G.E. 2003. Impact of RF- GD-oES in practical surface analysis. Spectrochimica Acta Part B, vol. 58. pp. 1573-1583. [ Links ]
Winchester, R.M. and Payling, R. 2004. Radio-frequency glow discharge spectrometry: a critical review. Spectrochimica Acta Part B, vol. 59. pp. 607-666. [ Links ]
Raper received July 2015
Revised paper received Aug. 2015.

