


Servicios Personalizados
Articulo
 Inglés (pdf)
 Articulo en XML
 Referencias del artículo
Indicadores

Links relacionados
-
 Citado por Google
 -
 Similares en Google
Compartir

 Permalink
Journal of the Southern African Institute of Mining and Metallurgy
versión On-line ISSN 2411-9717
versión impresa ISSN 2225-6253
J. S. Afr. Inst. Min. Metall. vol.115 no.10 Johannesburg oct. 2015
http://dx.doi.org/10.17159/2411-9717/2015/v115n10a8
Synthesis and deposition of silicon carbide nanopowders in a microwave-induced plasma operating at low to atmospheric pressures
J.H. van LaarI, II; I.J. van der WaltI; H. BissettI; G.J. PutsII; P.L. CrouseII
IApplied Chemistry Division, South African Nuclear Energy Corporation (NECSA) SOCLtd., Pelindaba, South Africa
IIFluoro-Materials Group, University of Pretoria, South Africa
SYNOPSIS
Silicon carbide nanopowders were produced using a microwave-induced plasma process operating at 15 kPa absolute and at atmospheric pressure. Methyltrichlorosilane (MTS) served as precursor, due to its advantageous stoichiometric silicon-to-carbon ratio of unity, allowing it to act as both carbon and silicon source. Argon served as carrier gas, and an additional hydrogen feed helped ensure a fully reducing reaction environment. The parameters under investigation were the H2:MTS molar ratio and the total enthalpy. The particle size distribution ranged from 20 nm upwards, as determined by SEM and TEM micrographs. It was found that an increase in enthalpy and a higher H2:MTS ratio resulted in smaller SiC particle sizes. The adhesion of particles was a common occurrence during the process, resulting in larger agglomerate sizes. SiC layers were deposited at 15 kPa with thicknesses ranging from 5.8 to 15 μm.
Keywords: silicon carbide, microwave plasma, methyltrichlorosilane, nanoparticles.
Introduction
It is well known that methyltrichlorosilane (CH3SiCl3 or MTS) decomposes to form silicon carbide (SiC) and hydrogen chloride (HCl) as shown in Equation [1]. The reaction kinetics and mechanisms for this reaction are thoroughly reported in the literature (Sone et al., 2000; Papasouliotis and Sotirchos, 1999; Kaneko et al., 2002; Wang et al., 2011).
Owing to its physical and mechanical properties, SiC has found application in several areas of high-power, high-frequency, and high-temperature technology (Harris, 1995; Saddow and Agarwal, 2004). Amongst its seemingly limitless applications, SiC is gaining increased attention as a nuclear ceramic due to its excellent mechanical properties and dimensional stability under irradiation (Katoh et al., 2012). SiC composites have also been proposed to act as fuel cladding in light water reactors as a direct replacement for zirconium alloy cladding (Katoh et al., 2012). Conventional ceramics exhibit certain drawbacks such as low ductility and high brittleness; however, the fact that nanopowders can overcome these shortcomings has encouraged the use of SiC in various fields. The application of SiC nanopowders in the nuclear industry, for example, allows for fast recovery of irradiation-induced defects (Vaßen and Stöver, 2001).
Various synthesis methods for SiC nanoparticles have been reported in the literature. These include carbothermic reduction (Dhage et al., 2009), pulsed laser deposition (Kamlag et al., 2001), sol-gel processes (Ahmed and El-Sheikh, 2009), microwave heating (Satapathy et al., 2005; Moshtaghioun et al., 2012) as well as numerous plasma techniques ranging from inductive radio-frequency (RF) (Karoly et al., 2011; Sachdev and Scheid, 2001) to microwave plasma-assisted chemical vapour deposition (Tang et al., 2008; Honda et al., 2003; Vennekamp et al., 2011). Previous work by the authors (Van Laar et al., 2015) reported the empirical study of the synthesis of SiC powders using a microwave-induced plasma at atmospheric pressure only.
In this work a microwave plasma system similar to that reported in the earlier paper (Van Laar et al., 2015) was used. The study is expanded here to include initial results of SiC deposition at low pressure (15 kPa) onto a quartz substrate. MTS was chosen as precursor due to its advantageous stoichiometric silicon-to-carbon ratio of unity, allowing it to act as both a carbon and a silicon source. A combination of its liquid state, high vapour pressure at standard conditions, and high volatility also allows for easier feeding of the MTS into the system at both low and high pressures. Hydrogen was fed into the reactor to serve as a reductant for driving the conversion reaction. Argon served as the carrier gas. Changes in total enthalpy and the H2:MTS molar ratio were studied at atmospheric pressure.
Experimental
Apparatus
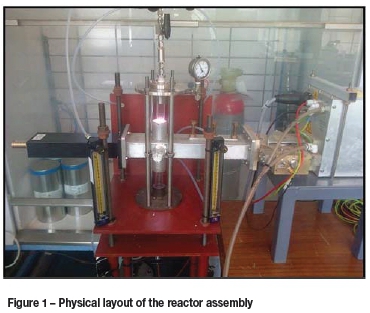
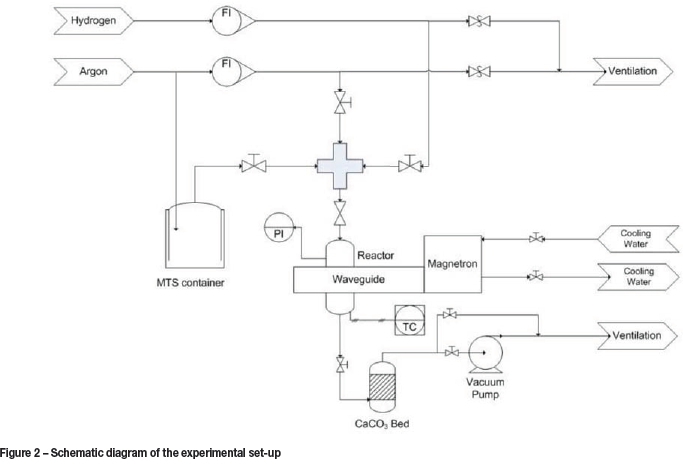
The experimental set-up consisted of a 1.5 kW power supply with a MOS-FET amplifier, a microwave generator operating at 2.45 GHz, a water-cooled magnetron head, and rectangular waveguide with sliding short and stub tuners. The quartz tube, with internal diameter of 2 cm and a length of 30 cm, was positioned through the middle and perpendicular to the waveguide and served as the reaction zone. Support flanges at the top and bottom of the tube also served as gas inlets. Argon and hydrogen flow rates were controlled using calibrated Aalborg rotameters. This set-up is similar to the one used previously (Van Laar et al., 2015). An illustration of the physical layout of the reactor assembly is shown in Figure 1, and a schematic representation of the flow path is shown in Figure 2.
At atmospheric pressures, argon was bubbled through the MTS in order to help vapourize and carry the MTS through the system. The MTS-rich argon stream was then mixed with hydrogen and argon streams in predetermined ratios before entering the reactor. At low pressures, the MTS was vapourized under vacuum, and the flow rate controlled using a valve placed before the entrance to the reactor. Calibration curves were reported in previous work (Van Laar et al., 2015).
The exiting gas was passed through a CaCO3 scrubber to remove HCl and any unreacted MTS before entering the extraction system. A T-connection and valve assembly immediately following the scrubber allowed for shifting between vacuum and atmospheric operating pressures.
Characterization of the particles was performed using the available equipment at the University of Pretoria. Particle size distribution was determined with a ZEN 3600 Malvern Zetasizer Nano System. Scanning electron microscopy (SEM) was performed on the particles using a high-resolution (6 À) JEOL 6000 system, and transmission electron microscopy (TEM) was performed using the JEOL JEM2100F TEM (JEOL Japan). Powder X-ray diffraction was conducted with a PANalyticaLX´pert Pro diffractometer using Co Κα radiation. The peaks were assigned using the databases supplied by the instrument manufacturer.
Method
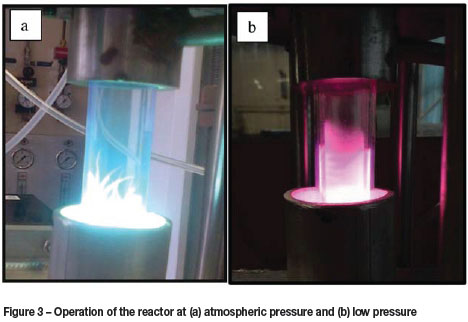
At the start of each experimental run the argon plasma was initiated under vacuum at approximately 15 kPa (Figure 3b), using an Alcatel 2010I duel-stage rotary vane pump. The deposition experiments were performed at this pressure. Atmospheric pressure was reached by gradually increasing the operating pressure, at which point filamentation of the plasma structure occurred (Cardoso et al., 2009) as shown in Figure 3a.
Hydrogen and MTS were then fed into the system. Depending on the H2:MTS ratio, stable plasmas were possible at applied powers between 200 and 1500 W. High hydrogen concentrations tended to extinguish the plasma, presumably due to increased energy demand for dissociation of the H2 bonds. During experiments at atmospheric pressure, a black powder deposited on the inner walls of the quartz tubes. These tubes were removed after each experimental run and flushed using distilled water. The water was collected and evaporated in a drying oven at 80°C, after which the black powders were collected. Quartz tubes with smaller diameters (15 mm) were used as substrates for the deposition experiments. These smaller tubes were placed inside the larger tubes, and held in place using zirconium wool.
Results and discussion
Synthesis of SiC at atmospheric pressure
The results of the synthesis experiments are reported elsewhere (Van Laar et al., 2015). The enthalpy values are those of the system enthalpy, HT, which combines all the chemical species (argon, hydrogen, and MTS). These enthalpy values were determined by Equation [2]:
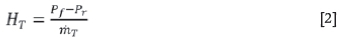
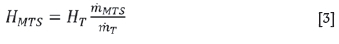
where Pf is the forwarded power, Pris the reflected power, and m Tis the total mass flow rate. The enthalpy of the MTS, Hmts, was calculated from Equation [3]:
The average particle sizes, as determined from SEM and Zetasizer results, are also listed elsewhere (Van Laar et al., 2015). Particle agglomerates were a common occurrence. Based on the results, the best-fitted model included quadratic and 2-factor interaction terms. Analysis of variance (ANOVA) results for the agglomerate sizes indicated that enthalpy had the greatest effect on the agglomerate sizes, whereas the H2:MTS ratio was found to be least significant (Van Laar et al., 2015).
Zetasizer and SEM results were analysed using response surface analysis (RSA). The resulting surface contour plots are shown in Figure 4 and Figure 5 respectively. Figure 4 suggests that particle size decreases with increasing enthalpy and H2:MTS ratio. Considering the effect of the two studied parameters separately, higher enthalpy values presumably allow de-agglomeration to occur more readily due to more energetic particle collisions. This results in smaller particle sizes. Higher H2:MTS ratios result in a more reducing environment, leading to smaller particle sizes.

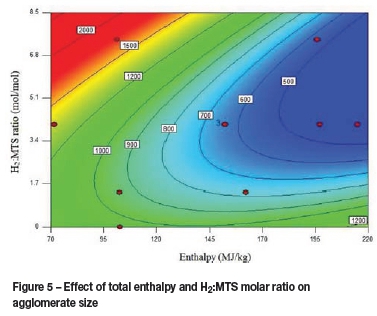
When considering the effect of both parameters in conjunction, two contrasting trends are seen. At high enthalpy values (195-220 MJ/kg), particle sizes seem to increase with increasing H2:MTS ratios. This trend could possibly be attributed to the increasing energy demand for hydrogen dissociation with increasing H2:MTS ratio. At low enthalpy values (70 -120 MJ/kg), particle size decreases with increasing H2:MTS ratio. This is in contrast to trends seen at high enthalpy values. It is speculated that this trend at low enthalpy values occurs because the energy supply is not adequate to allow for hydrogen dissociation, increasing the reducing environment and allowing more available energy for de-agglomeration.
The particle size distributions determined by the Zetasizer show that lower enthalpies produce larger agglomerates, but that the agglomeration process is much more sensitive to H2:MTS ratios, with higher ratios negatively influencing the agglomerate size.
Figure 6 and Figure 7 present SEM micrographs showing agglomerate particle sizes down to approximately 50 nm.
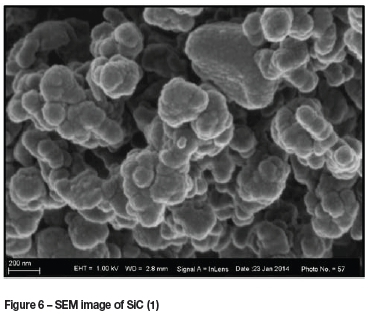
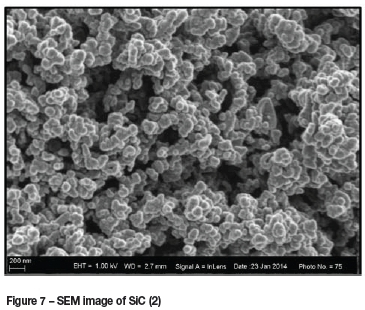
Nanoparticles tend to form strongly bound agglomerates. Ultrasound sonification is often used to de-agglomerate nanoparticles; however, there is insufficient knowledge on the de-agglomeration of nanoparticulate systems (Sauter et al., 2008), making it extremely difficult to obtain a reliable particle size distribution. From the images in Figure 6 and Figure 7, it can be seen that agglomerates exist in a wide variety of sizes. The smallest particle sizes to be confidently identified from SEM images were approximately 50 nm.
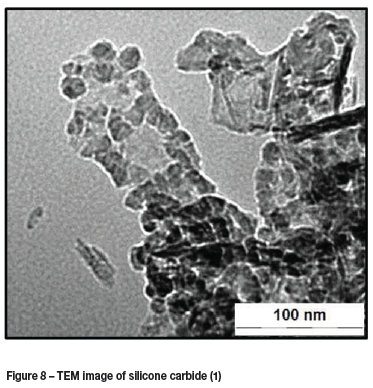
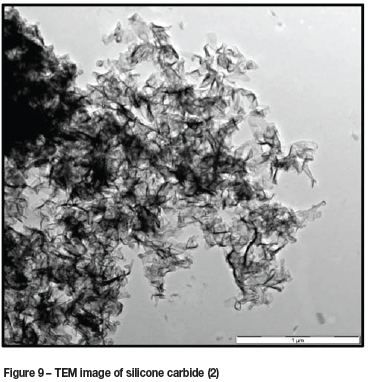
The TEM micrographs are presented in Figure 8 and Figure 9. Figure 8 shows particle sizes down to approximately 20 nm, and Figure 9 shows larger structures, presumably those of the agglomerates.
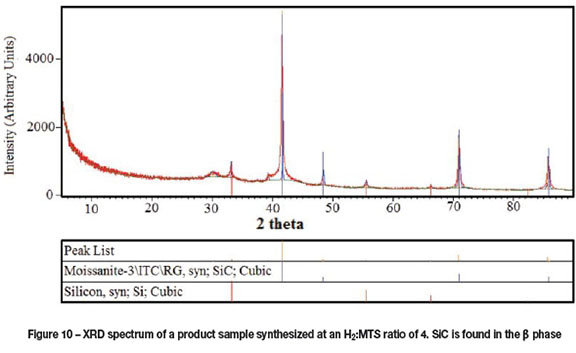
X-ray diffraction results show diffraction peaks at positions indicative of beta (β) SiC (also referred to as cubic) shown in Figure 10. Also present are peaks indicative of silicon, although in much lower amounts than SiC. This could imply the presence of silicon in the SEM and TEM images.
Other elements present within the plasma were verified using an optical emission spectrometer, reported previously (Van Laar et al., 2015). The majority of peaks were in good agreement with experimental values of elemental silicon, carbon, and argon (Kramida et al., 2014), suggestive of MTS decomposition in the plasma. The presence of elemental silicon in the gas phase as well as silicon in the product material suggests that the addition of hydrogen to the plasma drives the conversion reactions too far into the reductive regime.
The equilibrium thermodynamics and formation mechanisms of Equation [1] have been reported in the literature (Deng et al., 2009). The thermodynamics software package TERRA (Trusov, 2006) was used to confirm the optimum conditions for the formation of β-SiC. The results predict that optimum yield for β-SiC formation is achieved at temperatures of around 1400 K. Microwave plasmas are known to achieve temperatures in the region of 1000-10 000 K (Tendero et al., 2006). The temperatures of the experiments reported in this paper were measured using a pyrometer, giving an indication of the SiC temperature inside the reactor. SiC is chemically inert, with excellent microwave absorption and heat-conducting properties (Isfort et al., 2011). This enabled a rough estimation of the temperatures inside the reactor, which were measured to range from 1100 to 1400 K.
Deposition of SiC at 15 kPa
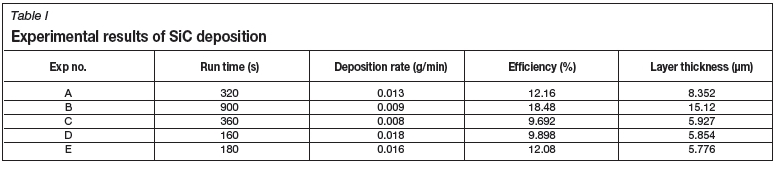
The experimental results of the initial deposition experiments are shown in Table I. All five runs were performed at the same conditions, namely P = 500 W, mMTs= 0.11 g/min, and QAr= 100 sccm. The run times varied randomly, as the plasma extinguished at unpredictable times. The efficiency is an indication of the percentage of MTS mass converted and deposited onto the quartz tubes. The layer thickness was calculated using deposition rate, run time, and assumed SiC density of 3.21 g/cm3 (Harris, 1995).
SEM images of deposited SiC layers are shown in Figure 11 and Figure 12. These images were taken from experiment number B, and show what appear to be layered structures.
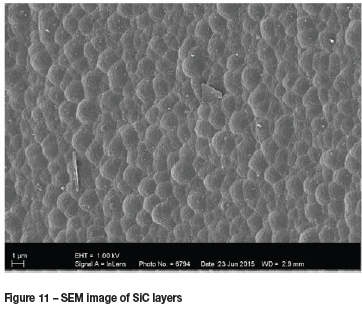
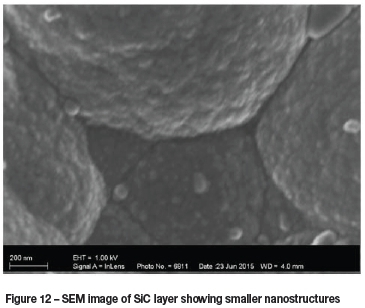
Figure 12 shows agglomerates and smaller structures down to approximately 50 nm, supporting the presence of nanoparticles.
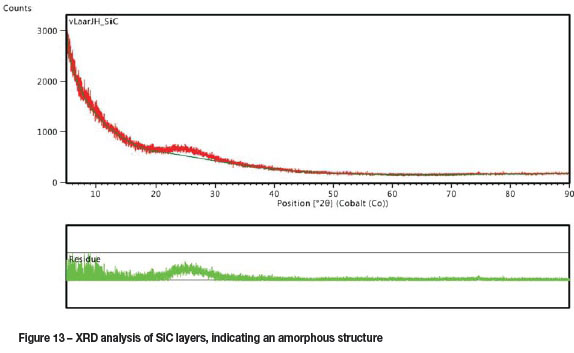
Figure 13 shows the XRD analysis of the SiC layers. No SiC peaks could be detected, indicating the presence of amorphous SiC. The absence of peaks could also be attributed to the small layer thickness and curvature of the quartz substrates. The small peak broadening at 25° is believed to be that of the amorphous quartz substrate.
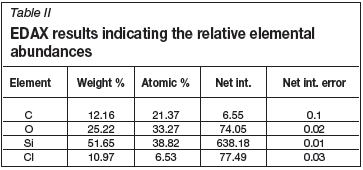
Typical EDAX results are shown in Table II, indicating the relative amounts of carbon, oxygen, silicon, and chlorine found in the SiC layers. The presence of oxygen and chlorine is indicative of SiO2 and HCl.
Conclusions and recommendations
A microwave-induced plasma operating at atmospheric pressure was used to decompose methyltrichlorosilane to form SiC nanoparticle agglomerates with sizes down to 20 nm as determined from SEM and TEM micrographs.
Agglomerates were a common occurrence, resulting in larger particle size distributions when measured by the Zetasizer. The presence of β-SiC and silicon was confirmed using X-ray diffraction studies as well as optical spectroscopy. The first part of the investigation focused on the effect on particle size by varying the H2:MTS molar ratio and the total enthalpy. SEM, TEM, and Zetasizer results showed that higher enthalpy values and higher H2:MTS ratios produced smaller particle sizes. Furthermore, RSA results indicated that at high enthalpy values (195-220 MJ/kg), particle size increases with increasing H2:MTS ratio. This trend could possibly be attributed to the increasing energy demand for hydrogen dissociation with increasing hydrogen amounts.
The second part of the investigation included initial experiments on SiC layer deposition. Operating and synthesis conditions remained similar to those in the first part of the study, except the process was run at low pressure (15 kPa). Initial results indicate the successful deposition of SiC layers with thicknesses ranging between 5.8 and 15 μm. XRD results indicate amorphous crystalline structures, although further analysis is needed.
The use of microwave-induced plasma shows promise for the deposition of SiC layers. Further experimental work is needed, however, in order to determine the quality and structure of these deposited layers. Pending these results, it is recommended that the use of microwave plasma systems be considered for the encapsulation of nuclear waste.
Acknowledgements
The authors acknowledge the South African National Research Foundation for financial support, and the South African Nuclear Energy Corporation for use of their equipment.
References
Ahmed, Y.M.Z. and El-Sheikh, S.M. 2009. Influence of the pH on the morphology of sol-gel-derived nanostructured SiC. Journal of the American Ceramic Society, vol. 92. pp. 2724-2730. [ Links ]
Cardoso, R.P., Belmonte, T., Noël, C., Kosior, F., and Henrion, G. 2009. Filamentation in argon microwave plasma at atmospheric pressure. Journal of Applied Physics, vol. 105. pp. 093306-093306-8. [ Links ]
Deng, J., Su, Κ., Wang, X., Zeng, Q., Cheng, L., Xu, Y., and Zhang, L. 2009. Thermodynamics of the gas-phase reactions in chemical vapor deposition of silicon carbide with methyltrichlorosilane precursor. Theoretical Chemistry Accounts, vol. 122. pp. 1-22. [ Links ]
Dhage, S., Lee, H.-C., Hassan, M.S., Akhtar, M.S., Kim, C.-Y., Sohn, J.M., Kim, K.-J., Shin, H.-S., and Yang, O.B. 2009. Formation of SiC nanowhiskers by carbothermic reduction of silica with activated carbon. Materials Letters, vol. 63. pp. 174-176. [ Links ]
Harris, G. 1995. Properties of Silicon Carbide, INSPEC, London. [ Links ]
Honda, S.-I., Baek, Y.-G., Ikuno, T., Kohara, H., Katayama, M., Oura, Κ., and Hirao, T. 2003. SiC nanofibers grown by high power microwave plasma chemical vapor deposition. Applied Surface Science, vol. 212-213. pp. 378-382. [ Links ]
Isfort, P., Penzkofer, T., Pfaff, E., Bruners, P., Gunther, R.W., Schmitz-Rode, T., and Mahnken, A.H. 2011. Silicon carbide as a heat-enhancing agent in microwave ablation: in vitro experiments. Cardiovasculat Intervent Radiology, vol. 34. pp. 833-8. [ Links ]
Kamlag, Y., Goossens, A., Colbeck, I., and Schoonman, J. 2001. Laser CVD of cubic SiC nanocrystals. Applied Surface Science, vol. 184. pp. 118-122. [ Links ]
Kaneko, T., Miyakawa, N., Sone, H., and Yamazaki, H. 2002. Growth kinetics of hydrogenated amorphous silicon carbide films by RF plasma-enhanced CVD using two kinds of source materials. Thin Solid Films, vol. 409. pp. 74-77. [ Links ]
KAroly, Z., Mohai, I., Klébert, S., Keszler, A., Sajó, I.E., and Szépvölgyi, J. 2011. Synthesis of SiC powder by RF plasma technique. Powder Technology, vol. 214. pp. 300-305. [ Links ]
Katoh, Y., Snead, L., Szlufarska, I., and Weber, W. 2012. Radiation effects in SiC for nuclear structural applications. Current Opinion in Solid State and Materials Science, vol. 16. pp. 143-152. [ Links ]
Kramida, A., Ralchenko, Y., Reader, J., and Nist-ASD-Team. 2014. NIST Atomic Spectra Database (version 5.2). National Institute of Standards and Technology, Gaithersburg, MD. http://physics.nist.gov/asd [Accessed 23 October 2014]. [ Links ]
Moshtaghioun, B.M., Poyato, R., Cumbrera, F.L., De Bernardi-Martin, S., Monshi, A., Abbasi, M.H., Karimzadeh, F., and Dominguez-Rodriguez, A. 2012. Rapid carbothermic synthesis of silicon carbide nano powders by using microwave heating. Journal of the European Ceramic Society, vol. 32. pp. 1787-1794. [ Links ]
Papasouliotis, G.D. and Sotirchos, S.V. 1999. Experimental study of atmospheric pressure chemical vapor deposition of silicon carbide from methyltrichlorosilane. Journal of Materials Research, vol. 14. pp. 3397-3409. [ Links ]
Sachdev, H. and Scheid, P. 2001. Formation of silicon carbide and silicon carbonitride by RF-plasma CVD. Diamond and Related Materials, vol. 10. pp. 1160-1164. [ Links ]
Saddow, S. and Agarwal, A. 2004. Advances in Silicon Carbide Processing and Applications. Artech House, London. [ Links ]
Satapathy, L.N., Ramesh, P.D., Agrawal, D., and Roy, R. 2005. Microwave synthesis of phase-pure, fine silicon carbide powder. Materials Research Bulletin, vol. 40. pp. 1871-1882. [ Links ]
Sauter, C., Emin, M.A., Schuchmann, H.P., and Tavman, S. 2008. Influence of hydrostatic pressure and sound amplitude on the ultrasound induced dispersion and de-agglomeration of nanoparticles. Ultrasonics Sonochemistry, vol. 15. pp. 517-523. [ Links ]
Sone, H., Kaneko, T., and Miyakawa, N. 2000. In situ measurements and growth kinetics of silicon carbide chemical vapor deposition from methyl- trichlorosilane. Journal of Crystal Growth, vol. 219. pp. 245-252. [ Links ]
Tang, C.-J., Fu, L.-S., Fernandes, A.J.S., Soares, M.J., Cabral, G., Neves, A.J., and Gracio, J. 2008. Simultaneous formation of silicon carbide and diamond on Si substrates by microwave plasma assisted chemical vapor deposition. New Carbon Materials, vol. 23. pp. 250-258. [ Links ]
Tendero, C., Tixier, C., Tristant, P., Desmaison, J., and Leprince, P. 2006. Atmospheric pressure plasmas: A review. Spectrochimica Acta Part B: Atomic Spectroscopy, vol. 61. pp. 2-30. [ Links ]
TRuSoV, B. 2006. Terra - Phase and Chemical Equilibrium of Multicomponent Systems. Bauman Moscow State Technical university, Moscow. [ Links ]
Van Laar, J.H., Slabber, J.F.M., Meyer, J.P., Van Der Walt, I.J., Puts, G.J., and Crouse, P.L. 2015. Microwave-plasma synthesis of nano-sized silicon carbide at atmospheric pressure. Ceramics International, vol. 41. pp. 4326-4333. [ Links ]
VAßEN, R. and Stöver, D. 2001. Processing and properties of nanophase non- oxide ceramics. Materials Science and Engineering: A, vol. 301. pp. 59-68. [ Links ]
Vennekamp, M., Bauer, I., Groh, M., Sperling, E., ueberlein, S., Myndyk, M., Mäder, G., and Kaskel, S. 2011. Formation of SiC nanoparticles in an atmospheric microwave plasma. Beilstein Journal of Nanotechnology, vol. 2. pp. 665-673. [ Links ]
Wang, X., Su, K., Deng, J., Liu, Y., Wang, Y., Zeng, Q., Cheng, L., and Zhang, L. 2011. Initial decomposition of methyltrichlorosilane in the chemical vapor deposition of silicon-carbide. Computational and Theoretical Chemistry, 9 vol. 67. pp. 265-272. [ Links ]
Paper received Aug. 2015
Revised paper received Aug. 2015.

