


Services on Demand
Article
 English (pdf)
 Article in xml format
 Article references
Indicators

Related links
-
 Cited by Google
 -
 Similars in Google
Share

 Permalink
Journal of the Southern African Institute of Mining and Metallurgy
On-line version ISSN 2411-9717
Print version ISSN 2225-6253
J. S. Afr. Inst. Min. Metall. vol.115 n.8 Johannesburg Aug. 2015
http://dx.doi.org/10.17159/2411-9717/2015/V115N8A17
Parametric estimation of capital costs for establishing a coal mine: South Africa case study
M. MohutsiwaI; C. MusingwiniII
IStandard Bank of South Africa, Johannesburg, South Africa
IISchool of Mining Engineering, University of Witwatersrand, Johannesburg, South Africa
SYNOPSIS
Capital cost estimates are important in decisions on whether a project will be approved, mothballed, or abandoned. In South Africa, junior coal miners do not have extensive databases of historical projects from which to estimate capital costs. The purpose of this paper is to establish formulae that can be used for estimating capital costs of developing coal mines in a coal-producing country, using South Africa as a case study. The costs are estimated to an error of magnitude level of -30% to +50%, which is suitable for a concept study level, using a parametric estimation technique. The study uses data from completed coal mining projects from selected coal-producing countries. Three formulae are developed and presented for estimating capital costs of underground bord and pillar, surface shovel and truck, and dragline operations.
Keywords: coal mining, capital costs, parametric cost estimation
Introduction
Capital cost estimates play a critical role in deciding whether projects will proceed, be delayed, or abandoned. It is therefore important that capital cost estimates are carried out accurately as determined by the estimation guidelines based on the level of estimation conducted (Shafiee and Topal, 2012). The lack of literature on estimation of capital costs in many coal mining countries is adversely affecting junior coal miners, since they do not have an extensive database of historical projects on which to base estimations. In South Africa, the difficulty in estimating capital costs is attributable to lack of publicly available data on completed South African mining projects (Hall, 2013).
Harper (2008) estimated the capital costs of setting up coal mines in Australia, and Dipu (2011) conducted a similar exercise for India, but prior to this study no such investigation had been done for countries such as South Africa. The present investigation uses parametric estimation for estimating capital costs of developing coal mines in a coal-producing country, using South Africa as a case study.
A generic mining cost structure
There are two main types of costs for mining projects - operating and capital costs. Figure 1 is a schematic representation of the generic cost breakdown for mines. A brief overview of what these costs entail is discussed in the following sections.
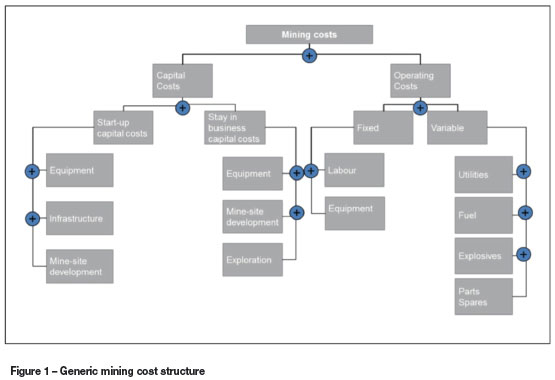
Capital costs
Capital costs in mines can be split into start-up (initial) and stay-in-business (working) capital costs. Start-up costs focus mainly on accessing the orebody, infrastructure (mining and beneficiation), equipment, environmental compliance, and licensing costs. For underground mines, accessing the orebody involves sinking shafts or adits, whereas for surface mines it involves the development of boxcuts and removal of initial overburden. It is common practice in the mining industry to hire contractors to carry out the initial work.
Infrastructure covered by start-up capital includes water and electricity connections, offices, workshops, change houses, roads, and employee accommodation. In some instances, small towns and off-mine infrastructure such as rail, roads, and ports need to be developed to accommodate employees and for transportation of coal (Rudenno, 2009). The infrastructure requirements also include mineral processing facilities or plants. The start-up capital expenditure is normally undertaken as quickly as is practically possible in order to move the project into production so that revenues can be generated (Rudenno, 2009). To reduce the costs associated with offmine infrastructure, it is common practice for mining companies to partner with the host government in what is known as public-private partnerships (PPPs) to develop such infrastructure (Jourdan, 2008).
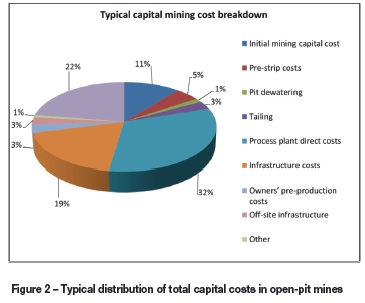
Once the mining project has taken off, additional infrastructure, development, equipment overhaul and replacement is financed through stay-in-business capital. Stay-in-business capital does not cover operational cost items that are needed to keep the mine running (Rudenno, 2009). Figure 2 shows a typical distribution of total capital costs for relevant activities in the production cycle in open-pit mines. The typical mining cost breakdown shown in Figure 2 was established by analysing the costs of different mines worldwide, as obtained from Anglo American Thermal Coal and the Raw Material Group's (RMG) databases.
Operating costs
Operating costs focus on the day-to-day running of a mine. These costs can be divided into fixed and variable costs. Variable costs vary with the tonnage produced; these costs include fuel, explosives, and electricity costs. Fixed costs, on the other hand, are independent of the tonnage produced, and they include labour costs that are not linked to production. Generally, operating costs are expressed in total costs per ton of ore mined; for example, South African coal mining costs are quoted as rands per ton of coal produced.
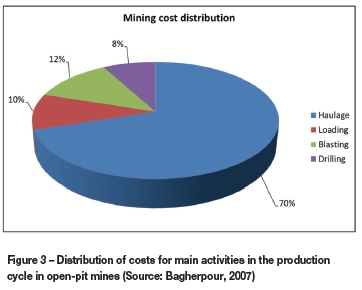
Figure 3 shows typical operating cost splits for relevant activities in the production cycle in open-pit mines. It can be seen that that hauling typically accounts for a significant proportion of the operating costs. The lowest cost activity in the production cycle is drilling.
Comparison of coal mining sectors by country
Mining costs differ from country to country due to factors such as general geology of the orebodies, infrastructure, labour productivity, and the level of economic development. According to the World Coal Institute, there are significant similarities between the South African and Indian coal mining sectors. The comparison was based mainly on coal geology, mining methods used, and labour productivity. Table I shows the relative contributions of room-and-pillar and longwall mining to underground coal extraction in seven coal-producing countries.
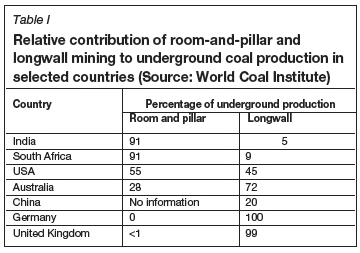
The similarities between South African and Indian coal mining methods play a significant role in the capital and operating cost structures. South African room-and-pillar mining operations are at shallow depths (generally less than 100 m) while the average range in India is about 300 to 350 m (Xie, 2008).
Mining costs in Indian mines are about 35% higher than costs in leading coal-exporting countries such as Australia, Indonesia, and South Africa (Santra and Bangaria, 2014). The higher mining costs in India are driven mainly by low labour productivity. In 2013 India forecast a production increase of 3%, compared to only a 2% increase in South Africa.
Background to cost estimation
Cost estimation can be defined as a predictive process used to quantify cost and price the resources required by the scope of an investment option, activity, or project (Leo and Knotowicz, 2005). Cost estimation can also be regarded as a process used to predict the uncertainty of future costs; in this context, the goal of cost estimating is to minimize the uncertainty of the estimate given the level of scope and definition (Leo and Knotowicz, 2005). The cost estimating process is generally applied during each phase of the project's life cycle and whenever the project scope is re-defined, modified, or refined. As the level of scope definition increases, the estimating methods used become more definitive and produce estimates with increasingly narrower probabilistic cost distributions.
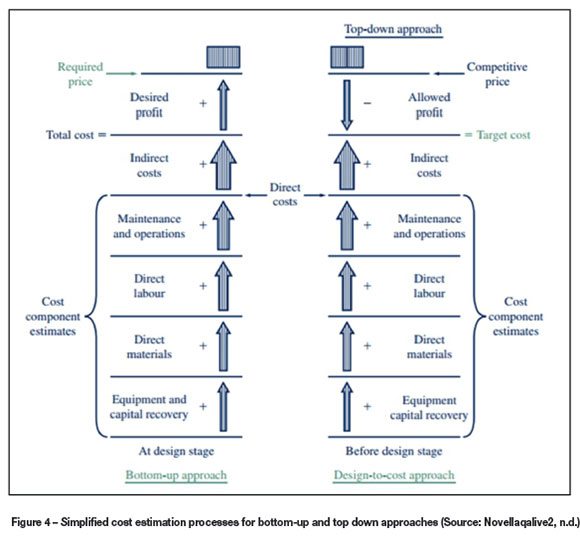
The two fundamental approaches to estimating costs are the top-down and bottom-up approaches. The top-down approach uses historical data from similar projects. It is best used when alternatives are still being developed and refined (Sullivan, Wicks, and Koelling, 2012). The bottom-up approach, on the other hand, is more detailed and works best when the detail concerning the desired output (product or service) has been defined and clarified (Sullivan, Wicks, and Koelling, 2012). In general, the bottom-up approach is more detailed than the top-down approach. Figure 4 shows the simplified cost estimation processes for the two approaches.
The results of cost estimations are used for a variety of purposes, including: > Planning the appropriate funding strategy
> Enabling decisions on the viability of feasibility studies
> Project analyses and evaluations in the research and development phase
> Evaluating alternative investments
> Serving as a basis for cost control activity during job execution.
Cost estimation in mining
According to Hall (2013), there is a lack of general estimates of capital costs for establishing coal mines in South Africa. In a 2008 regression analysis study, the Australian Average Capital Costs (ACC) for developing an open-pit mine were estimated as A$53 million plus A$33 million per 1 Mt/a of coal produced and treatment capacity, while the ACC for an Australian underground mine was estimated as A$37 million plus A$68 million per 1 Mt/a of production and treatment capacity (Harper, 2008).
In 2011 costs, the capital costs of surface coal mines in India were estimated to range from US$31.7-44.3 per ton of rated capacity. This means that a 1 Mt/a capacity mine can be expected to cost approximately US$44.3 million (Dipu, 2011). The above estimation is based on a stripping ratio of 4:1, and appropriate adjustments can be made to account for higher or lower stripping ratios. For underground mining, the estimates range is between US$40.7 and US$59.1 per ton of rated capacity. This means that a 1 Mt/a rated Indian coal mine will require an estimated capital cost of US$59.1 million (Dipu, 2011). The underground estimates are applicable to shallow mines (less than 150 m depth) operated with semi-mechanized bord-and-pillar mining methods.
Brief description of the parametric cost estimation methodology
Cost estimation was conducted using a parametric estimation model derived from parametric estimating techniques. A parametric estimation model is a mathematical representation of cost relationships that provides a logical and predictable correlation between the physical or functional characteristics of a project and its resultant cost (ISPA, 2008). According to Dysert (2005), parametric cost estimating models are useful tools for preparing early conceptual estimates where there is little technical information available to support the use of more detailed estimating methods.
In this study, actual project costs were used as dependent variables, whereas factors such as the main mine capacity, life of the mine, and stripping ratio were used as independent variables. Relationships between dependent and independent variables from historical data on global coal mines were used to estimate costs for future coal mining projects within a coalmining country. The model runs from an MS Excel® spreadsheet and capital costs are estimated to an order-of-magnitude level, which is appropriate for use at a concept study level. With all the cost models, data is normalized to ensure consistency.
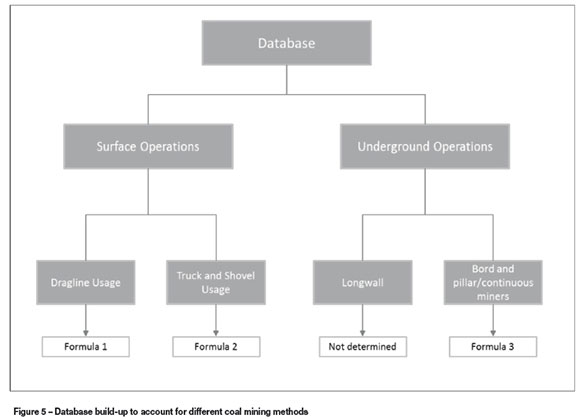
The first step in developing the model was determining the scope. The cost drivers for coal mines were identified to be studies, project management, site preparation, infrastructure, equipment, stores, and sundry. The above-mentioned cost drivers were not considered individually when estimating the total capital cost, due to lack of data. Figure 5 illustrates the build-up of the database to account for cost differences embedded in different mining methods.
Data was obtained from the Anglo American Thermal Coal and Raw Materials Group (RMG) databases. The cost data looks into actual costs, designed production capacities, stripping ratios, and run-of-mine (ROM) production.
As shown in Figure 5, data was first segmented into surface and underground operations. The rationale behind splitting the database in this way is to capture the influence of different mining methods on capital costs. Data for surface mining operations is further split into dragline operations and truck-and-shovel operations. Dragline operations consider a combination of truck-and-shovel and dragline as the main waste removal equipment. Underground operations are divided into room-and-pillar and longwall operations. Owing to the lack of longwall mining data-set for South Africa, and no immediate plans to build such operations, capital costs were not estimated for this type of mining method.
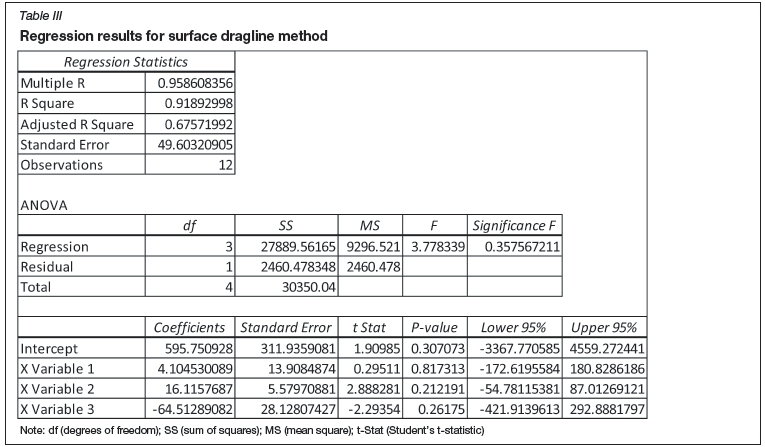
Dragline operations
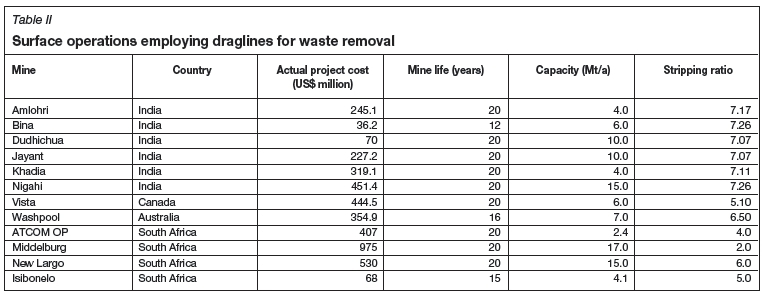
Dragline operations include mines that use a combination of dragline and truck-and-shovel for primary waste removal. Table II shows 12 global operations used in this study to develop a formula for estimating the capital costs of establishing surface coal mines employing draglines for waste removal in selected coal-mining countries, including South Africa. The actual project costs were normalized (adjusted to 2013 fiscal year) by using mining indices.
Table II shows that draglines are considered where the LOM exceeds 10 years. This is in part attributable to the high capital requirement for dragline equipment. Variations in production capacity in Table II show that draglines can be used for operations with less than 5 Mt/a production, probably if the stripping ratio is high and significant waste removal may be required.
As shown in Figure 6, mines with a higher rated capacity attract lower capital costs than mines with lower rated capacity. The capital cost and rated capacity relationship shown in Figure 6 can be attributed to the concept of economies of scale.
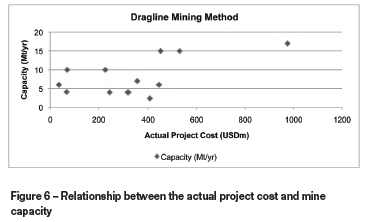
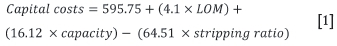
Table III shows the regression results used to develop a formula for surface coal mines using draglines. Based on the regression, the R2 value is equal to 0.9189, thus 91.89% of the variation in the data about the average is explained.
The best-fit line for the above data is given by:
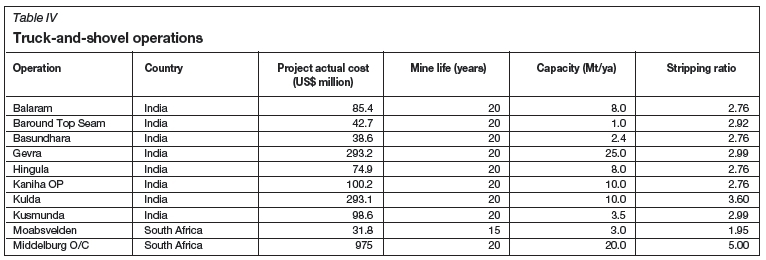
Truck-and-shovel operations
Truck-and-shovel is a commonly used method for surface coal mining. For this study, the operations were not standardized for either truck or shovel size. The actual project costs were normalized (adjusted to 2013 fiscal year) by using mining indices. The reason for using a global sample is the lack of sufficient data on completed operations in South Africa. Table IV lists the truck-and-shovel operations used in this study.
Figure 7 shows the relationship between capacity and actual project cost for truck-and-shovel operations.
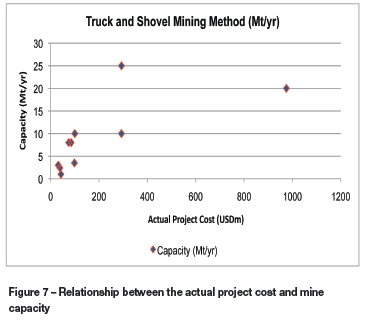
The operations used are based in South Africa and India. The design capacity of the operations ranges from 1.0 to 25.0 Mt/a (ROM). The variation in the design capacity is a clear indication of the flexibility of truck-and-shovel operations.
Table V shows the regression results used to develop a formula for surface coal mines using truck-and-shovel. Based on the regression in Table V, the R2 value is equal to 0.9882, meaning that 98.82% of the variation within the truck-andshovel date used is explained.
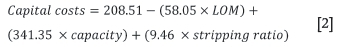
From Table V, the capital cost of establishing surface coal mines that use truck-and-shovel was determined to be:
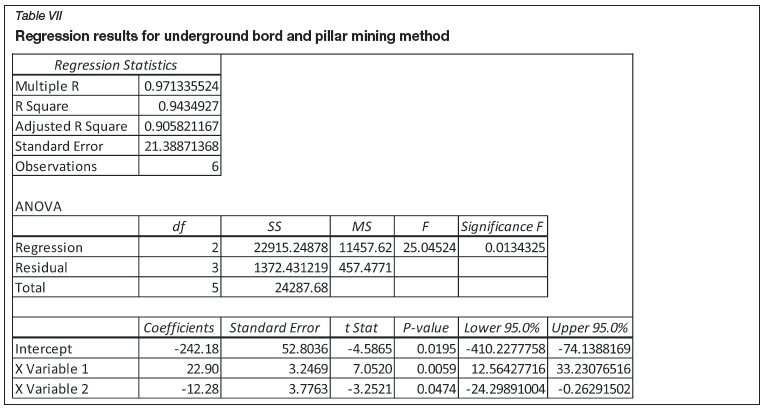
Bord-and-pillar mining method
The bord-and-pillar mining method as referred to in this report is limited to mechanized coal mining. The capital cost differences between traditional and conventional mining methods made it impractical to combine the cost data of two test mining methods. Table VI shows the operations used in the regression analysis.
Figure 8 shows the relationship between capacity and actual costs of establishing underground bord-and-pillar coal mines.
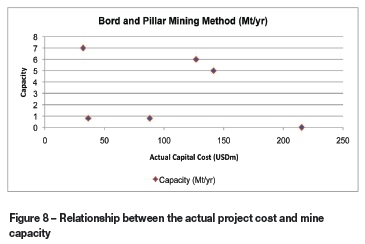
Table VII shows the statistical output of the regression analysis of underground bord-and-pillar operations. Based on the results, 90.58% of the variance between actual costs, mine life, and capacity is explained.
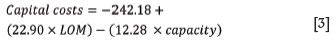
Once the coefficients were determined, Equation [3] for estimating capital costs was developed and used on the initial cost data to calculate the error between the actual and estimated costs.
Results
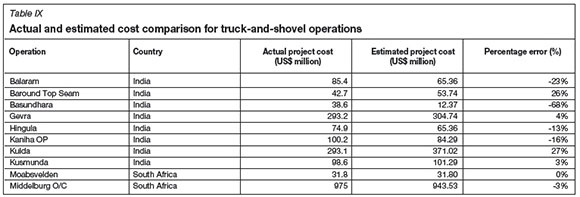
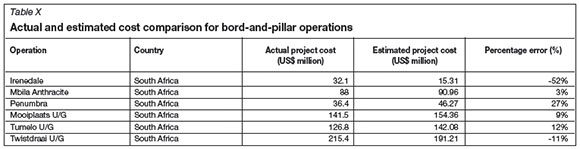
The formulae derived from regression analyses were used to estimate capital costs, which were later compared with the actual costs. The results are presented in Tables VIII-X.
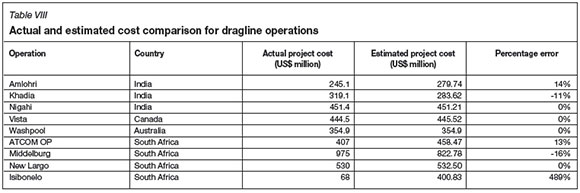
Using Equation [1], the error between actual project costs and estimated project costs range from zero to 489%. Three of the Indian operation (not shown in Table VIII) were classified as outliers and removed from the regression. Research conducted on the Isibonelo operation to further understand the drivers behind the high percentage error revealed that some of the major items of equipment used to establish the operation were not purchased, but were moved from existing operations. Based on the calculated error, the formula can be used to estimate capital costs of establishing coal mines in a coal-producing country to an order-of-magnitude level.
From Table IX it can be seen that Basundhara coal mine in India is an outlier. The calculated error between actual and estimated projects costs range from -23% to 27%. Based on the definition and error limits of 'error of magnitude' estimation level, it can be concluded that Equation [2] can be used to estimate the cost of establishing surface truck-andshovel operations to an error-of-magnitude level.
From Table X, it can be seen that the calculated error ranges from -52% to 27%. Irenedale mine cost data is regarded as an outlier and was eliminated from further analyses. Some of the factors that influenced the Irenedale cost data are the deeper shafts compared to other operations and the establishment of a surface overland conveyor.
Based on the parameters of order-of-magnitude estimation level, it can be concluded that Equation [3] can be used to to estimate the capital costs of establishing mechanized underground coal mines in a coal-producing country to an order-of-magnitude level.
Discussion and conclusion
The scarcity of capital cost data on the lowest cost-activity levels is a challenge in the mining industry. Most databases only provide data at a high level (total capital costs) without any detailed cost breakdown. The study is limited to countries where off-mine infrastructure has been established to support the development and construction of coal mines. The study is also limited to areas where skills related to mine development are available.
The three formulae developed in this study can be used to estimate capital costs of establishing coal mines in a coal-producing country to an error-of-magnitude level of -30% to +50% as illustrated by Tables VIII to X. This level of estimation is appropriate at the conceptual study stage. The correlation between capital costs required for establishing coal mines in South Africa and India is quite significant and clearly visible from the resultant errors calculated between actual and estimated costs. No formula could be developed for estimating capital costs of establishing underground longwall mines due to the lack of actual cost data from such mines in both South Africa and India.
In conclusion, this study was able to establish formulae that can be used in the early stages of coal mining projects to estimate the costs of establishing surface and underground coal mines in a coal-producing country to an order-of-magnitude estimation level.
Acknowledgement
The work reported in this paper is part of an MSc research study at the University of the Witwatersrand
References
Bagherpour, R. 2007. Technical and economical optimization of surface mining processes - development of a database and a program structure for the computer-based selection and dimensioning of equipment in surface mining operations, PhD thesis, Department of Energy and Management, Technical University of Clausthal. [ Links ]
Dipu, D. 2013. Capital costs of Indian coal mining project - an analyst view. http://wiww.coalspot.com/news/1888/capital-costs-of-indian-coal-mining-project/1 [Accessed 28 May 2014]. [ Links ]
Dysert, L.R., 2005. So you think you're an estimator? AACE International Transaction, EST.01. [ Links ]
Hall, I. 2013. Anglo American Thermal Coal. Personal communication. [ Links ]
Harper, P. 2008. What does a feasibility study cost? International Mining, April 2008, pp 60- 61. [ Links ]
International Society of Parametric Analysts (ISPA). 2008. Parametric Estimating Handbook, 4th edn. Vienna, VA, USA [ Links ]
Jourdan, P. 2008. Plan of Action for African Acceleration of Industrialization- Promoting Resource-Based Industrialization: a Way Forward. Mimeo, Pretoria, [ Links ]
Leo, D.W. and Knotowicz, S.W. 2005. Project Estimate Reviews. AACE International Transactions. EST 05. Morgantown, WV. [ Links ]
Novellaqalive2. Not dated. Cost estimation and indirect cost allocation http://novellaqalive2.mhhe.com/sites/dl/free/007096310x/591328/ch18_CostEstimation.pdf [Accessed 28 May 2014]. [ Links ]
Rudenno, V. 2009. The Mining Valuation Handbook: Mining and Energy Valuation for Investors and Management. 3rd edn. Milton, Queensland, Australia. [ Links ]
Santra, S. and Bangaria, N. 2014. Labour productivity in coal mining sector in India: with a special focus on major coal mining states. Researchjoumali's Journal of Human Resource, vol. 2, no. 1, January. [ Links ]
Shafiee, S. and Topal, E. 2012. New approach for estimating total mining costs in surface coal mines. Transactions of the Institute of Materials, Minerals and Mining. Section A: Mining Technology, vol. 121, no. (3. pp. 109-116. [ Links ]
Sullivan, W., Wicks, E., and Koelling, C. 2012. Engineering Economy. 15th edn. Prentice Hall. [ Links ]
Xie, G. 2008. Influence of thickness to the mechanical characteristics of gateways at FMTC faces. Journal of Coal Science Engineering (China), vol. 14, no.1. pp. 1-5. [ Links ]
Paper received Aug. 2014
Revised paper received Apr. 2015

