


Services on Demand
Article
 English (pdf)
 Article in xml format
 Article references
Indicators

Related links
-
 Cited by Google
 -
 Similars in Google
Share

 Permalink
Journal of the Southern African Institute of Mining and Metallurgy
On-line version ISSN 2411-9717
Print version ISSN 2225-6253
J. S. Afr. Inst. Min. Metall. vol.115 n.8 Johannesburg Aug. 2015
http://dx.doi.org/10.17159/2411-9717/2015/V115N8A7
The influence of selected biomass additions on the co-pyrolysis with an inertinite-rich medium rank C grade South African coal
C.A. StrydomI; T.Z. SehumeI; J.R. BuntI, II; J.C. van DykI, III
IChemical Resource Beneficiation, North-West University, Potchefstroom, South Africa
IISasol Technology (Pty) Ltd, South Africa
IIIAfrican Carbon Energy, South Africa
SYNOPSIS
Co-pyrolysis of four biomass samples (hardwood chip, softwood chip, pinewood chip, and sugarcane bagasse) with an inertinite-rich medium rank C South African coal was investigated. Proximate and ultimate analyses of the chars prepared using a heating rate of 10°C/min up to 1100°C in a nitrogen atmosphere were used to compare the properties of the biomass and the coal chars. Similar gross calorific values (28.5-29.1 MJ/kg) for the woody biomass-coal blended chars were observed, which were slightly higher than that of the coal char sample (26.5 MJ/kg). CO2 surface areas of the chars of the woody biomass samples (328.1-329.4 m2/g) and of the blends (238.5-271.5 m2/g) were higher than that of the coal char sample (94.2 m2/g). Thermogravimetric (TG), differential thermal analyses (DTG), and calculated weighted averaged TG curves indicated that the influence of the biomass on the pyrolysis rate of the coal is small and vice versa. The CO2-producing reactions of the coal were slightly enhanced during co-pyrolysis.
Keywords: inertinite-rich coal, biomass, co-pyrolysis, TG-MS, CO2 evolution
Introduction
Coal utilization has led to rising concerns about adverse impacts on the environment (global warming) caused by toxic gases (H2S, SOx, NOx, and CO2) and remaining waste. Biomass is considered to be CO2-neutral with regard to the greenhouse gas balance, and is regarded as a renewable source that assists in reducing CO2 emissions when compared with coal (McGowan, 1991; McKendry, 2002). Biomass currently makes up approximately 14% of the world's energy sources (McGowan, 1991; McKendry, 2002). Coal combustion and gasification are prominent processes in South Africa (in producing synthesis gas and energy) due to the abundance of coal in the country. Some of South Africa's coal resources are, however, high in ash content and also are inertinite-rich, which renders them more difficult to use industrially than vitrinite-rich low-ash coal (Jeffrey, 2005; Strydom et al., 2011). There is a need to investigate the properties and behaviour of the inertinite-rich high-ash South African coals and especially their interaction with local biomass sources.
The gasification process occurs through various stages, of which pyrolysis of the char residue forms an integral part (Bunt and Waanders, 2009). Currently, particular interest is shown in the co-utilization of coal and biomass to produce synthesis gas via the gasification process (Usón et al., 2010; McGowan, 1991; McKendry, 2002). Investigating the co-pyrolysis of the South African coal and local biomass material is thus the first step in evaluating the use of local biomass sources for co-gasification purposes.
No reported research on the influence of biomass during co-pyrolysis with high-ash inertinite-rich coal is available. Previous studies focused on fast pyrolysis of biomass and coal-biomass blends to produce bio-oil, as well as co-gasification using vitrinite-rich coals and biomass (Collot et al., 1999; Moghtaderi et al., 2004; Kumabe et al., 2007; De Jong et al., 1999). A better understanding of low-molecular-mass gaseous products formed by the pyrolysis process during co-utilization is required. In this work, the co-pyrolysis behaviour of the original materials (coal, hardwood chips, softwood chips, pinewood chips, and sugarcane bagasse) and their blends with an inertinite-rich South African coal is reported. Properties of the resulting chars were also investigated and will be discussed.
Materials and methods
Coal and biomass samples
An inertinite-rich medium rank C bituminous coal from the Witbank coalfield in South Africa, previously analysed in detail by Hattingh et al. (2013), was obtained. The sample was milled and sieved to a size fraction of -75 μm and stored under nitrogen. Hattingh et al. (2013) described the analysis techniques and characteristics of the coal sample in detail. The coal sample contains 24.4% vitrinite, 72.2% inertinite, and 3.3% liptinite (mineral-matter-free basis). The vitrinite reflectance is reported as 0.81 Rr% (Hattingh etal., 2013). The sample contains 83.8% carbon, 4.3% hydrogen, 11.5% oxygen, 2.1% nitrogen, and 1.0% sulphur (DAF basis), and the proximate analysis indicated 15.2% ash, 25.2% volatile matter, and 59.6% fixed carbon (DB).
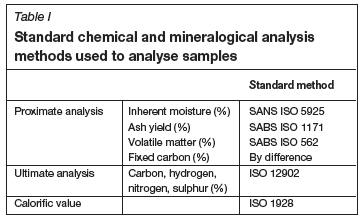
The biomass used was chosen based on the seasonal availability of resources. The Sappi Forest Division Company (South Africa) supplied the following biomass materials: (1) soft woodchip (SWC), (2) hard woodchip (HWC), and (3) pine woodchip (PWC). TSB Sugar Company (South Africa) supplied sugarcane bagasse (SB). The biomass samples were pulverized to -75 μm. Prior to further investigation, all samples were dried in an oven at 80°C for 24 hours to remove surface moisture. All samples were mixed thoroughly using a small ball mill before further use, and were stored in a desiccator flushed with N2. Samples were characterized using the standard methods for chemical and mineralogical analysis, as summarized in Table I.
XRF analyses were performed according to the ASTM D4326 standard method (ASTM D'4326, 2012). A Micromeritics ASAP 2010 analyser was used to determine the surface areas of the char samples using CO2 adsorption.
Pyrolysis reactivity
A known weight percentage of biomass (0%, 20%, 40%, 60%, 80%, and 100%) was added to the inertinite-rich coal and mechanically mixed using a Wig-l-Bug. The pyrolysis behaviour of the coal, biomass, and their blended samples were investigated using a SDTQ 600 thermogravimetric analyser coupled to a Cirrus MKS quadruple mass spectrometer. Sample masses of approximately 25 mg of coal, biomass, or of the blended samples were thermally treated in a nitrogen environment from ambient temperature to 1100°C, using a heating rate of 10°C/min. Al2O3 ceramic sample pans were used. The evolution of some of the low-molecular-mass gaseous species (H2, CH4, H2O, and CO2) was recorded simultaneously with the mass loss data. The mass loss and gaseous product curves were recorded as a function of temperature and time during the thermal treatment of each sample. Data acquisition was repeated at least three times to ensure repeatability. Averaged curves were used for further analysis.
Larger amounts of the coal, biomass, and their blended chars were also prepared in a tube furnace. Ceramic pans (150 mm χ 45 mm χ 12 mm) were used to load a known sample mass into the centre of the tube furnace. The system was then flushed with N2 for 10 minutes prior to heat treatment. The heating programme used to prepare the chars was identical to the heat treatment of the samples in the thermogravimetric analyser. After reaching 1100°C, the samples were cooled to room temperature in the tube furnace under the nitrogen atmosphere (duration of cooling time was approximately 6 hours).
Results and discussion
Char properties
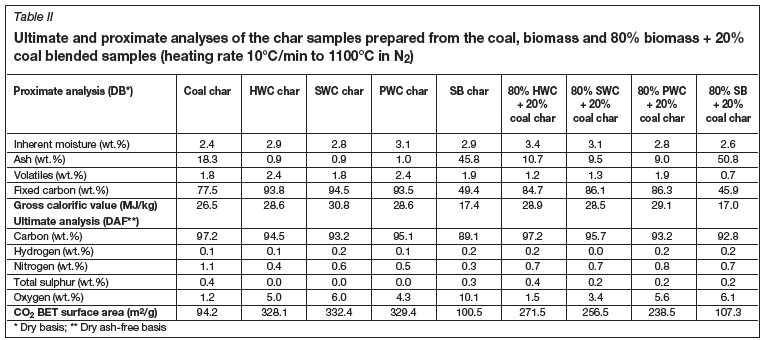
The ultimate and proximate analysis data and CO2 surface areas of the chars of the coal, biomass, and blended samples, are summarized in Table II.
The high ash content of the sugarcane bagasse char and 80% SB + 20% coal char could be due to soil particles having been incorporated during harvesting. The high ash content of the SB sample also resulted in a lower calorific value, as expected. The gross calorific values of the biomass chars were higher than that of the coal char, except for the SB biomass sample, which contains a very high percentage of ash. The gross calorific values of the blended samples (28.5-29.1 MJ/kg) are close to that of the coal and biomass char samples (26.5-30.8 MJ/kg ), except for the SB biomass sample, which as indicated has a high ash content. When harvesting biomass for use during co-processing with coal, care should be taken not to include soil in the biomass samples. Co-pyrolysis of coal and biomass seems to result in a similar product (char) in terms of calorific value.
Ultimate analysis results suggest that the SB biomass sample reacts differently from the woody biomass samples, as less carbon and more oxygen are retained in the biomass char sample. The surface area of the SB biomass char sample was also much lower than the values for the woody biomass chars, but this could also be due to the large amount of ash that the SB char contains.
The surface areas of the biomass chars were greater than those of the coal and blended chars. The surface areas of the blended sample chars were observed to be still much higher than that of the coal char, indicating that the pores of biomass chars were not substantially blocked by carbonaceous deposits (Darmstadt et al., 2001).
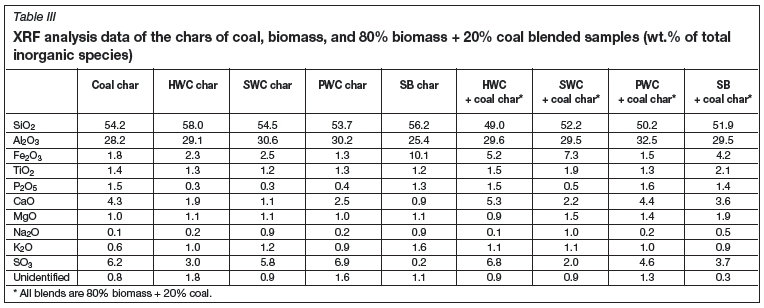
XRF analysis data for the charred samples of the coal, biomass, and 80% biomass+20% coal blended samples are given in Table III.
XRF analysis of the SB shows that the sample contains relatively large amounts of Si and Fe, measured as SiO2 and Fe2O3, indicating the presence of soil, as also evident from the measured ash percentage (Table II).
Thermogravimetric analysis
Figure 1 shows the curves of mass loss versus temperature for the coal and four biomass samples heated at 10°C/min under a nitrogen atmosphere in the TGA. The mass loss curves indicate that SB has the largest amount of residue char (35 wt.%) of all the biomass samples after heating to 1100°C. The larger mass percentage residue obtained is due to the high ash content of SB. The unreacted mass percentages of PWC and HWC were 17 wt.% and 16 wt.% respectively, with SWC showing the lowest residue percentage (15 wt. %). The mass loss curves of the coal sample indicated approximately 75% unreacted mass (char).
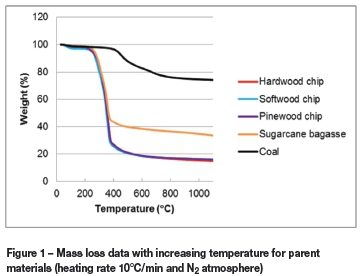
Figure 2 presents the derivative thermogravimetric (DTG) curves of the biomass samples and of the coal. The curves show that the degradation range of the biomass samples is approximately 180-525°C. The PWC and SWC samples show a single peak with maximum mass loss rate at approximately 360°C for both biomasses. The SB and HWC samples exhibit two major peaks, which overlap and have maximum rates of mass loss at 308 and 353°C (SB) and 289 and 357°C (HWC). The well-described main composition of biomass is hemicel-lulose, cellulose, and lignin (Yang etal., 2007; Demirbas, 2000). The first peak is associated with the decomposition of hemicellulose, while the second peak (at the higher temperature) is associated with the decomposition of cellulose (Oudia et al., 2007; Demirbas, 2000). The four biomass samples exhibit shoulders on the DTG curves at approximately 440°C. These shoulder peaks are ascribed to the degradation of lignin, which occurs at a higher temperature than the decomposition of hemicellulose and cellulose (Yang et al., 2007; Oudia et al., 2007; Demirbas, 2000).
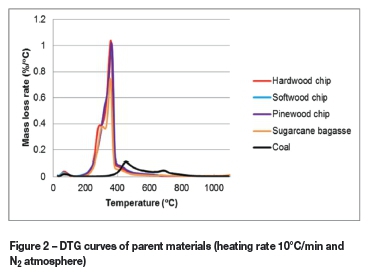
The coal sample showed two distinctive DTG peaks at approximately 451°C and 695°C. According to Serio et al. (1987) the release of primary volatiles (such as light hydrocarbons and condensable tars) from coal predominates at approximately 500°C. Radovic et al. (1983) stated that coal pyrolysis above 650°C was due to gases being released during condensation reactions, thermal decomposition of carbonates, and breakdown of aromatic rings.
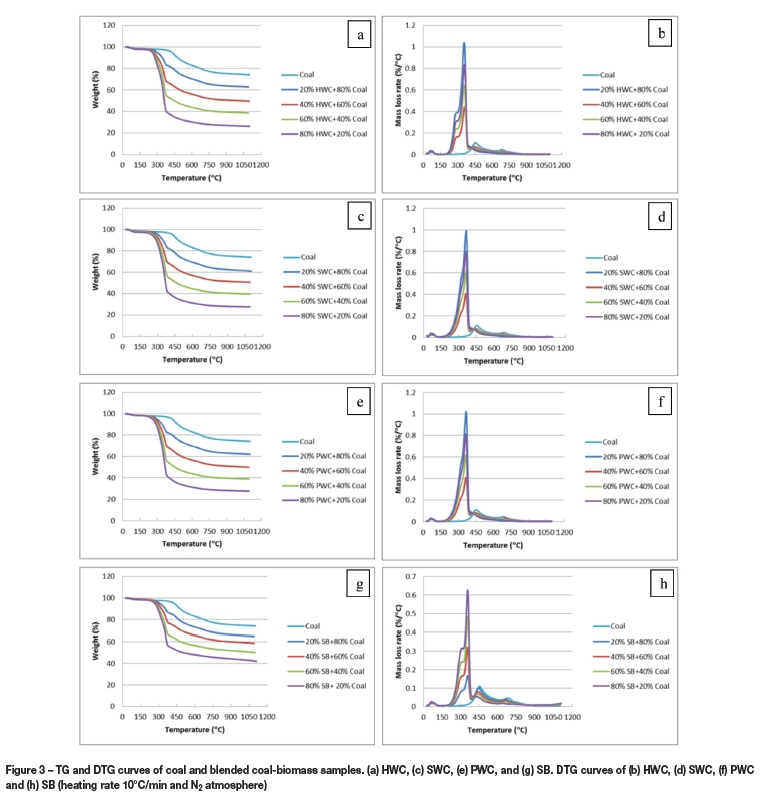
Figure 3 presents the thermogravimetric (TG) and differential thermal analyses (DTG) curves of the coal and the blended samples. As expected, the higher the amount of biomass in the blend, the lower the char yield. The DTG curves of the blended samples are similar to those of the individual materials. The devolatilization process of the blended samples started at approximately 160°C and was completed at around 900°C. Some of the DTG peak maximum temperatures are listed in Table IV to facilitate investigation of possible shifts in the maximum rate of reaction steps.
The DTG peak maximum values for the degradation step at approximately 360°C do not differ substantially (353-365°C) and no trend was observed. The DTG peak maximum values of the coal devolatilization step at approximately 450°C also only differ between 437 and 451°C although, where visible, the DTG peak maxima for the blends were lower than that of the coal sample. The blended samples' DTG peak maximum values, just lower than 700°C, show a decreasing trend with an increase in biomass percentage in the blends. The values are also lower than that for coal, except for the PWC sample, but then the value did not differ substantially (+5°C). These trends will be compared to the evolution of gases as observed from the mass spectro-scopic data.
The effect of the four selected biomass samples on the pyrolysis of coal and the possible effect of the coal on the pyrolysis of the biomass samples were investigated. This was done by calculating the theoretical mass loss curves (weighted averages) from the TG curves of the raw materials. The theoretical mass loss curves were calculated using the following equation:
Ycalculated = x1Y1 + x2Y2
where x1 and x2 represent the fractions of the coal and biomass in the blends, and Y1 and Y2 are the mass loss percentages of coal and biomass, respectively, at the various temperatures. The calculated weighted average TG curves were compared to the experimentally derived results.
Figure 4 presents a comparison between the experimentally obtained conversions and calculated mass loss curves for the 80% biomass + 20% coal blended samples. The curves for all the other blends follow the same trends.
The deviation at each temperature was calculated using the following equation:
Deviation% = (Experimental remaining mass%-Calulated remaining mass%)/Experimental remaining mass%
The average deviation percentage of each curve was calculated. The average deviation and observed maximum deviation percentages (with the temperature range in which the maximum deviation was observed) are listed in Table V.
The calculated weighted average TG curves for all the blends were close to the experimentally determined results, with a maximum average deviation of less than 3% and a maximum deviation percentage of less than 12% observed for the 80% SWC + 20% coal blend at approximately 360°C. The maximum deviation percentages for the higher biomass-to-coal ratio blends occurred at approximately 360°C under the experimental conditions and were pronounced only for HWC and SWC. The decomposition of cellulose occurs at approximately 360°C (Yang et al., 2007; Oudia et al., 2007; Demirbas, 2000).
These small average differences between the calculated TG curves and the experimental TG curves indicate that the influence of the biomass samples on the coal reactivity is small, and vice versa. These results are similar to those obtained by Moghtaderi et al. (2004), Sonobe et al. (2008), and Sadhukhan et al. (2008) using blended samples of coal and Radiata pine wood, corncob, and waste wood biomass samples.
Mass spectroscopy
To obtain a better understanding of the influence of co-pyrolysis of biomass and coal on the process, the mass spectroscopic data for gases H2, CH4, H2O, and CO2, as they were evolved at the various temperatures during the pyrolysis of the samples, were investigated.
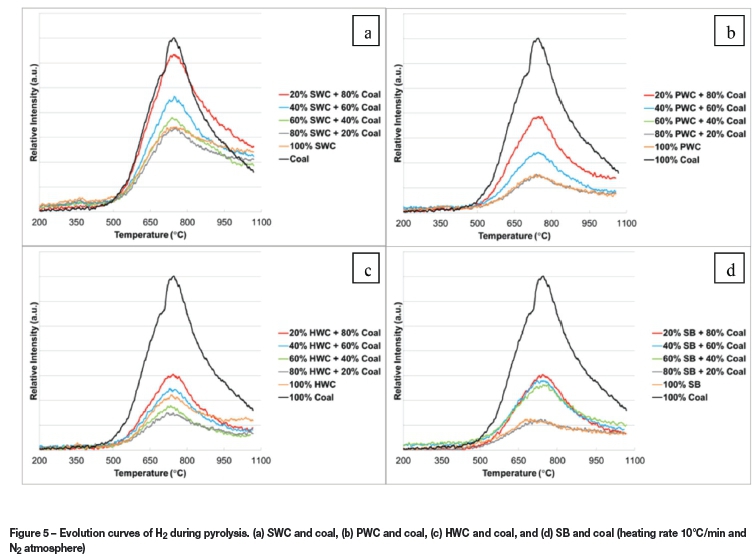
Figure 5 shows the evolution profiles of H2versus temperature at a heating rate of 10°C/min under an inert environment for biomass samples, coal, and blends. The evolution of H2 was followed by observing the H2+ mass spectroscopic data (m/z = 2). The evolution of H2 increased with an increase in temperature, as was expected, and a maximum rate of H2 evolution is reached for all samples at approximately 740°C, except for the SB biomass sample, which showed a maximum rate of H2 evolution at approximately 680°C. The H2 evolution profiles of the blends stayed similar in shape with an increase of the blending ratio.
The chemical mechanisms of evolution of H2 during devolatilization of coal and biomass are described in the literature (Yang et al., 2007; Van Heek and Hodek, 1994; Demirbas, 2000; Gavalas et al., 1981). The similar shapes and peak maximum temperature values indicate that the reactions by which H2 is evolved during devolatilization of the blends are not significantly changed by adding biomass to coal. The biomass thus does not seem to influence the pyrolysis degradation reactions evolving H2 in coal, and vice versa.
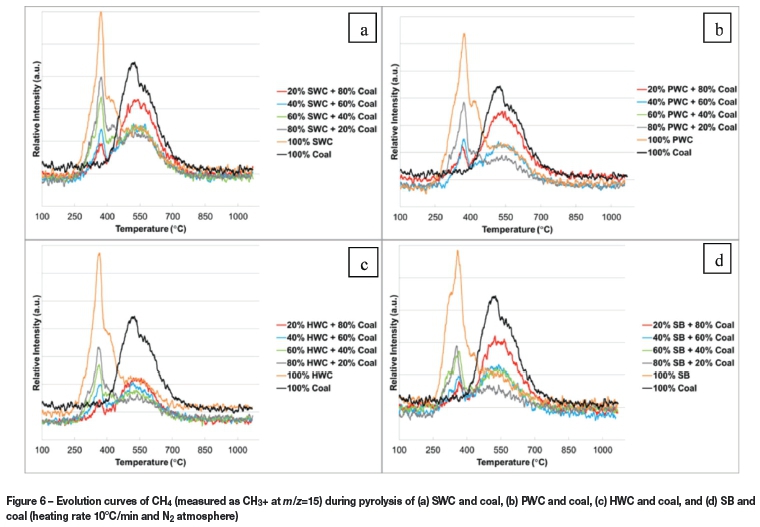
Figure 6 illustrates the evolution of CH4 with an increase in temperature during the devolatilization of coal, biomass, and blended samples. The fragment CH3+, with m/z value of 15, was chosen to represent methane (CH4) in order to prevent interference from oxygen (m/z of 16). Methane is known to easily ionize by giving off hydrogen ions in the mass spectrometer (Huang et al., 2011). From Figure 6 it can be observed that the formation of CH4 started at temperatures just above 210°C for biomass and blended samples, and the evolution of CH4 from coal started at temperatures above 400°C. A similar evolution of CH4 was observed by other authors for the thermal degradation of coal during pyrolysis, and the chemical reactions where methane is evolved during pyrolysis of coal have been well described (Yang et al., 2007; Van Heek and Hodek, 1994; Di Nola et al., 2010; Gavalas et al., 1981).
The evolution of methane from the biomass and blended samples during pyrolysis showed a similar pattern to that of the DTG curves (Figure 3). The CH4 temperature evolution profiles of the blends are similar in shape and have similar peak maximum temperature values to the starting materials. The biomass thus does not seem to influence the pyrolysis degradation reactions evolving CH4 in coal and vice versa.
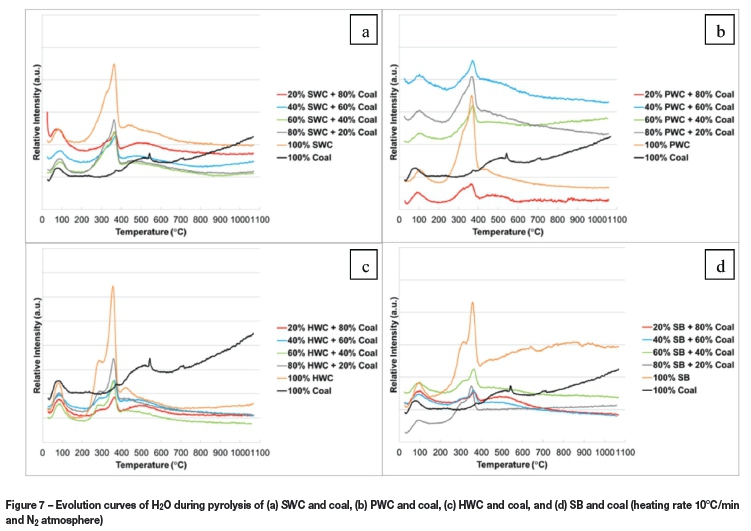
Figure 7 shows the evolution of H2O with increasing temperature during the pyrolysis of coal, biomass, and blended samples. Moisture is released below 150°C from all the samples. The four biomass samples started evolving H2O around 200°C in at least two overlapping steps (as also observed in the DTG curves in Figure 3). The evolution of H2O in this temperature range is related to the thermal decomposition of hemicellulose and cellulose in the biomass samples (Bassilakis et al., 2001; Worasuwannarak et al., 2007; Huang et al., 2011; Demirbas, 2000).
H2O evolution from the coal started at approximately 320°C, reaching a maximum rate at 520°C. This is due to condensation reactions occurring and can be explained by the relatively high oxygen content in the coal sample (Di Nola et al., 2010; Gavalas et al. 1981). Production of H2O from all the blends was between 250°C and 500°C. The H2O evolution profiles of the blends between 200°C and 400°C stayed similar in shape with an increase in blending ratio. The H2O temperature evolution profiles of the blends are similar in shape and have similar peak maximum temperature values to the starting materials. The biomass thus does not seem to influence the pyrolysis degradation reactions evolving H2O in coal and vice versa.
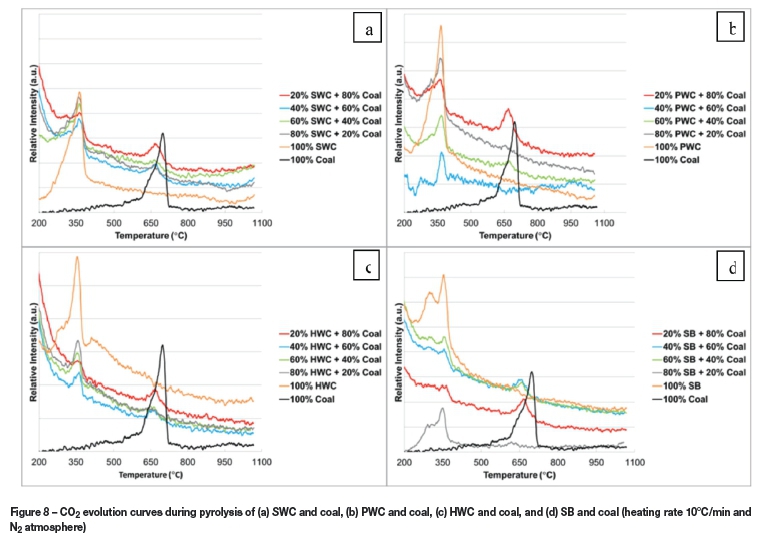
Figure 8 shows the evolution of CO2 with increasing temperature during the thermal degradation of all the samples in the N2 atmosphere. At lower temperatures, the evolution of CO2 during thermal degradation of a bituminous coal is due to the decomposition of aliphatic, aromatic carboxyl, and carboxylate groups (Gavals et al., 1981; Di Nola et al., 2010). At higher temperatures, CO2 evolution during thermal treatment is ascribed to the decomposition of the more stable ether structures, oxygen-bearing heterocyclic compounds, and carbonates. In addition, the existence of intra-molecular carboxylic acid anhydrides in the bituminous coal may also contribute to the formation of CO2 during pyrolysis (Gavalas et al., 1981; Van Heek and Hodek, 1994). The CO2 evolution spectra of coal exhibited a single peak that started from approximately 400°C and reached maximum rates of CO2 evolution at 695°C.
CO2 evolution from the biomass samples is derived mainly from the cracking and reforming of functional groups of carboxyl (C=O) and COOH in the biomass material (Yang et al., 2007). The spectra exhibited CO2 peaks that started at approximately 220°C for the biomass and blended samples and reached maximum peak heights at approximately 370°C. Below 500°C, the peak shapes and peak maximum temperature values for the blended samples are similar to those of the related biomass samples, and the presence of coal seems thus not to influence the thermal degradation of the biomass samples during pyrolysis.
The evolution of CO2 from the coal in the blends resulted in peak maximum temperatures that are shifted lower to approximately 660°C for the blended samples. These results are confirmed by the DTG peak maximum values for the blends, which show a decreasing trend with increasing biomass percentage in the blends (Figure 3 and Table IV). The decrease of approximately 35°C of the temperature at the maximum rate of CO2 evolution from the coal is significant, and indicates that the presence of biomass influences the chemical reactions through which CO2 is evolved from the coal. The CO2-producing reactions in coal seem to be catalysed by the presence of the biomass or the biomass degradation products, which could be either in the gaseous or the solid phase. The enhancement of the CO2 evolution reactions of coal is, however, only slight.
During co-pyrolysis with the biomass material, the inertinite-rich bituminous coal behaves similarly to the vitrinite-rich bituminous coals studied previously, except for the slight enhancement of the CO2 evolution reactions in the case of the inertinite-rich bituminous coal (Collo, et al., 1999; Moghtaderi et al., 2004; Kumabe et al., 2007; De Jong et al., 1999).
Conclusion
Co-pyrolysis of the woody biomass samples and the inertinite-rich coal at a heating rate 10°C/min up to 1100°C resulted in chars with similar gross calorific values and carbon, nitrogen, and volatile mass percentages. TG, DTG, and MS results at the maximum rate of CO2 evolution showed that the co-pyrolysis slightly enhances the CO2-producing reactions in the coal. The reactions producing H2, CH4, and H2O were not influenced by co-pyrolysis. Co-pyrolysis of softwood chip, hardwood chip, pinewood chip, and sugarcane bagasse with the inertinite-rich rank C bituminous coal results in chars with slightly enhanced properties for gasification.
Acknowledgements
The authors would like to thank Sasol Technology Research and Development and North-West University for partial funding of this research. The work presented in this paper is based on research supported by the South African Research Chairs Initiative of the Department of Science and Technology and National Research Foundation of South Africa (Coal Research Chair Grant No. 86880).
References
Bassilakis, R., Carangelo, R.M., and Wojtowicz, M.A. 2001. TG-FTIR analysis of biomass pyrolysis. Fuel, vol. 80. pp. 1765-1786. [ Links ]
Bunt, J.R. and Waanders, F.B. 2009. Pipe reactor gasification studies of a South African bituminous coal blend: part 1 - carbon and volatile matter behaviour as function of feed coal particle size reduction. Fuel, vol. 88. pp. 585-594. [ Links ]
Collot, A.G., Zhuo, Y., Dugwell, D.R., and Kandiyoti, R. 1999. Co-pyrolysis and co-gasification of coal and biomass in bench scale fixed bed and fluidized bed reactors. Fuel, vol. 78. pp. 667-679. [ Links ]
Darmstadt, H., Garcia-Perez, M., Chaala, A., Cao, N., and Roy, C. 2001. Co-pyrolysis under vacuum of sugar cane bagasse and petroleum residue: properties of the char and activated char products. Carbon, vol. 39. pp. 815-825. [ Links ]
De Jong, W., Andries, J., and Hein, K.R.G. 1999. Coal/biomass co-gasification in a pressurized fluidized bed reactor. Renewable Energy, vol. 16. pp. 1110-1113. [ Links ]
Demirbas, A., 2000. Mechanisms of liquefaction and pyrolysis reactions of biomass. Energy Conversion and Management, vol. 41. pp. 633-646. [ Links ]
Di Nola, G., de Jong, W., and Spliethoff, H. 2010. TG-FTIR characterization of coal and biomass single fuels and blends under slow heating rate conditions: Partitioning of the fuel-bound nitrogen. Fuel Processing Technology, vol. 91. pp. 103-115. [ Links ]
Gavalas, G.R., Cheong, P.H., and Jain, R. 1981. Model of coal pyrolysis. 1. Qualitative development Industrial and Engineering Chemistry Fundamentals, vol. 20. pp. 113-122. [ Links ]
Hattingh, B.B., Everson, R.C., Neomagus, H.W.J.P., Bunt, J.R., Van Niekerk, D., Jordaan, J.H.L., and Mathews, J.P. 2013. Elucidation of the structural and molecular properties of typical South African coals. Energy Fuels, vol. 27. pp. 3161-3172. [ Links ]
Huang, Y.F., Kuan, W.H., Chiueh, P.T., and Lo, S.L. 2011. Pyrolysis of biomass by thermal analysis-mass spectrometry (TA-MS). Bioresource Techology, vol. 102. pp. 3527-3534. [ Links ]
Jeffrey, L.S. 2005. Characterization of the coal resources of South Africa. Journal of the South African Institute of Mining and Metallurgy, vol. 105, no. 2, pp. 95-102. [ Links ]
Kumabe, K., Hanaoka, T., Fujimoto, S., Minowa, T., and Sakanishi, K. 2007. Co-gasification of woody biomass and coal with air and steam. Fuel, vol. 86, no. 5. pp. 684-689. [ Links ]
McGowan, F. 1991. Controlling the greenhouse effect: the role of renewables. Energy Policy, vol. 19, no. 2. pp. 110-118. [ Links ]
McKendry, P. 2002. Energy production from biomass (part 1): overview of biomass. Bioresource Techology, vol. 83, no. 1. pp. 37-46. [ Links ]
Moghtaderi, B., Meesri, C., and Wall, T.F. 2004. Pyrolytic characteristics of blended coal and woody biomass. Fuel, vol. 83, no. 6. pp. 745-750. [ Links ]
Oudia, A., Mészáros, E., Simöes, R., Queiroz, J., and Jakab, E. 2007. Pyrolysis-GC/MS and TG/MS study of mediated laccase biodelignification of Eucalyptus globulus kraft pulp. Journal of Analytical and Applied Pyrolysis, vol. 78, no. 2. pp. 233-242. [ Links ]
Radovic, L.R., Walker, P.L., and Jenkins, R.G. 1983. Importance of carbon active sites in the gasification of coal chars. Fuel, vol. 62, no. 7. pp. 849-856. [ Links ]
Sadhukhan, A.K., Gupta, P., Goyal, T., and Saha, R.K. 2008. Modelling of pyrolysis of coal-biomass blends using thermogravimetric analysis. Bioresource Technology, vol. 99, no. 17. pp. 8022-8026. [ Links ]
Serio, M.A., Hamblen, D.G., Markham, J.R., and Solomon, P.R. 1987. Kinetics of volatile product evolution in coal pyrolysis: experiment and theory. Energy Fuels, vol. 1, no. 2. pp. 138-152. [ Links ]
Sonobe, T., Worasuwannarak, N., and Pipatmanomai, S. 2008. Synergies in co-pyrolysis of Thai lignite and corncob. Fuel Processing Techology, vol. 89, no. 12. pp. 1371-1378. [ Links ]
Strydom, C.A., Bunt, J.R., Schobert, H.H., and Raghoo, M., Changes to the organic functional groups of an inertinite rich medium rank bituminous coal during acid treatment processes. Fuel Processing Technology, vol. 92, no. 4. pp. 764-770. [ Links ]
Us'on, S., Valero, A., Correas, L., and Martinez, Á. 2010. Co-Gasification of coal and biomass in an iGCC Power Plant: gasifier modeling. International Journal of Thermodynamics, vol. 7, no. 4. pp. 165-172. [ Links ]
Van Heek, K.H. and Hodek, W. 1994. Structure and pyrolysis behaviour of different coals and relevent model substances. Fuel, vol. 73, no. 6. pp. 886-896. [ Links ]
Worasuwannarak, N., Sonobe, T., and Tanthapanichakoon, W. 2007. Pyrolysis behaviors of rice straw, rice husk, and corncob by TG-MS technique. Journal of Analytical and Applied Pyrolysis, vol. 78, no. 2. pp. 265-271. [ Links ]
Yang, H., Yan, R., Chen, H., Lee, D.H., and Zheng, C. 2007. Characteristics of hemicellulose, cellulose and lignin pyrolysis. Fuel, vol. 86, no. 12. pp. 1781-1788. [ Links ]
Paper received Oct. 2014
Revised paper received Feb. 2015

