


Services on Demand
Article
 English (pdf)
 Article in xml format
 Article references
Indicators

Related links
-
 Cited by Google
 -
 Similars in Google
Share

 Permalink
Journal of the Southern African Institute of Mining and Metallurgy
On-line version ISSN 2411-9717
Print version ISSN 2225-6253
J. S. Afr. Inst. Min. Metall. vol.115 n.7 Johannesburg Jul. 2015
http://dx.doi.org/10.17159/2411-9717/2015/V115N7A9
GENERAL PAPERS AND TECHNICAL NOTE
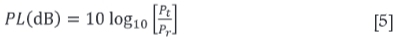
Radio frequency propagation model and fading of wireless signal at 2.4 GHz in an underground coal mine
A. Patri; D. S. Nimaje
Department of Mining Engineering, National Institute of Technology Rourkela, India
SYNOPSIS
Wireless sensor networks and wireless communication systems have become indispensable in underground mines. Wireless sensor networks are being used for better real-time data acquisition from ground monitoring devices, gas sensors, and mining equipment, whereas wireless communication systems are needed for locating and communicating with workers. Conventional methods like wireline communication have proved to be ineffective in the event of mine hazards such as roof falls, fires etc. Before implementation of any wireless system, the variable path loss indices for different workplaces should be determined. This helps in better signal reception and sensor node localization, and also improves the method by which miners carrying the wireless devices are tracked. This paper proposes a novel method for determining the parameters of a suitable radio propagation model, which is illustrated with the results of a practical experiment carried out in an underground coal mine in southern India. The path loss indices, along with other essential parameters for accurate localization, have been determined using the XBee modules and ZigBee protocol at 2.4 GHz frequency.
Keywords: WSN, RSSI, path loss index, miner localization, underground coal mining, ZigBee
Introduction
Advancements in the mining industry in the last three decades have primarily focused on improvements in heavy machinery, support systems, and safety equipment. Recently the focus has shifted towards development of communication systems for better safety and connectivity. In this context, the wireless sensor network (WSN) technology, owing to its efficiency, speed, and applicability in emergency conditions, has come out on top (Fiscor, 2011; Liu, 1996; Patri, Nayak, and Jayanthu, 2013). The current need is for a reliable wireless system in the harsh underground mine environment (Bandyopadhyay et al., 2009), in which radio propagation models are playing a vital role.
Recent studies have considered the underground mine as a hybrid case of regular and harsh environments and shown that the signal propagation models and critical parameters of wireless channel propagation for an indoor environment are similar to an underground mine scenario at 900 MHz, indicating that the wireless nodes used in the indoor environment can be modified for use in mines (Qaraqea et al., 2013; Murphy et al., 2008). Zhang et al. (2001) experimented at 900 MHz with two different scenarios, namely the gateroad and working face of a longwall coal mine, in order to evaluate the additional losses due to gateroad curvature and the presence of mining equipment, and subsequently modified the wave guide propagation model. The hybrid tunnel propagation model developed by Zhang et al. uses both a free space propagation model and a modified waveguide propagation model to describe the propagation characteristics. Some simulation tools have also been developed for path loss calculation and propagation modelling by taking into account the effects of barriers. The simulations were carried out by varying the frequency with standard tunnel dimension, shape, and material properties. Comparison with an actual scenario proved that the path loss is mostly dependent on tunnel dimension, and signal frequency (Hrovat, Kandus, and Javornik, 2012).
With advances in micro-electro mechanical systems (MEMS), transceivers working at 2.4GHz are now available at a reasonable price (Wurneke and Pister, 2002). The better performance of such transceivers in localization within a small range is due to highly directional antennae and a very high operational frequency, resulting in less noise. Liu et al. (2009) studied the transmission performance of WSN near a mine working face at 2.4 GHz frequency, incorporating all the electromagnetic properties in their theoretical model and comparing it with experimental results. The effective transmission distance was studied for IEEE 802.15.4, known as the ZigBee protocol (Liu et al., 2009; IEEE Std 802.15.4. 2011).
In this paper, the radio frequency (RF) propagation model has been developed and the path loss of wireless signal at 2.4 GHz was experimentally derived for the GDK 10A incline, a longwall underground mine of Singareni Collieries Company Limited (SCCL). Before implementing WSN, the path loss index and other parameters should be calculated to perform better localization, base-station placement and optimization, improve receiver design, and combat the fading of signal (Iskander and Yun, 2002). The reception distance was determined by utilizing the path loss of the signal, which determines the energy loss factor. The repeaters should be placed accordingly and their amplification factors should be set to different values to achieve a high-efficiency wireless communication system for different environments. The performance of ZigBee protocol using the XBee modules was experimentally studied for the mine.
Radio frequency propagation models
A wireless propagation model can be defined as a mathematical expression or an algorithm for predicting the radio characteristics of a particular type of environment. There are two types of wireless propagation model: deterministic models and empirical models (Iskander and Yun, 2002; Rappaport, 2002). The deterministic model does not fit into the real environment properly; however, for low-frequency waves, the results produced by the deterministic model are approximately equal to the actual result, with a very low rounding error. Since the operating range is much less, elements present in the surroundings have a significant effect on propagation in the high-frequency channel while variations due to environmental effects are largely insignificant in the low-frequency channel. The aforementioned propagation models are again subcategorized into three types, i.e. free space propagation models, two-ray ground models, and lognormal models. These models are deterministic with the exception of the lognormal model, which is empirical.
Free space propagation model
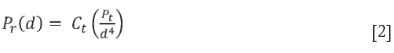
The free space propagation model is a simplified model that assumes line-of-sight communication between the transmitter-receiver pair and that there is no intervening obstruction. The mathematical representation of the model can be written as

where, Pr and Pt represent the power received and power transmitted respectively, CT is a constant that depends on the transceiver, and d is the distance between the transmitter-receiver pair.
Two-ray ground model
This model is obtained by modifying the free space propagation model after taking into account the effect of reflection of signals. It is also assumed that both the direct and the reflected ray are used for communication. In this model the distance between the transmitter-receiver pair is much greater than their individual heights, and it can be represented as
where, Ct is the constant representing transceiver characteristic in the two-ray ground model.
Log-distance model
The log-distance model is an analytical and empirical model which can be mathematically represented as
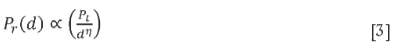
where, η represents the path loss factor or distance power gradient.
The actual results vary from the results derived using the log-distance model. Hence, for hostile environments like underground mines, models have to be developed by using shadow-fading phenomena.
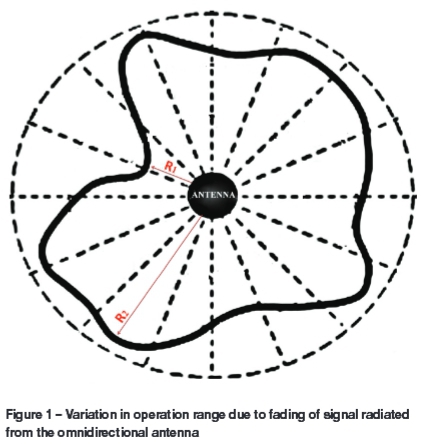
At high frequencies, power loss is different for different locations owing to obstructions in the path between two communicating devices. Figure 1 shows a typical example of this phenomenon, where the dotted circle shows the ideal boundary of operation for an omnidirectional antenna placed at the centre, and the bold line shows the actual boundary of operation with a minimum and maximum range of R1 and R2 respectively due to presence of various obstructions. For this purpose, the empirical model is chosen over the deterministic model to predict or calculate power received at a particular distance from the transmitter (Pahlavan and Levesque, 2005).
Moreover, the power loss can be subdivided into two parts on the basis of fluctuation around the average path loss, i.e. multi-path fading and shadow fading. In case of multi-path fading, the transmitted signal reaches the receiver through two or more paths, causing both constructive and destructive interferences near the receiver which in turn leads to phase shifting and addition of noise. Therefore in a dynamic environment, where both the transmitter and receiver are stationary, the received signal strength (RSS value) varies randomly due to the movement of objects and small changes in the environment. The long-term average of RSS values represents the effect of shadow fading of signal that is caused by the presence of a constant barrier between the transceivers (Pahlavan and Levesque, 2005).
Although time of arrival (TOA), angle of arrival (AOA), and time difference of arrival (TDOA) provide higher accuracy in most cases, they fail in a harsh mining environment (Gentile et al., 2013; Sahoo and Hwang, 2011). Therefore, the received signal strength index (RSSI)-based model for localization has been developed. This low-cost RSSI-based localization provides less communication overhead with lower complexity of implementation. The distance or range of the signal can be calculated accordingly by the loss factor of the environment from the RSSI-based equations [4] and [7].
Shadow-fading model and proposed scheme for parameter determination
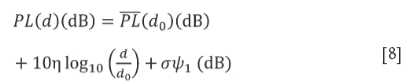
The log-distance model can be represented more accurately by introducing a Gaussian distribution variable to represent the fading or fluctuation of received signal strength. The modified model is called the lognormal shadowing model and it is most appropriate for wireless sensor networks since it is all-inclusive in nature and can be easily configured according to the target environment (Nafarieh and Ilow, 2008). The mathematical equation for the above relation can be defined as
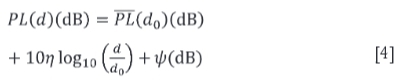
where,
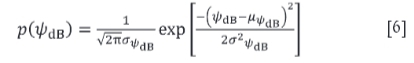
and d0 is the near-earth reference distance. The random variable ψ is the zero-mean Gaussian random noise, the probability distribution function of which is given by
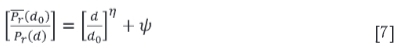
The value of η depends on the surrounding or propagation environment as per Equation [4]. The distance d0 is taken to be one metre for simplicity of calculation, and it can also be represented in the terms of received power or RSSI as
In Equation [4], there are two unknown terms, η and ψ, which should be determined experimentally. The linear regression analysis for the data-set with distance and received power as attributes gives the η value, which can be further used for that particular place with unknown distance and known received power to localize a wireless node.
In Equation [4], Var (ψ) = σ2 and E(ψ) = 0. Therefore, it can be mathematically proven that Var (σψ1) = σ2 and E (σψ1) = 0. This relationship shows that the ψ function has the same distribution as ψ1, where ψ1 represents the zero-mean Gaussian distribution with unit variance. Equation [4] can be modified as
Assuming maximum error with 95% confidence interval, the σψ1 value can be replaced by 1.96 σ, which gives
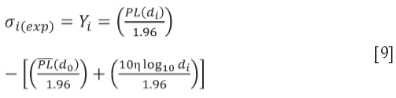
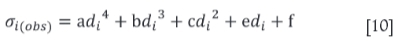
However, observational analysis shows that the standard deviation varies as a function of distance, and on the basis of considerable experimental evidence, we claim it to be a fourth-degree polynomial function:
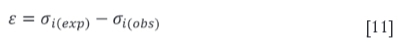
Now the observational error ε can be defined as the difference of these two terms, i.e. experimental and observational σ.
In order to avoid negative error and for solving this expression, the objective function Ε can be written as
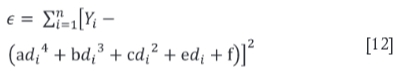
To obtain the values of the coefficients of the polynomial, i.e. a, b, c, e, and f, a partial derivative method is adopted, and it can be mathematically represented as the following set of equations:
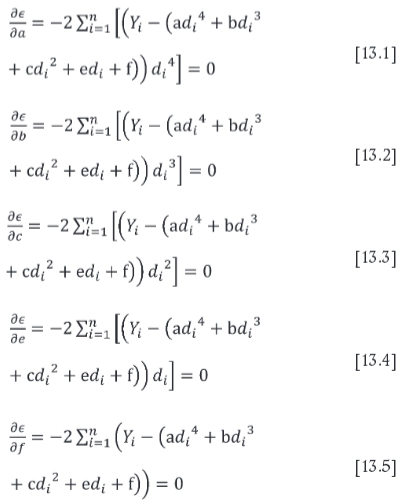
The above set of equations can be solved in matrix form, to obtain the coefficients
If the coefficients and path loss index for a particular place are known, the standard deviation and the power loss due to fading can be calculated for the new set of data with known RSSI and unknown distance, for accurate localization.
Mining conditions at GDK 10A mine
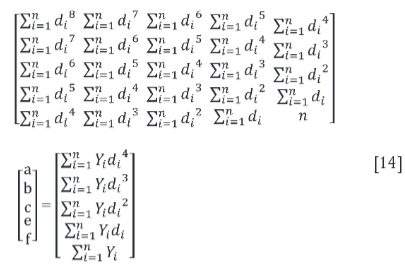
The GDK 10A incline of SCCL is situated at Ramagundam in Telengana, India, in the Godavari valley coalfield. Figure 2 shows a schematic layout of a longwall mine. The minimum and maximum depths of Seam 1, where the experiments were carried out, are 175 m and 310 m respectively, and the seam thickness is 6.5 m.
The surface area is flat with undulating terrain having a gentle slope towards northeast and south. The coal seam is accessed via two tunnels, with lengths of 450 m and 500 m at a gradient of 1 in 4.5 and 1 in 5, for haulage and manway respectively. The mine floor is mainly grey sandstone and the roof is coal with a 0.30 m clay band.
The length and width of the longwall face are around 150 m and 1 km respectively, with an average depth of 350 m from surface. Coal cutting is by means of an Anderson double-ended ranging drum shearer with a diameter of 1.83 m and a web width of 0.85 m. Caterpillar independent front suspension-based hydraulic powered roof supports are provided with 101 PMC-R controlled hydraulic chocks. Anderson bridge-type stage loaders are used in the gateroad to transport the coal from the armoured face conveyor (AFC) to the belt conveyor. The 260 m long DBT-manufactured AFC is used in the face, with a pan size of 232 x 844 x 1500 mm and deck plate thickness of 35 mm at an average chain speed of 1 m s-1.
The head and tail gateroads are driven in parallel through Seam 1. The gateroad wall surface is rough and water percolates from the strata and the gateroads. The gateroad bearing the belt conveyor system has an average height and width of 3.6 and 4.2 m respectively. The conveyor belt, supported by a steel structure, is at a height of 1.32 m to 1.4 m from the floor and carries an average lump size of 200 x 200 x 200 mm. The belt has a width of 0.8 m to 1.2 m, and is made mainly of rubber. The roof supports are generally wire mesh type with bolts and girders. The material properties, dimensions, and other features of the equipment described have a major influence on signal propagation, together with mine dimension, rock properties, slope, and other geo-mining conditions.
Experimental set-up and procedure
Instruments and set-up
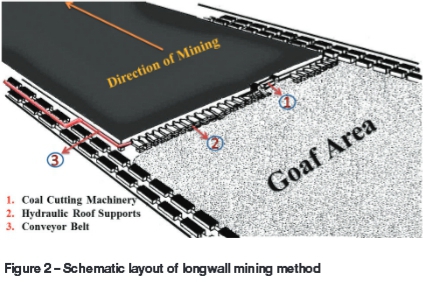
A pair of XBee series-1 modules, one being used as a transmitter and the other as a receiver, which implement the ZigBee protocol, each capable of transmission or reception, were used for wireless communication at 2.4 GHz. The specifications of the XBee module are given in Table I. Each of the XBee modules is configured by setting the preferred data rate, modulation technique, lapse rate between packets, and other parameters using X-CTU software by mounting the modules on the XBee USB adapter (which has an onboard 3.3 V low-drop voltage regulator and light-emitting diode (LED) indicators for RSSI, associate, and power), and then connecting to a computer's universal serial bus (USB) port through a FT232 USB-to-serial converter. There are two modes of operation for the XBee module; in transparent data mode (AT) the signal coming to the Data IN (DIN) pin is sent directly to the receivers, while in application programming interface mode (API) (which was used in this study), the data is sent in the form of packets that include the receiver address along with a feedback for the delivered packets, payload information, and various parameter settings to increase the reliability of the network and to send the signal safely over the wireless network (Hebel, Bricker, and Harris, 2010). The module has a mounted rubber-duck wire antenna or whip antenna, which radiates in a nearly omnidirectional pattern. As there is very little distortion in radiation pattern, the antenna is considered to radiate equal power in all azimuthal directions (Bandyopadhyay, Chaulia, and Mishra, 2010).
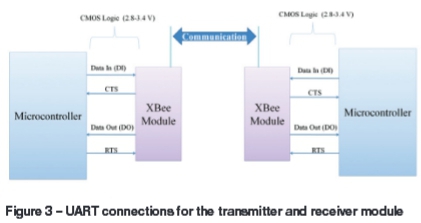
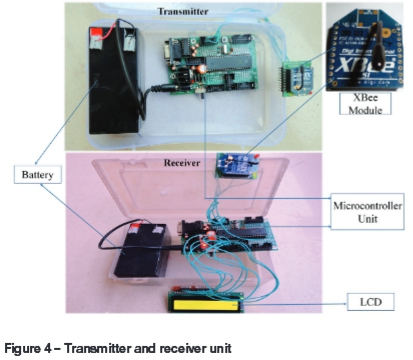
This module also supports universal asynchronous receiver/transmitter (UART) interface, which is beneficial for clock-setting and connecting it to a microcontroller. The ATMEL Atmega-32 microcontroller (14.7456 MHz crystal) development board was used, which has a compatible UART serial communication integrated circuit together with electrically erasable programmable read-only memory (EEPROM), static random access memory (SRAM), and an in-system self-programmable flash memory of 1024, 2k, and 32k bytes respectively. It has an inbuilt reverse polarity protection and the 7805 voltage regulator has a heat sink for continuous dissipation to supply 1 A current constantly without overheating. The Request to Send (RTS) and Clear to Send (CTS) module pins can be used to provide flow control. CTS flow control provides an indication to the host to stop sending serial data to the module. RTS flow control allows the host to signal the module not to send data in the serial-transmit buffer through the UART. Data in the serial-transmit buffer will not be sent out through the Data OUT (DOUT) pin as long as RTS is de-asserted or set high. The UART connections for the transmitter and receiver module are shown in Figure 3. The module operates in a low-voltage range of 2.8-3.4 V, but for the whole set-up, a pair of 12 V 1.3 A.h DC batteries of lead-acid type was used, one for each node. This battery can be replaced by a cap-lamp battery used in underground mines in compliance with Directorate General of Mine Safety India (DGMS) standard. A liquid crystal display (LCD) is programmed and connected to the microcontroller unit at the receiver to display the desired output. The transmitter and receiver units are shown in Figure 4.
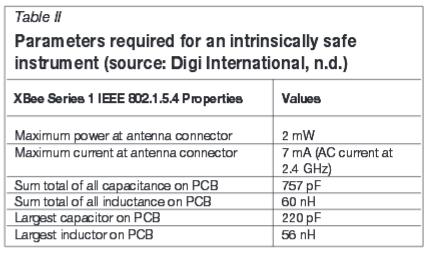
For use in underground mines, the electronic instrument must be intrinsically safe to avoid any fire hazard. Since ZigBee protocol-based wireless modules have been used in underground mines worldwide, they can be considered as intrinsically safe for most of the underground mining scenarios in India (Bandyopadhyay, Chaulia, and Mishra, 2010; Chen, Shen, and Zhou, 2009). Parameters required for the XBee module to be intrinsically safe are specified in Table II. The ZigBee protocol is based on the carrier sense multiple access (CSMA) with collision avoidance (CA) channel access to provide energy saving, latency, and negligible error in the received data packet. Direct sequence spread spectrum (DSSS) modulation is used in the PHY layer, which has high resistance to noise or jamming. The ZigBee standard supports star, tree, and mesh networks, thus permitting numerous applications. In sleep mode it uses only 0.1 which helps in energy saving during idle periods. It supports AES-128 encryption that converts a 128-bit plain text to a 128-bit cipher text. It has a capacity to acquire more than 256 peer-to-peer connections in a master-slave configuration; which is very high compared to other wireless protocols used in day-to-day life.
The experiment was divided into two parts, namely an RSSI test and a range test. The RSSI test provides the data for determining path loss index and various parameters affecting the localization and fading of power, and the range test gives the operation range of the module in different underground mine scenarios.
RSSI test
The first set of readings was taken at the longwall face with shearer, hydraulic power supports, AFC, stage loader, and other machinery which obstructed the wireless signal. To avoid fast fading of the signal, the readings were taken in a static environment free from moving machinery or men between the transmitter-receiver pair. A second set of readings was taken beside the belt conveyor system, in running condition, installed in the gateroad, which would have created some fast fading.
Range test
The range test was conducted in three different places - near the longwall face, the belt conveyor system, and in the inclined mine car pathway.
Experimental procedure
Firstly, an RSSI test was performed and readings were taken by fixing the transmitter node at the beginning of thelongwall face close to the hydraulic powered roof support at a height of 1.5 m from the floor. The transmitter and receiver set-ups were kept at a distance of 1 m and 2 m from the chocks and the working face respectively. The transmitter node was programmed to send 100 packets with a delay interval of 500 ms between two subsequent packets, and LCD showed the average RSSI over these 100 packets. Twenty RSSI readings were taken at each position of the receiver node and the same procedure was repeated up to a distance of 20 m with a 1 m step size. The packet received rate (PRR) was also calculated and displayed on the LCD at distance intervals of 1 m, and all the readings were taken in line-of-sight conditions. The second set of readings was taken on the gateroad near the belt conveyor system. The transmitter node was fixed at a location exactly 1 m above the floor, 0.5 m from the belt conveyor, and the receiver node was kept at varying distances (1-20 m) from the transmitter node along the passage.
The range test for the XBee module was then carried out sequentially in all the three areas by fixing the transmitter node at a particular location and moving the receiver node away until the LCD showed a 'zero' value for the RSSI and indicated that the packet sent by the transmitter could not be received beyond that particular distance.
Results and analysis
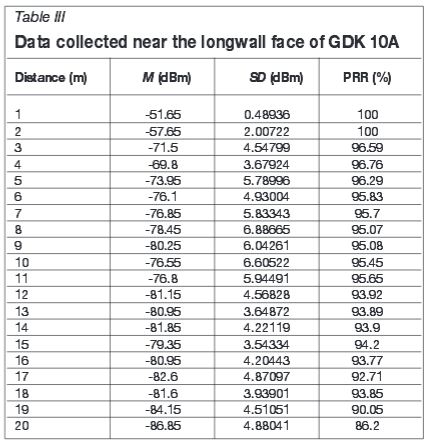
The data collected near the working face and the belt conveyor gateroad is represented in Tables III and IV respectively. The standard deviation was calculated for each set of RSSI values on every location.
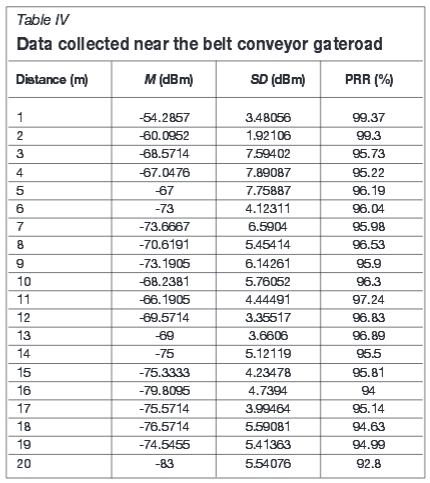
The standard deviation (SD) can be calculated as
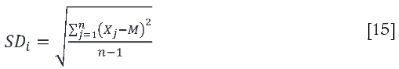
where, SDi is same as Yi in Equation [9] for a particular distance di , Xjrepresents the different RSSI values recorded at each distance di, M is the mean RSSI, and n is the total number of observations (i.e. 20). The integer variables i and j both vary from 1 to 20.
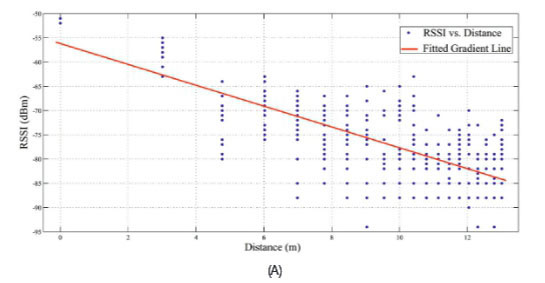
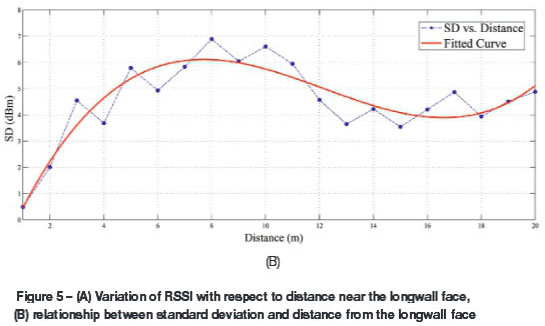
MATLAB version 7.6.0.324 r2008a was used for the linear regression analysis model. The slope of the fitted gradient line denotes the path loss index for the place of the experiment, for longwall working face the value was found to be 2.14. Figure 5 (A) depicts the scatter plot of the received signal for the longwall face corresponding to the logarithmic distance. The higher value of path loss index indicates that fading of the signal was due to the presence of more obstructions than in the normal outdoor scenario. Moreover, it also implies that more repeaters should be placed and the internode distance should be kept small compared to typical outdoor scenario (for which the index is 2). More fading and gradual degradation of power transmitted was due to the presence of metallic bodies; homogenous obstructions present in the surroundings and the static nature of the environment resulted in less standard deviation (more concentrated in the region of 3.5 to 6) from the mean RSSI values. The values of PRR show a dependency on both standard deviation and received power, with a higher correlation with the former. The signal is marginally affected by the waveguide property of the tunnel for the first 3-4 m, after which the effect increases gradually. A trade-off is observed between distance covered and the wave guide effect, leading to a fluctuation of RSSI over a small range. As discussed previously, the curve fitting was done to find a relationship between the standard deviation and distance to determine the coefficients for the longwall mining area as shown in Figure 5 (B). The coefficients a, b, c, e, and f of the fourth-degree polynomial are found to be 2.626 x 10⁻⁶, 6.176 x 10⁻³, -0.2276, 2.403, and -1.721 respectively. R2 and root mean square error (RMSE) were 0.8332 and 0.6958 respectively.
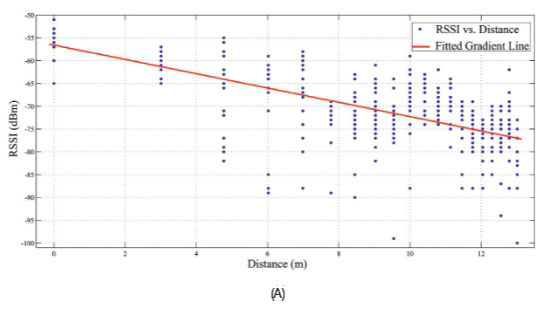
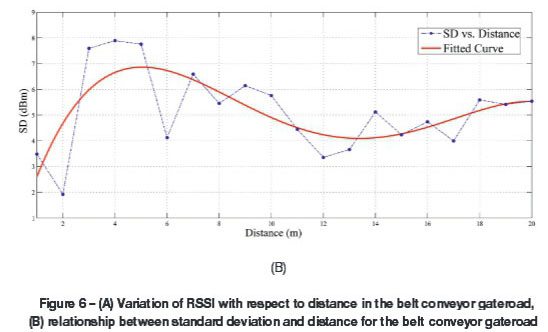
For the belt conveyor gateroad, the path loss index was found to be 1.568, using linear regression analysis. Figure 6 (A) depicts the scatter plot of RSSI vs. the logarithmic distance. The lower value of power loss compared to the longwall face was due to the predominant effect of the waveguide property of the tunnel. The standard deviations (more concentrated in the region of 4-7.5 m) from the mean RSSI values were high compared to the longwall face area due to inhomogeneous surroundings like different support systems, material, and spacing, machinery, variable coal lump size carried by the belt, and other distributive obstructions. Due to movement of the belt conveyor carrying coal lumps of various sizes, some fast fading was observed, as indicated by the dispersal of data from the fitted line. The signal loss for a particular place was found to be greater than its consecutive place readings, each taken at 1 m distance, due to presence of girders over the receiver. The presence of fewer metallic bodies in the gateroad compared to the longwall face reduced the fading effects. The signal propagation was mildly affected by the steel structure because the nodes were located higher than the belt conveyor support structure. Figure 6 (B) depicts the curve fitting for the fourth-degree polynomial. The coefficients for determining the standard deviation as a function of distance were found to be -6.685 x 10⁻⁴, 0.3418 x 10⁻¹, -0.5813, 3.599 and -0.4563 for a, b, c, e, and f respectively. The R2 value of 0.474 and RMSE value of 1.281 indicate the fluctuation of standard deviation due to fast fading.
From the range test, it was found that the XBee module provides satisfactory results up to a range of 40-45 m, 60-65 m, and 75-85 m for the longwall face, belt conveyor gateroad, and mine car pathway respectively.
Conclusion
This study reveals that the efficiency of an underground mine communication system is dependent on the environment. Before implementing any wireless system in underground mines, the path loss index and the variance of Gaussian distribution representing the shadow fading effect should be determined. This helps in determining the distance at which repeaters should be placed in order to enhance the signal and localize the sensor node from its received signal strength. With an increasing number of physical obstructions, the path loss index increases, resulting in the total loss of signal beyond a particular range. The XBee module facilitates satisfactory wireless communication over an adequate range of operation with a negligible packet error rate. The PRR depends upon transmitter distance and dynamic behaviour of the surroundings. These intrinsically safe modules are economic, energy-efficient, and enhance the mine safety system by facilitating tracking of miners and real-time data acquisition from sensors. The experiment was carried out in a hazard-prone underground coal mine. The experimental results may vary for underground mines other than coal mines, due to the variation in the rock mass properties and dimensions of tunnels, passages, galleries, and working areas, depending on the mining method. In our current work, two nodes were used for experimentation. To ensure the viability of the ZigBee protocol, further studies could be carried out to analyse the network performance using more than two nodes.
Acknowledgement
We wish to express our sincere gratitude to the authorities of SCCL for permission and assistance in carrying out the experiment and collect valuable data at GDK 10A. We thank the anonymous reviewers for their valuable comments.
References
Bandyopadhyay, L.K., Chaulia, S.K., and Mishra, P.K. 2010. Wireless Communication in Underground Mines. Springer Science. [ Links ]
Bandyopadhyay, L.K., Chaulia, S.K., Mishra, P.K., Choure, A., and Baveja, B.M. 2009. A wireless information and safety system for mines. Journal of Industrial and Scientific Research, vol. 68, no. 2. pp. 107-117. [ Links ]
Chen, G., Shen, C., and Zhou, L. 2009. Design and performance analysis of wireless sensor network location node system for underground mine. Journal of Mining Science and Technology, vol. 19, no. 6. pp. 813-818. [ Links ]
Digi International. Not dated. Intrinsically Safety Certifications. http://www.digi.com/support/kbase/kbaseresultdetl?id=2128 [Accessed January 2014]. [ Links ]
Fiscor, S. 2011. Miners quickly adopt new communication systems. Coal Age, January 2011. pp. 2-6. [ Links ]
Gentile, C., Alsindi, N., Raulefs, R., and Teolis, C. 2013. Geolocation Techniques: Principles and Applications. Springer Science. [ Links ]
Hebel, M., Bricker, G., and Harris, D. 2010. Getting Started with XBee RF Modules Version 1.0. (Parallax Inc. [ Links ]).
Hrovat, A., Kandus, G., and Javornik, T. 2012. Path loss analyses in tunnels and underground corridors. International Journal of Communication, vol. 6, no. 3. pp. 136-144. [ Links ]
IEEE Std 802.15.4. 2011. IEEE Standard for Local and Metropolitan Area Networks. Part 15.4: Low-Rate Wireless Personal Area Networks (LR- WPANs). [ Links ]
Iskander, M.F. and Yun, Z. 2002. Propagation prediction models for wireless communication systems. IEEE Transactions on Microwave Theory and Techniques, vol. 50, no. 3. pp. 662-673. [ Links ]
Liu, S.Y. 1996. Advances in longwall coal mining techniques. Seminar on High Productivity and High Efficiency Coal Mining Technology, Beijing. [ Links ]
Liu, X., Wang, M., Wen, J., and Zhao, Z. 2009. Transmission performance of 2.4 GHz wireless sensor nodes when used in a working-face environment. Journal of Mining Science and Technology, vol. 19, no. 2. pp. 185-188. [ Links ]
Murphy, R.R., Shoureshi, R., Arnold, H.W., Arslan, H., Burke. J., Greenstein, L.J., Killinger, D.K., Lundgren, C.W., Rustako, A.J., and Stover, S. 2008. Analysis of Viability and Feasibility of Current and Emerging Mining Communication and Mine Rescue Technologies. Final Report, Institute for Safety, Security, Rescue Technology, University of South Florida, Tampa, FL, USA. [ Links ]
Nafarieh, A. and Ilow, J. 2008. A testbed for localizing wireless LAN devices using received signal strength. Proceedings of the 6th Annual Communication Networks and Services Research Conference, Halifax, Canada, May 2008. pp. 681-687. [ Links ]
Pahlavan, K. and Levesque, A.H. 2005. Wireless Information Network. 2nd edn. Wiley-Interscience. [ Links ]
Patri, A., Nayak, A., and Jayanthu, S.J. 2013. Wireless communication systems for underground mines - a critical appraisal. International Journal of Engineering Trends and Technology, vol. 4, no. 7. pp. 3149-3153. [ Links ]
Qaraqea, K.A., Yarkanb, S., Güzelgõzc, S., and Arslan, H. 2013. Statistical wireless channel propagation characteristics in underground mines at 900 MHz: a comparative analysis with indoor channels. Journal of Ad Hoc Networks, vol. 11, no. 4. pp. 1472-1483. [ Links ]
Rappaport, T.S. 2002. Wireless Communications: Principles and Practice. 2nd edn. Prentice Hall. [ Links ]
Sahoo, P.K. and Hwang, I. 2011. Collaborative localization algorithms for wireless sensor networks with reduced localization error. Sensors, vol. 11, no. 10. pp. 9989-10009. [ Links ]
Wurneke, B.A. and Pister, K.S.J. 2002. MEMS for distributed wireless sensor networks. Proceedings of the 9th International Conference on Electronics, Circuits and System, Dubrovnik, Croatia, September 2002. pp. 291-294. [ Links ]
Zhang, Y.P., Zheng, G.X., and Sheng, J.H. 2001. Radio propagation at 900 MHz in underground coal mines. IEEE Transactions on Antennas and Propagation, vol. 49, no. 5. pp. 757-762. [ Links ]
Received Feb. 2014
Revised paper received Mar. 2015

