


Serviços Personalizados
Artigo
 Inglês (pdf)
 Artigo em XML
 Referências do artigo
Indicadores

Links relacionados
-
 Citado por Google
 -
 Similares em Google
Compartilhar

 Permalink
Journal of the Southern African Institute of Mining and Metallurgy
versão On-line ISSN 2411-9717
versão impressa ISSN 2225-6253
J. S. Afr. Inst. Min. Metall. vol.115 no.7 Johannesburg Jul. 2015
http://dx.doi.org/10.17159/2411-9717/2015/V115N7A3
IFSA CONFERENCE PAPERS
Feasibility study of electricity generation from discard coal
B. North; A. Engelbrecht; B. Oboirien
CSIR Materials Science and Manufacturing (Energy Materials), Pretoria, South Africa
SYNOPSIS
There is large electricity generation potential in discard coal, both in stockpiles and current arisings. Power stations with a combined capacity of up to 18 GW electrical (GWe) could be fuelled by discard coal. Modern circulating fluidized bed combustion (CFBC) boilers, with capital costs comparable to equivalent pulverized fuel (PF) boilers, are capable of utilizing discard coal at a high efficiency while reducing sulphur dioxide (SO2) emissions though the use of limestone sorbent for 'in-situ' capture.
A detailed economic assessment of the feasibility of electricity generation from discard coal, comprising material and energy balances and the construction of a discounted cash flow (DCF) table, shows that it is also potentially attractive from an economic perspective. A base case analysis shows positive net present values (NPVs) and an internal rate of return (IRR) of 21.4%. Sensitivity analyses on critical parameters show that the economic viability is heavily dependent on parameters such as coal cost and the value of electricity. The project becomes unattractive above a coal price of approximately R300 per ton and at an electricity value below approximately 59c per kilowatt-hour (kWh).
Site- and project-specific information such as the delivered cost of coal, location and efficacy of sorbents, and effective value of the electricity produced can be used as input to the economic analysis to evaluate siting options and sorbent source options for such a power station.
Keywords: fluidized bed, discard coal, electricity generation, techno-economics, sulphur capture
Introduction
South Africa has large resources of coal. Prévost (2010) reported that South Africa has coal reserves of 33 000 Mt. Annual production is 250 Mt, over 70% of which is utilized in the domestic market, mostly for electricity and synthetic fuels production. Annual exports total 61 Mt, which generates a large foreign income stream for South Africa. However, the export market demands coal of a high quality. For many producers to meet this quality (and indeed, to meet quality requirements for domestic use), often the coal must be benefi-ciated to reduce the ash content and increase the calorific value (CV). This results in the generation of waste coal. This waste coal can be categorized into three main streams -discards, duff, and slurries.
Discards are the high-ash fraction coal. These often also contain relatively high levels of sulphur. Discards have been reported to have a CV in the range of 11 to 15 MJ/kg (Pinheiro, Pretorius, and Boshoff, 1999; Du Preez, 2001) The amount of discard coal currently stockpiled on the surface is estimated at 1500 Mt, and the amount of discard coal generated in 2009 was reported to be approximately 67 Mt (Prévost, 2010). This discarded coal represents both a loss of potentially usable energy and an environmental threat due to occasional spontaneous combustion of the heaps. Stockpiles of discard coal can also become a source of acid rock drainage (ARD).
High-ash discard coal cannot be utilized in pulverized fuel (PF) boilers, but can be successfully utilized in circulating fluidized bed combustion (CFBC) boilers. Although CFBC technology has lagged behind PF technology in terms of steam conditions, with the commissioning of supercritical CFBC boilers this 'disadvantage' for CFBC has largely been overcome (Utt and Giglio, 2011). Additionally, capital costs for the two technologies have converged, making CFBC cost-competitive with PF (Utt and Giglio, 2011; Aziz and Dittus, 2011; Haripersad, 2010).
The South African Department of Energy has released a call for 2500 MW of coal-fired base load electricity to assist in addressing the current electricity supply deficit in the country (South African Department of Energy, n.d.).
It is against this background that an assessment was made of the economic merit of generating electricity from discard coal in a CFBC power station.
Potential value of discard coal
As a form of screening exercise, the value of discard coal, in terms of the amount of electricity that could be generated from it, was assessed. This was carried out on both the existing stockpiles of discards and the current arisings.
Electricity generation from stockpiled discard coal
Table I shows the amount of electricity that could be generated from existing discard stockpiles. It was assumed that the discards would be utilized over a 40-year period (the assumed lifetime of a power station).
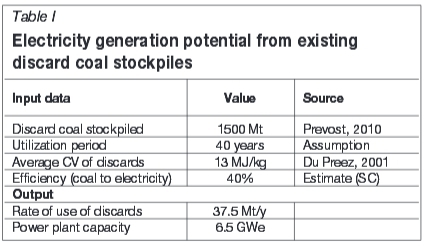
This shows that a significant amount of electricity (6.5 GWe of installed capacity, or approximately 16% of South Africa's current generating capacity) could potentially be generated from existing discard coal stockpiles throughout the 40-year lifetime of the power station.
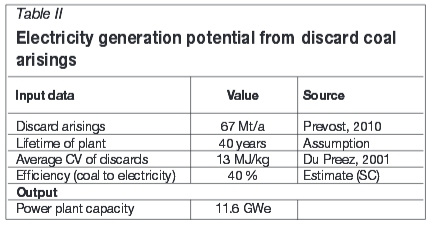
Electricity generation from discard coal arisings
Based on estimates of the amount of discard coal generated on an annual basis, a similar exercise to the above was undertaken to estimate how much electricity could potentially be generated from this source. The results are shown in Table II. A power station with a capacity in excess of 11 GWe could be fuelled by the discard coal arisings.
The total amount of electricity that could be generated from existing stockpiles and arisings, in terms of installed capacity and generation per year (in gigawatt-hours per year), is shown in Table III.
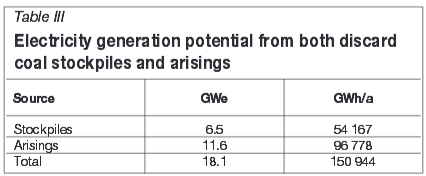
It is clear that a significant amount of electricity could potentially be generated from existing stockpiles and current arisings of discard coal. But, would this be an economically viable undertaking? An economic analysis was undertaken to determine the economic indicators of an FBC power station.
Economic analysis of a discard coal-fired FBC power station
A case study of a 450 MWe station was considered. This is in line with the size of FBC power stations envisaged in the South African Integrated Resource Plan (South African Department of Energy, 2010a) and plants being considered by industry (Hall, Eslait, and Den Hoed, 2011), and is within the proven capacity of efficient, supercritical FBC plants (Utt and Giglio, 2011).
The analysis was undertaken in two components, both of which utilized Excel® spreadsheets. The first is essentially a material and energy balance, in which fuel and sorbent requirements are calculated using input data such as plant size, plant efficiency, fuel CV, calcium to sulphur (Ca/S) ratios etc. Additionally, in this component, operating costs, fuel and sorbent transport costs, and revenue (from the sale of electricity) are calculated.
The figures calculated in the first component are then used to construct the second component, a discounted cash flow (DCF) analysis. This is used to run sensitivity analyses and to calculate economic indicators such as the net present value (NPV) and the internal rate of return (IRR). The IRR is the discount rate at which a zero NPV is seen, and is essentially a measure, as its name would suggest, of the return that could be made on the investment. Most companies have a 'hurdle rate', and will not consider projects returning an IRR that falls below this. The IRRs (and NPVs) of various projects are also often compared to select the optimal investment out of many possible investments.
Definitions of, and example calculations of, DCF, IRR, and NPV can be found in any standard economics or finance book, e.g. Correia et al. (1989).
A list of input parameters, with a discussion and references (if available) follows. These values are used as a base case, and different scenarios are evaluated and sensitivity analyses presented.
Assumptions and input to economic analysis
Plant size: 450 MWe
This is in line with the size of FBC power stations envisaged in the South African Integrated Resource Plan (South African Department of Energy, 2010a) and plants being considered by industry (Hall, Eslait, and Den Hoed, 2011), and is within the proven capacity of efficient, supercritical FBC plants (Utt and Giglio, 2011).
Plant efficiency: 40%
Utt and Giglio (2011) assumed 40% efficiency for a supercritical CFB. In a prior publication, Utt, Hotta, and Goidich, (2009) reported an efficiency of 41.6% for the Lagisza power station. Jantti (2011) later reported that an efficiency of 43.3% was being achieved at tagisza; however, it appears that this may have been calculated on the lower heating value (LHV) (or net calorific value, NCV) rather than the higher heating value (HHV) (or gross calorific value, GCV). It was decided therefore, keeping in mind the low-quality discard coal that would be utilized, to assume the relatively conservative figure of 40%.
Capacity factor: 85%
This is the electricity that is actually produced in a year as a percentage of the electricity that could be produced. It takes into account load-following and planned and unscheduled maintenance. The US Electrical Power Research Institute (EPRI) assumed 85% in a study undertaken as input to the South African IRP, and this was adopted in the current analysis (South African Department of Energy, 2010b).
Fuel calorific value: 13 MJ/kg
This is drawn from studies undertaken to assess the inventory of duff and discard coal (Pinheiro, Pretorius, and Boshoff, 1999; Du Preez, 2001).
Fuel ash content: 45%
Discard coal in both dumps and current arisings has a wide range of ash contents (Pinheiro, Pretorius, and Boshoff, 1999; Du Preez, 2001). A figure of 45% was used, This is in good agreement with figures quoted by Hall, Eslait, and Den Hoed (2011), and is similar to the ash content of the Greenside discards tested by the CSIR in the National Fluidized Bed Combustion Boiler (NFBC) project (Eleftheriades and North, 1987). (Note, this was a bubbling FBC.) The economic calculations are not, however, very sensitive to the coal ash content, as for the purposes of this analysis the coal requirements are calculated from the calorific value of the coal rather than the ash content.
Sulphur content: 2.77%
Again, there is a wide range of sulphur contents in both arising discards and in dumps. A value of 2.77% was used, this being the sulphur content of the Greenside discards tested in the NFBC (Eleftheriades and North, 1987). This figure is also in agreement with sulphur contents reported by Hall, Eslait, and Den Hoed, (2011). Aziz and Dittus (2011) reported a significantly lower sulphur content of 1.5% in their study of a CFB power station utilizing discard coal from the Delmas coal mine. The economic study is sensitive to the sulphur content of the coal because this dictates the amount of sorbent required to reduce the sulphur oxide emissions.
Not considered here, but of merit to consider in a real application, is the possibility of beneficiating the discards, particularly those recovered from dumps, to reduce the sulphur content and therefore sorbent requirements (discussed below). Hall, Eslait, and Den Hoed, (2011) considered this option, whereas Aziz and Dittus (2011) did not.
Required Ca/S ratio: 2.9, 5.3
This is the molar ratio of calcium in the sorbent to sulphur in the coal, with a stoichiometric (1:1) ratio theoretically (but not in practice) being able to remove all the sulphur. As shown by the research in the NFBC, the calcium content of a sorbent is not necessarily a good indication of the efficacy of the sorbent, and therefore of the amount required (Eleftheriades and North, 1987). The physical nature of the sorbent plays a large role. A figure of 2.9 was derived from data quoted by Aziz and Dittus (2011) for limestone. Utt, Hotta, and Goidich (2009) indicate that 94% of the sulphur could be removed from a fuel containing 0.6% to 1.4% sulphur at a Ca/S ratio of 2.0 to 2.4. It was decided to use the figure of 2.9 quoted by Aziz and Dittus (2011), as a conservative approach.
For dolomite (the rationale for use of which is explained below), a Ca/S ratio of 5.3 was used. This is based on the relative performance of Lyttelton dolomite versus Union lime shown in the research on the NFBC. This is an estimate, but it is intended to show the effect of sorbent type and source on financial viability.
The Ca/S ratio is an important parameter, as it dictates the amount of sorbent that will be required, which is a significant operating cost for the plant. It would be of great value if the economic assessment developed here could be linked to a sorbent efficacy model, so that the required Ca/S ratio for a given sorbent can be input, rather than estimated.
Calcium carbonate content of sorbent: 30-96%
While the selected Ca/S ratio drives the calculation of how much calcium is required, the calcium content of the sorbent then dictates how much sorbent is required. This has implications for both the base cost of the limestone and the transport cost. South African limestones typically have a calcium carbonate content in the range of 85% to 95% (Agnello, 2005). The limestone chosen for this analysis is supplied by Idwala Lime from the limestone quarry in Danielskuil, approximately 700 km from the Witbank area. Idwala Lime currently supplies the limestone for the CSIR-designed FBC high-sulphur pitch incinerator operating at Sasol in Sasolburg (North et al., 1999). This limestone has a high calcium carbonate content, at 96%. This equates to a calcium content of 38.4%, as the molecular weight of calcium carbonate is 100, whereas that of calcium is 40.
An advantage of in-situ sulphur capture in FBC over flue gas desulphurization (FGD) in pulverized fuel (PF)-fired boilers is that FBC can utilize relatively poor sorbents, including dolomite. Haripersad (2010), drawing heavily on Agnello (2005), concluded that the ability of FBC to utilize these lower grade sorbents was a driver towards the adoption of FBC technology. There would be competition with the gold mining industry and the cement industry for the high-grade limestone required for FGD on PF plants, whereas there is little competition for low-grade limestone and dolomite. Further, he concluded that PF with FGD would become resource-constrained in terms of both sorbent and water by 2025. A scenario of using dolomite was therefore also considered in this current assessment.
Fixed operational costs: R202 million per year
This was calculated from the figures quoted by EPRI for fixed costs of an FBC power station (with limestone addition) as a factor of the installed capacity (South African Department of Energy, 2010b). (R404 per kW per year, escalated by the consumer price index).
Variable operational costs: R258 million per year
This was calculated from the figure quoted by EPRI (South African Department of Energy, 2010b) for variable operating costs for an FBC power station as a factor of power sent out in the year (R69.1 per MWh) (escalated by CPI). The costs for FBC without limestone addition were used, as in this current analysis the limestone costs are split out in order to assess their contribution to the costs, and to enable sensitivity analyses to be carried out on the delivered cost of limestone.
Water cost: R434 000 per year
This was derived from the water consumption indicated by EPRI (South African Department of Energy, 2010b) (33.3 l/MWh) and an assumed cost of water of R3.50 per megalitre (escalated by CPI). Water costs appear to be a relatively small component of the total annual operating costs.
Fuel cost: R129 per ton
This value was essentially 'reverse engineered' from the current electricity price and the indication by Koornneef, Junginger, and Faaij (2006) that the fuel component of the cost of electricity for 'waste coal' is 15%. Again, in reality, there could be a great range to this value. From experience, when a waste begins to be used the owner of that waste starts to ascribe increasing value to it. If the power station developer is also the owner of the mine, this effect will largely be negated.
Utt and Giglio (2011) used a value of $100 per ton for a 25 MJ/kg coal, and EPRI (South African Department of Energy, 2010b) used approximately R288 per ton for a 19.2 MJ/kg coal. The cost of the fuel needs to be determined/ negotiated and contracted in order to conduct an accurate economic viability assessment. For the purposes of this study, where the specific intent is to show the potential advantage of using waste coal, we believe the approach of using the fuel cost component indicated by Koornneef, Junginger, and Faaij (2006) is valid. A wide range of fuel costs is considered in the sensitivity analyses.
Fuel transport cost: R0.93 per kilometer per ton
It proved difficult to obtain transport costs from the transport industry itself. An indication of road transport costs was obtained from Blenkinsop (2012). Although not in the transport industry, Blenkinsop is assessing the viability of utility-scale FBC projects in southern Africa, and is therefore regarded as a reliable source of information. He indicated a range of between R0.90 and R1.30 per kilometre per ton (including escalation by CPI). The lower limit was taken, this being the transport cost indicated by Idwala Lime (below).
Fuel transport distance: zero
As the intent is to operate a mine-mouth power station, this will be zero for this current assessment. It has, however, been included in the calculations in order that sensitivity to this figure can be assessed should a potential application be located away from the mine. Alternatively, there could be multiple fuel feeds from multiple mines.
Sorbent cost: R449 per ton
This cost was obtained from Idwala Lime. The price has been escalated by CPI.
Sorbent transport cost: R0.93 per ton per kilometre
Idwala Lime indicated that the transport cost of their product from Danielskuil to Witbank is R650 per ton (after escalation by CPI). With the distance being approximately 700 km, this equates to approximately 93c per kilometre per ton.
Sorbent transport distance: 700 km
A distance of 700 km was used for the analysis, this being the distance from the Idwala Lime mine in Danielskuil to Witbank. The sorbent transport distance is, however, varied in order to gauge the sensitivity of the project viability to this parameter.
Electricity value: R0.5982 per kWh
The tariff at which Eskom is allowed to sell electricity is currently a hotly debated subject in South Africa. Proposed tariffs are set out in a Multi-Year Pricing Determination (MYPD) document. The National Energy Regulator of South Africa (NERSA) reviews this, and makes a decision on what it believes is a reasonable tariff increase, based on considerations of the cost of producing electricity and the impact that increase power tariffs could have on the economy of South Africa.
For each of the years 2010/2011, 2011/2012, and 2012/2013, an increase of 25.9% was approved by NERSA (Eskom, 2012). However, following a combined effort by Government and Eskom to lessen the impact of higher tariff increases on consumers the increase for 2012/2013 was reduced to 16% (Eskom, 2012). The revenue reported in 2013/2014 was 62.82 cents per kWh, which includes a 3 cent per kWh environmental levy (Eskom, 2014). A figure of 59.82 cents per kWh was therefore used. It is not clear, however, how much of this value could be realized by an independent power producer (IPP). If the electricity is to be used elsewhere (but possibly within the same company or group), there will be costs associated with transporting the electricity through the Eskom grid. An analysis was therefore run to estimate the lower limit for the electricity value that still results in a viable project. The value of the product, electricity, does of course have a major impact on viability. In the case of generation of electricity for self-use, the electricity will not result in true revenue, but will be an avoided cost.
An alternative approach was also taken, i.e. to calculate the cost that electricity would need to be sold at in order to realize an acceptable IRR (the hurdle rate of 20%).
Plant capital cost: R20 490 per kWe
This is a very important parameter, and unfortunately estimates of this varied. Utt and Giglio (2011) indicate a specific plant cost of $2000 to $2100 per kWe installed capacity for supercritical FBC. Tidball et al. (2010) showed a range of between approximately $1700 and $2600 per kWe (reported in 2007). This was a subcontract report written for a National Renewable Energy Laboratory (NREL) contract. EPRI (South African Department of Energy, 2010b) indicate a specific plant cost of R16 540 per kWe. This is quoted in South African rands rather than US dollars because the analysis was conducted as input to the South African Integrated Resource Plan. It was decided to use this value (corrected for four years of inflation at the average South African inflation rate of 5.5%, giving R20 490 per kWe) because this (a) was specifically carried out for a South African scenario and (b) specifically considered FBC power stations.
Depreciation period: 5 years
This is included in the discounted cash flow as a 'wear-and-tear' tax allowance that is allowed on capital expenditure. The allowable depreciation was assumed to be straight-line over 5 years. This approach is explained in Correia et al. (1989).
Plant lifetime: 30 years
Although a power station may be kept operating for 40 years or more, the assumption made by EPRI (South African Department of Energy, 2010b) of 30 years' plant life was also used in this analysis.
Discount rate: 9%
This is a key parameter in an economic analysis. Unfortunately, again, there is a range of values suggested. The discount rate is essentially a return that an investor would have to receive on the investment to warrant it. Generally, the value used here is the weighted average cost of capital (WACC) (or weighted marginal cost of capital, WMCC). This is (simplistically) calculated from the relative weights and contributions of equity, debt, and shares that are used to finance the project (Correia et al. , 1989). The accurate calculation of the WACC is in itself a science, and can involve the application of a capital asset pricing model (CAPM) (Nell, 2011). Power (2004) asserts that 'The cost of capital is a price, a price for a "share" of risk sold by a company.' As such, factors such as where a company's head office is listed can significantly affect it.
For the purposes of this analysis it was decided to use available figures for the WACC for the only current electricity utility in South Africa, Eskom. However, even with this narrowed focus, a range was obtained. BUSA states that the WACC proposed by Eskom (10.3%) was possibly high, and a value of 8% may be more realistic (BUSA, 2009). Mokoena states that Eskom's WACC is 8.16% (Mokoena, 2010). Mining Weekly quoted Dick Kruger, SA Chamber of Mines techno-economic assistant adviser, as saying that the 10.3% applied by the utility ... should be as much as three percentage points lower (Mining Weekly, 2012). It was decided to adopt a figure towards the middle of this range, namely 9%.
Tax rate: 28%
This is the standard tax levied on companies by the South African Revenue Service (2012).
Inflation: 5.5%
Inflation is a variable figure. Historically South Africa has seen periods of high inflation, whereas more recently inflation has been lower and more stable. Bruggemans (2011) shows a current inflation rate (2012) of 5.6%, and forecasts 5.5% and 5.9% respectively for 2013 and 2014.
The figure of 5.5% forecast for 2013 was assumed for this study. It was further assumed that this would hold steady over the analysis period. An inflation rate for each future year could be incorporated into the DCF, but this would complicate the analysis, with uncertain added value. In any event, the more important consideration is how much more or less than the CPI inflation rate other parameters will be, such as fuel price, transport price etc.
Coal, water, and transport cost inflation: 7.5% (2% above CPI)
An assumption was made that energy-related costs would rise at a rate above inflation. Coal is an energy product, water has a high electricity component to its price (due to pumping requirements), and transport obviously requires fuel and/or electricity.
Limestone, fixed operational and variable operational costs: 5.5% (equal to CPI)
These commodity or equipment-type costs are assumed to inflate in line with the CPI.
Electricity price inflation (5-year 16%, CPI + 5%)
The general belief that electricity price increases would continue to be well above inflation has proven to be valid, with the release of Eskom's Multi-year Price Determination 3 (MYPD3) document. Engineering News reports that increases of 16% have been requested in MYPD3, which was released on 22 October 2012 (Engineering News, 2012).
As with previous MYPD submissions this will still need to be reviewed by NERSA, but for the purposes of this analysis an increase of 16% per year was assumed for the first 5 years, with increases of CPI plus 5% thereafter.
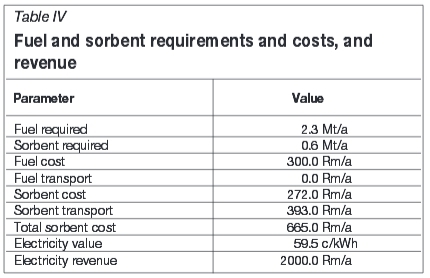
Discussion on material and energy balance and DCF
The material and energy balance, including calculation of costs, of the base case is shown in Table IV. In order to test the material and energy balance, input data was derived from the information presented by Aziz and Dittus (2011) and the same output in terms of fuel and sorbent requirements etc. was obtained. It was therefore concluded that the material and energy balances were sound.
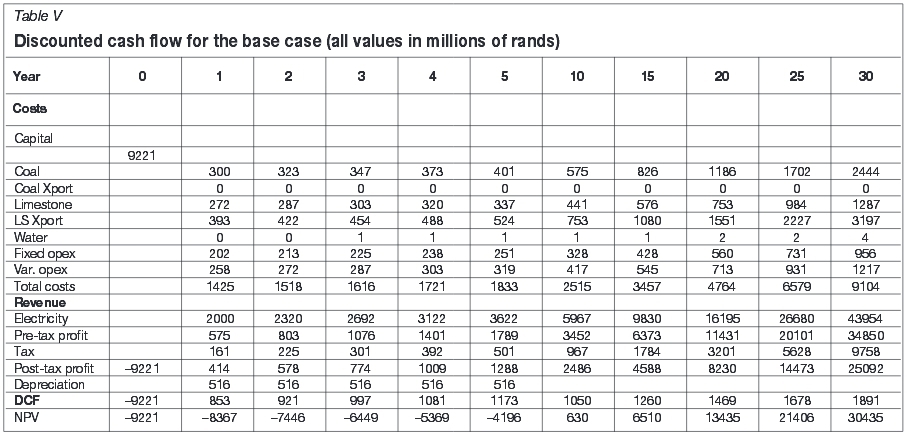
The DCF table produced from this data (plus additional input such as inflation estimates) is presented in Table V.
From these 'input parameters', a DCF table was constructed. The cash flow was calculated per year for 30 years. A summarized form of the DCF for the base case is given in Table V.
A summary of the financial indicators (NPV at 10, 20, and 30 years, and the IRR) is given in Table VI.
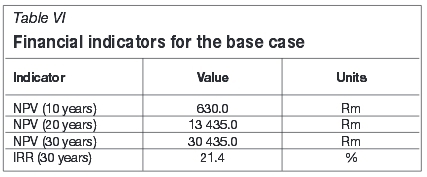
With an IRR of 21.4%, this appears to be a potentially worthwhile investment opportunity, warranting further investigation (and refinement of figures). As discussed above, investors would adopt a hurdle rate of about 20%.
Minimum value of electricity for financial viability (to achieve 20% IRR)
The DCF was used to calculate the value of electricity (in cents per kWh) that would deliver the adopted hurdle rate of 20% (with all other parameters as per the base case). This was calculated at 55.42 cents per kWh.
This price is very sensitive to the chosen hurdle rate. For example, should an investor adopt a hurdle rate of 22%, an electricity price of 61.54 cents per kWh would be required. An even more conservative investor, adopting a hurdle rate of 24%, would require 67.88 cents per kWh.
Sensitivity analysis
Financial indicators were calculated using the DCF. These were calculated for the base case and also used to run sensitivity analyses on the following parameters:
➤ Plant capital cost
➤ Cost of coal
➤ Transport distance of sorbent
➤ Electricity price (at project start).
Plant capital cost
To assess the sensitivity of the project to plant capital cost, this was varied from $1600 to $2800 per kWe installed capacity. The results are shown in Figure 1.
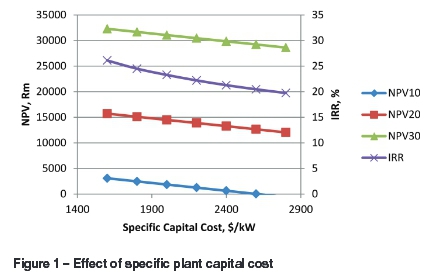
The IRR is sensitive to the specific plant capital cost, and falls from 26.1% to 19.74% as the specific plant cost rises from $1600 to $2800 per kWe. At a hurdle rate of 20%, the project would be considered marginal at a capital cost in excess of $2600 per kWe.
Cost of coal
The cost of coal was calculated using information from Koornneef, Junginger, and Faaij (2006) indicating that the fuel cost component of the cost of electricity for 'waste coal' is 15%. However, estimates varied, as indicated previously, with Utt and Giglio taking $100 per ton as a value (Utt and Giglio, 2011). In this current analysis, the coal will be purchased in South African rands. The cost of the coal was varied from zero to R900 per ton. Figure 2 shows the trend of NPV and IRR with coal price.
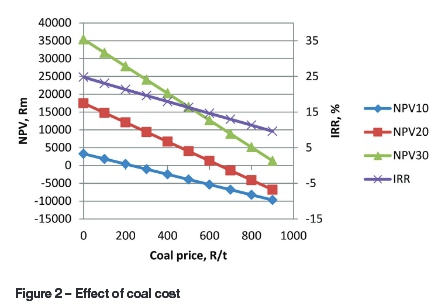
The cost of coal has a large effect on the viability of the project. From zero cost up to R200 per ton, the project still shows an IRR above the hurdle rate of 20%. At R300 per ton, the IRR is 19.63%, marginally below the hurdle rate. The 10-year NPV also becomes negative. At R700 per ton, the 20-year NPV also becomes negative. The indication is that this project (with the assumptions on other costs and revenue) will not be viable at a coal price in excess of approximately R300 per ton.
Transport distance of sorbent
In order to evaluate the sourcing of sorbent, the effect of transport distance (and therefore cost) was assessed. For the base case, a distance of 700 km was taken. For this sensitivity analysis a range of zero to 1000 km was used. Figure 3 shows the trend of NPV and IRR with sorbent transport distance. This analysis could also be used to assess the options of sourcing a low-grade sorbent near to the power station or a high-grade sorbent further away. For this to be of value, however, a full understanding of the efficacy of the sorbents would be needed.
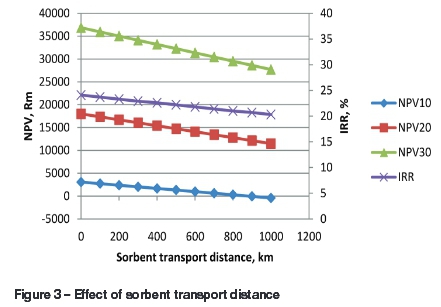
Although the IRR at a transport distance of 1000 km, at 20.3%, is still above the hurdle rate, an investor should investigate sorbent sourcing options. The limestone and dolomite deposits in South Africa are well known, but the efficacy of these sorbents in CFBCs has not been fully determined.
Effect of electricity price (at start of project)
An electricity value of 59.82 cents per kWh was used for the base case analysis as described above. There is, however, significant doubt as to the accuracy of that figure, as it depends on factors such as charges to 'wheel' the electricity through the existing grid, which would lower the effective revenue earned. There are also indications that it could be higher. Tore Horvei (2012), who was involved in feasibility studies of this kind in southern Africa, indicated that the value of electricity could be 85 cents per kWh. In order to gauge the sensitivity of the project to the electricity price it was varied from 30 cents to 90 cents per kWh. Figure 4 shows the trends of NPV and IRR with electricity price.
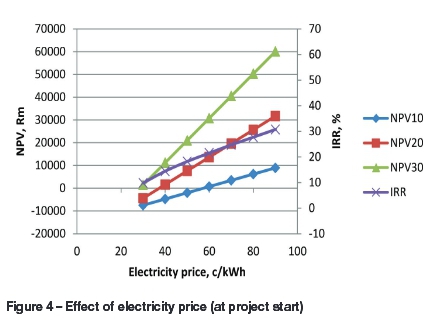
The electricity price has a marked effect on the viability of the project. At 30 cents per kWh to 50 cents per kWh the project shows a negative NPV after 10 years. The IRR hurdle rate of 20% is achieved only at approximately 59 cents per kWh. At the higher electricity prices, a high IRR is seen, in excess of 30%. The conclusion that can be drawn from this is that a potential IPP needs to understand clearly how much revenue will be effectively gained through the sale of electricity, as project viability is very sensitive to this parameter.
Conclusions and recommendations
There is significant electricity generation potential in discard coal. A combined total of approximately 18 GWe installed capacity could be fed with discard coal stockpiles and arisings.
CFBC technology has developed to the point where it is on a par with PF technology in terms of both efficiency and cost, and the ability of CFBC to utilize discard coal has been proven.
An economic analysis indicates that generating electricity from discard coal via CFBC is potentially favourable. The base case shows an IRR of 21.4%, which is above the hurdle rate adopted in this study of 20%. However, there are many factors to consider that affect the return on investment. The major elements affecting the IRR are the cost of the coal and the value of the electricity. For a given project, the analysis (in particular ash content, sulphur content, and CV) and amount of discard coal and the logistics around getting it to the power station must be fully understood, so that the effective cost of the 'free' fuel is known. The true value of the electricity, or the avoided cost if the electricity is generated for self-use, must be ascertained.
If possible, updated figures on the size and analysis of both discard stockpiles and arisings should be generated. This is because the dumps are being reprocessed, and modern coal beneficiation technologies are resulting in reduced carbon content of the arisings.
Unbeneficiated run-of-mine coal could also be considered as a feed to a CFBC power station.
The cost and efficacy of sorbent also affects the viability of the project. South African sorbent resources are well known, but sorbent efficacy in CFBCs is not. An efficacy database, perhaps linked to a GIS database, would enable an accurate determination of the cost of sorbent to be made.
References
Agnello, V. 2005. Dolomite and Limestone in South Africa: Supply and Demand 2005. Report no. R49/2005. Department of Minerals and Energy, South Africa. [ Links ]
Aziz, T. and Dittus, M. 2011. Kuyasa mine-mouth coal-fired power project: Evaluation of circulating fluidized-bed technology. Proceedings of Industrial Fluidization South Africa, 2011. pp. 11-29. [ Links ]
Blenkinsop, M. 2012. 11 October 2012. Personal communication. [ Links ]
Bruggemans, C. 2011. First National Bank Five Year Economic Forward Look. https://www.fnb.co.za/economics/econhtml/forecast/fc_5yearview_new.htm. [ Links ] [Accessed 17 October 2012].
Business Unity South Africa. 2009. Preliminary response to the Eskom Revenue Application for the Multi Year Price Determination for the period 2010/11 to 2012.13 (MYPD 2). http://www.busa.org.za/docs/PRELIMINARY%20SUBMISSION%20ESKOM%20APPLICATIONfinal.pdf [Accessed 17 October 2012]. [ Links ]
Correia, C., Flynn, D., Uliana, E., and Wormald, M. 1989. Financial Management. 2nd edn. Juta, Johannesburg, South Africa. [ Links ]
Du Preez, I. 2001. National Inventory of Discard and Duff Coal. Badger Mining. Confidential report prepared for the SA Department of Minerals and Energy. [ Links ]
Eleftheriades, C.M. and North, B.C. 1987. Special plant features and their effect on combustion of waste coals in a fluidized bed combustor. Proceedings of the 9 th International Conference on Fluidized Bed Combustion, Boston, 3-7 May 1987, Mustonen, J.P. (ed.). ASME New York. pp. 353-359. [ Links ]
Engineering News. 2012. Eskom seeks yearly increases of 16% to 2018. http://m.engineeringnews.co.za/article/eskom-seeks-yearly-increases-of-16-to-2018-2012-10-22 [Accessed 23 October 2012]. [ Links ]
ESKOM. 2012. Tariffs and Charges Booklet 2012/2013. http://www.eskom.co.za/content/ESKOM%20TC%20BOOKLET%202012-13%20(FINAL)~2.pdf [Accessed 16 October 2012]. [ Links ]
ESKOM. 2014. Tariffs and Charges Booklet 2014/2015. [ Links ]
Hall, I., Eslait, J., and Den Hoed, P. 2011. Khanyisa IPP - a 450 MWe FBC project: Practical challenges. Proceedings of Industrial Fluidization South Africa 2011. pp. 47-55. [ Links ]
Haripersad, N. 2010. Clean Coal Technologies for Eskom. MSc thesis. Da Vinci Institute of Technology Management, Johannesburg. [ Links ]
Horvei, T. 2012. 22 October 2012. Personal communication. [ Links ]
Jantti, T, 2011. Lagisza 450 MWe supercritical CFB - operating experience during first two years after start of commercial operation. Proceedings of Coal-Gen Europe 2011, Prague, Czech Republic, 15-17 February 2011. [ Links ]
Koornneef, J., Junginger, M., and Faaij, A. 2006. Development of fluidized bed combustion - An overview of trends, performance and cost. Progress in Energy and Combustion Science, vol. 22, no. 1. pp. 19-55. [ Links ]
Mining Weekly. 2012. Big electricity hikes will be "materially damaging" to SA mines. http://www.miningweekly.com/article/big-electricity-hikes-will-be-materially-damaging-to-sa-mines-2010-01-22 [Accessed 10 October 2012]. [ Links ]
Mokoena, S. 2010. Guideline on municipal electricity price increase for 2011/12. http://www.busa.org.za/docs/PRELIMINARY%20SUBMISSION%20ESKOM%20APPLICATIONfinal.pdf [Accessed 16 October 2012]. [ Links ]
Nel, S. 2011. The application of the capital asset pricing model (CAPM): a South African Perspective. African Journal of Business Management, vol. 5, no. 13. pp. 5336-5347. [ Links ]
North, B.C., Eleftheriades, C.E., Engelbrecht, A.D., and Rutherford-Jones, J. 1999. Destruction of a high sulphur pitch in an industrial scale fluidized bed combustor. Proceedings of 15th International Conference on Fluidized Bed Combustion, Savannah, Georgia, 16-19 May 1999. [ Links ]
Pinheiro, H.J., Pretorius, C.C., and Boshoff, H.P. 1999. Analysis of discard coal samples of producing South African collieries. Confidential unpublished report for the South African Department of Minerals and Energy. [ Links ]
Prévost, X.M. 2010. Personal communication. 14 October. [ Links ]
Power, M. 2004. How has South Africa Inc sought to reduce its high cost of capital? OECD Development Centre Seminar: 'Cheaper Money for Southern Africa - Unlocking Growth'. Paris, 7 October 2004. [ Links ]
South African Department of Energy. Not dated. Coal Baseload call. https://www.ipp-coal.co.za/Home/About [Accessed 7 May 2015]. [ Links ]
South African Department of Energy. 2010a. Integrated Resource Plan. http://www.energy.gov.za/IRP/2010/IRP2010.pdf [Accessed 12 October 2011]. [ Links ]
South African Department of Energy. 2010b. Power Generation Technology Data for integrated Resource Plan of South Africa. http://www.energy.gov.za/ - Programmes and Projects - integrated Resource Plan - EPRI report on supply side cost) [Accessed 12 October 2012]. [ Links ]
South African Revenue Service. 2012. SARS pocket tax guide, budget 2012. http://www.treasury.gov.za/documents/national%20budget/2012/sars/Budget%2020129O20Pocket9O20Guide.pdf [Accessed 17 October 2012]. [ Links ]
Tidball, R., Bluestein, J., Rodriguez, N., and Knoke, S. 2010. Cost and performance assumptions for modelling electricity generating technologies. NREL subcontract report NREL/SR-6A20-48595. http://www.nrel.gov/docs/fy11osti/48595.pdf [Accessed 11 October 2012]. [ Links ]
Utt, J. and Giglio, R. 2011. Technology comparison of CFB versus pulverized-fuel firing for utility power generation. Proceedings of IFSA 2011: Industrial Fluidization South Africa, Johannesburg, 16-17 November 2011. pp. 91-99. [ Links ]
Utt, J., Hotta, A., and Goidich, S. 2009. Utility CFB goes "supercritical" - Foster Wheeler's Lagisza 460 MWe operating experience and 600-800 MWe designs. Proceedings of Coal-Gen 2009, Charlotte, North Carolina, 18-21 August 2009. [ Links ]

