


Services on Demand
Article
 English (pdf)
 Article in xml format
 Article references
Indicators

Related links
-
 Cited by Google
 -
 Similars in Google
Share

 Permalink
Journal of the Southern African Institute of Mining and Metallurgy
On-line version ISSN 2411-9717
Print version ISSN 2225-6253
J. S. Afr. Inst. Min. Metall. vol.115 n.6 Johannesburg Jun. 2015
GENERAL PAPERS
Geometallurgical model of a copper sulphide mine for long-term planning
G. CompanI; E. PizarroII; A. VidelaI
IMining Engineering Department, Pontificia Universidad Catolica de Chile, Chile
IIApplied Technology Director, Chuquicamata Underground Mining Project, CODELCO
SYNOPSIS
One of the main problems related to mining investment decisions is the use of accurate prediction models. Metallurgical recovery is a major source of variability, and in this regard, the Chuquicamata processing plant recovery was modelled as a function of geomining-metallurgical data and ore characteristics obtained from a historical database. In particular, the data-set gathered contains information related to feed grades, ore hardness, particle size, mineralogy, pH, and flotation reagents. A systemic approach was applied to fit a multivariate regression model representing the copper recovery in the plant. The systemic approach consists of an initial projection of the characteristic grinding product size (P80), based upon energy consumption at the particle size reduction step, followed by a flotation recovery model. The model allows for an improvement in the investment decision process by predicting performance and risk. The final geometallurgical model uses eight operational variables and is a significant improvement over conventional prediction models. A validation was performed using a recent data-set, and this showed a high correlation coefficient with a low mean absolute error, which reveals that the geomet-allurgical model is able to predict, with acceptable accuracy, the actual copper recovery in the plant.
Keywords: geometallurgical modelling, multivariate regression, recovery prediction.
Introduction
Good investment decisions are based on reliable decision-making tools. In the geometallurgical field, decision-making tools are commonly models designed to predict ore or operational characteristics such as dilution, particle size, throughput, recovery, etc. The results lead to better design, investment, and operational decisions. Geometallurgical models can generate the information necessary to make better design evaluations in order to support business plans. The Batu Hijau throughput model (Wirfiyata and McCaffery, 2011) is a good example of how geometal-lurgical models can be applied to optimize the production plan and to improve the plant circuit. The changes made led to a throughput risk reduction of approximately 5%.
Geometallurgical models can be developed using physical kinetic methods or statistical models. An example of a physical kinetic model is the geometallurgical modelling of the Collahuasi flotation circuit (Suazo et al., 2010), in which the flotation rate constant was modelled by using the collision-attachment-detachment approach. The variables were gas dispersion properties, flotation feed particle size distribution, and operational and equipment parameters. Another example of the use of physical kinetic models to predict recoveries in flotation is the calculation of induction times, i.e., the time required for thinning and rupture of the water film between particles and bubbles (Danoucaras et al., 2013). Adopting the microkinetics modelling approach and using induction time, it was possible to obtain similar results to the actual recovery of galena in four different size classes.
Physical kinetic models are difficult to implement and update timeously, and in such cases statistical models can be developed based upon different kinds of operational data, such as mineralogy, hardness, particle size, hydrodynamic characteristics, and alteration. Here, it is important to note that input data may come from two sources: laboratory data or plant operational data. In the first case, there are more uncertainties related to the scale-up process (Ralston et al., 2007) than for operational-related data.
In the current study, Chuquicamata plant operational data on mill feed grades, ore hardness, particle size, mineralogy, pH, and reagents, representing several months of operation, was collected to predict recovery at the plant.
As stated by Coward et al. (2009) the variables that have the most impact on the processes of mining and treatment must be identified to determine those that need to be measured. Geometallurgical models need to be well specified. In the current study, a recent technique that allows selection of variables based on the F-test was used to select the best regression variables set. The use of a correct set of variables made it possible to formulate an accurate prediction using as little information as possible. As shown by Berry (2009), reliable geological data input and correct interpretation include two-thirds of all the problems experienced as a consequence of using geometallurgical models.
Recovery is one of the most important variables for a mining project, and defines the performance of the mineral concentration process. In economic terms, the income of a concentrator can be calculated in a simple form as follows:
E = P.g.Τ . R [1]
where Ρ is the net price of the valuable metal, which is usually defined by the market; g is the ore feed grade, which is defined as the result of the cut-off grade policy applied by the mine plan; and Τ is the mill plant throughput, which should be fulfilled to achieve a fixed production capacity. Finally, the recovery is an intrinsic variable of the concentration process and it can be managed in long-term planning by operative decisions.
It is well known that accurate forecasting of recovery is important due to its significance for the economic viability of a project and because it is a variable of major impact on processing plant results. A good recovery prediction model makes it possible to take mitigation and control actions to guarantee a minimum return on investment. Different approaches have been taken in modelling recovery. It is common to use variables related only to the flotation cell (Nakhaei et al, 2012; Danoucaras et al, 2013; Hatton and Hatfield, 2012), although a systemic approach which is linked to grinding and flotation models could yield better results (Bulled and Mclnnes, 2005).
Hypothesis
The aim of this study is to model ore recovery as a function of operational data and ore characteristics obtained from an historical database at the Chuquicamata A2 plant with the
idea of contributing to long-term management decisions and planning mitigation initiatives in the event of major deviations in plant performance. The data-set gathered was modified using a multiplier factor for confidentiality purposes.
In this study, a multivariate regression method was applied to develop a recovery model based on known operational variables.
A general form for a regression model is as follows:

where yi is the variable to be modelled, βj is a set of constant parameters, and xij are the regressors or explanatory variables for j going from 0 to n. Each variable in the data-set was normalized for easier interpretation of the constant parameters as shown in Equation [3] :

where  represents the average of the variable along the historical set of data. Therefore, a higher constant value βj means higher significance of the variable Xi in the regression.
Chuquicamata plant description
The Chuquicamata copper mine is owned and operated by CODELCO, a Chilean state-owned company since 1976. It is located in the northern part of Chile, near Calama, 215 km northeast of Antofagasta. Chuquicamata produces copper cathodes from concentrate obtained at three different plant facilities named AO, A1, and A2, each with different process technologies, depending upon the time they were built. A simplified process flow chart is shown in Figure 1
The AO plant was built in 1952. It operates a conventional milling circuit designed to process 74 kt/d. It consists of 13 grinding circuits in parallel, each having one rod mill (10x14 ft, 597 kW) and two ball mills (10x12 ft, 597 kW). The A1 mill was built in 1983. It is designed to process 38 kt/d and operates three parallel grinding circuits, each having one rod mill (13.5x18 ft, 1305 kW) and one ball mill (16.5x21 ft, 2610 kW). Finally, the A2 mill, built in 1989, operates two parallel SAG lines, each with one SAG mill (32x15 ft, 8203 kW) and two ball mills (18x26 ft, 3729 kW). Additionally, the A2 mill plant has another smaller grinding line with two ball mills (13x18 ft, 1305 kW).
Each grinding circuit is followed by a rougher froth flotation circuit. The rougher concentrate from the three mills goes through a single cleaner, scavenger, re-cleaner, and re-scavenger circuit that produces a copper-molybdenum concentrate. The concentrate is then transported to a selective molybdenum concentration plant, where separate copper and molybdenum concentrates are ultimately obtained.
Plant operational data analysis
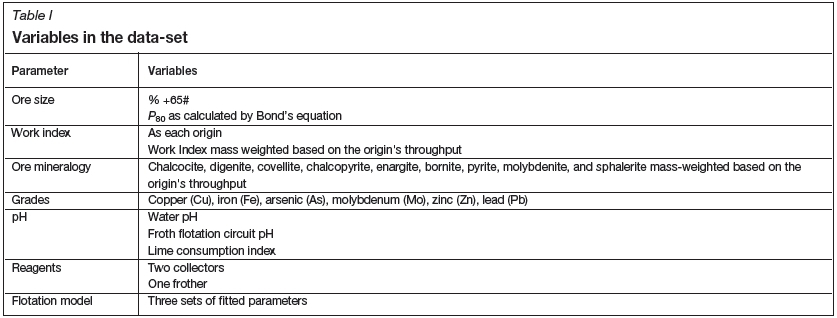
The historical data-set contains information related to feed grades, hardness, particle size, mineralogy, pH, and reagent dosages for froth flotation. The data-set consists of 29 variables controlled daily between January and October 2013. Table I shows each variable under study.
An exhaustive statistical analysis was performed as an initial effort to model the recovery response function. First, a normality test was conducted to understand the intrinsic variation in recovery. Figure 2 shows the normal distribution test applied to the data. Over the period under analysis, copper recovery at the A2 plant averaged 86.6% with a coefficient of variation of 2.5%. As the figure shows, the data fits well to a normal distribution. Although the coefficient of variation could be considered acceptable, it is still necessary to identify the source of variations in the recovery response for accurate predictions.

With long-term evaluation studies it is common practice to use a fixed average recovery, for instance 86%, for every year of the term of evaluation. This average is subsequently corrected by variations in copper feed grade. It is expected that a geometallurgical model that has a good correlation with operational and feed characteristic parameters will lead to better results and constitute a better tool for investment decisions.
Ore feed sources
The A2 plant receives ore feed from three different mines: Chuquicamata (DCH), which contributes 77% of all the ore feed to the plant, Radomiro Tomic (RT), which contributes 19%, and finally Minitro Hales (DMH), which contributes 4%.
Ore feed grindability
Another important characteristic regarding ore feed is its work index. Defined by Bond (1963), the work index (Wi) is the specific energy (kWh/t) required to reduce a particulate material from an infinite grain size to 100 μm. Therefore high work indexes are associated with ores which are more difficult to grind. As defined by Bond, the specific energy required for a given grinding process is related to the work index by the following expression:

where Ε is the specific energy consumption (kWh/t) and P80 and F80 are the 80% passing sizes (μm) of the product (P) and feed (P).
An analysis of the data-set revealed that the work index at the DCH mine is greater than that observed at RT and DMH. The DCH ore has an average work index of 14.3 kWh/t, whereas the work indexes for the RT and DMH ores are 12.8 kWh/t and 12.5 kWh/t respectively. These differences indicate, as result of applying Equation [4], that it would not be possible to achieve the same throughput for the same P80 for the different ores from DCH, DMH, and RT. In fact, an increment in the proportion of DCH ore feed will lead to an increment in the grinding product size P80.
Ore feed mineralogy
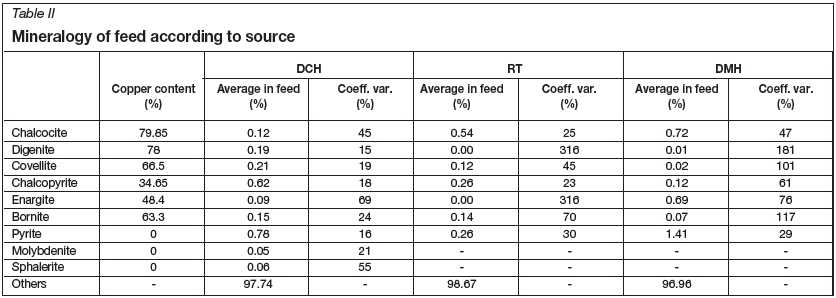
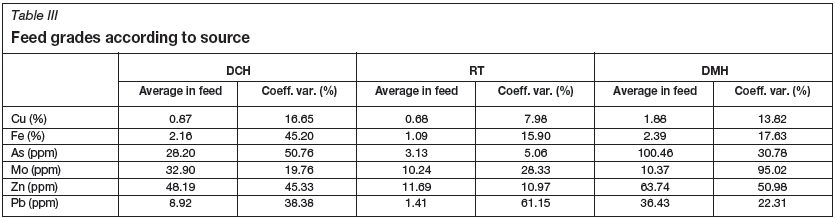
The mineralogy of the ore feed differs depending on its origin. The main mineral species in the mill feed were chalcocite (Cu2S), digenite (Cu9S5), covellite (CuS), chalcopyrite (CuFeS2), enargite (Cu3AsS4), bornite (Cu5FeS4), pyrite (FeS2), molybdenite (MoS2) and sphalerite (ZnS). Copper feed grades were measured by atomic absorption analysis. Each feed sample was assayed for copper (Cu), iron (Fe), arsenic (As), molybdenum (Mo), zinc (Zn), and lead (Pb). Results are summarized in Table II and Table III.
As can be seen, chalcopyrite and pyrite are the most important species in the DCH feed ore. The presence of pyrite could cause recovery problems, because pyrite competes with chalcopyrite for recovery by the collector during froth flotation. Chalcocite is an important species in the RT and DMH ores, and enargite is also significant in the DMH ore.
Table III shows the distribution of feed grades. As shown, the copper grade in the DMH ore is significantly higher than in the DCH and RT ores. Another important difference is the arsenic grade, which is very high in the DMH ore, 100 ppm on average, or more than 30 times that in the RT ore and three times higher than in the DCH ore. The most important issues concerning arsenic are the smelting penalties incurred and the environmental issues, given that arsenic is a dangerous contaminant and must be disposed of properly.
Predicting recovery in long-term mine plans with ore blends from several sources is a complex task, usually leading to non-linear behaviour. Because of this, a geometal-lurgical model can be a useful tool for planning purposes if interactions, both positive and negative, between variables are well captured and nonlinear relationships are recognized at an early stage.
The systemic approach
A systemic approach was applied to develop a multivariate regression model representing the copper recovery in the Chuquicamata plant. The systemic approach consisted of reducing all unit operations to a two-step sequential process, grinding and concentration (Figure 4). In this study, a projection of the average P80 has been done based upon energy consumption in the grinding step, and the resulting particle feed size is the input for the froth flotation recovery model.

Geometallurgical multivariate regression model
As stated previously, the aim of this study is to generate a geometallurgical model for copper recovery in the A2 plant. The data-set collected from Chuquicamata was used to establish a relationship between the most significant variables controlling the operational performance of the plant.
The main variables controlling copper recovery were selected using a technique based on the Fisher test (F-test). This approach is different from other commonly-used techniques based on simple correlations between variables and redundancy (Boisvert et al, 2013). The method consists of adding or removing variables from the model, and calculating iteratively an F-statistic and p-value for each variable in the model. The p-value is the probability of obtaining a test statistic result at least as extreme or as close to the one that was actually observed, assuming that the null hypothesis is true. If the model contains j variables, then for any variable Xr the F-statistic is defined as follows:

where n is the number of observations, SSE(j-xr) is the squared error for the model that does not contain Xr SSEjis the squared error, and MSEj is the mean squared error for the model that contains Xr.
If the p-value calculated for any variable in the model is greater than a defined significance level (α), then the variable is removed. After that, if there are no more variables with a p-value to be removed, the method continues trying to add a variable on the basis of its F-statistic and p-value. If the p-value corresponding to the F-statistic for any variable not in the model is smaller than a significance value a, then the variable is added. The entire process is then repeated in an iterative procedure. The method ends when there are no more variables to be removed or added (Montgomery and Runger, 2002).
Analysis of variables used in the regression data-set
Chuquicamata has historically used a method to project recovery as a relationship between recovery and copper feed grade as described by the following equation:
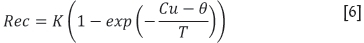
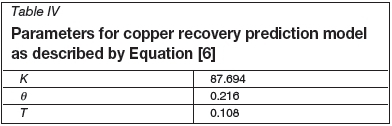
where Κ is the recovery obtained at infinite residence time in the flotation circuit, Τ is a constant parameter, and θ is the copper grade in the tailings. Using a regression technique, the equation can be fitted to the historical data. Results are shown in Table IV.
This model has a small statistical significance, with an R2 of only 7.11% over the historical database under analysis, which indicates a poor copper recovery prediction.
In order to develop a model for the recovery in the A2 plant, the previously mentioned variable selection methodology was applied to the overall data-set. Results of the variable selection method for the data-set collected are shown in Table V.

Column 2 of Table V shows the correlation constant βj of each component. The laboratory flotation model represents the application of Equation [6], Wi DMH is the work index of the DMH mill feed ore, constant is βo in the model as defined in Equation [2], Cp is the chalcopyrite grade of the ore feed, Pso is the mill plant product size, Fe is the iron grade of the mill feed, Dg is the digenite, CuS is the soluble gopper grade, and Mo is the molybdenite present in the ore feed.
This regression model (Table V) achieves a coefficient of determination (R2)of 56.6%. Although these results represent a significant improvement with respect to the standard method, they were not completely satisfactory, therefore a second-degree polynomial fit was attempted by adding second-degree terms for each of the variables. The final set of variables selected for the model were iron (Fe) and copper sulphide (CuS) feed grades, molybdenite (Mo), chalcopyrite (Cp), digenite (Dg) grades, the work index of the ore from DMH (WiDMH), and product size (P80). Table VI shows the coefficients for this new regression model.
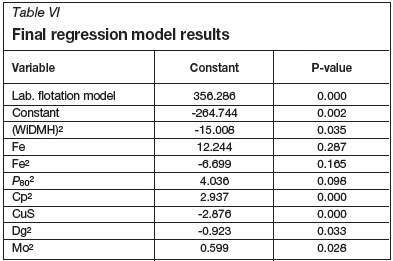
The final model has a correlation coefficient of 75.6% and coefficient of determination (R2) of 57.2%. Table VII shows a summary of the statistics for the model.

Results and discussion
The final response function for copper recovery, based on the available information collected in the A2 mill plant, is as follows:

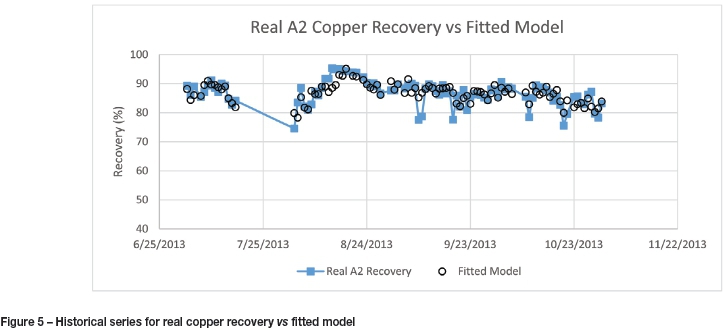
Figure 4 shows a 0-0 plot of the measured copper recovery vs the predicted recovery during the period under analysis. The confidence interval is 97.5%. The actual historical recovery is compared with the fitted model in Figure 5.
The statistical analysis shows that recovery is more sensitive for specific variables. These variables are copper feed grade (Cu), iron feed grade (Fe), and the work index of the DMH ore. This implies that for long-term projections, better control over these variables will have a beneficial impact on the recovery projections and control variability.
Each variable in the model has a constant coefficient that shows its impact on the copper recovery projection. As expected, the significant plant variables affect the recovery in the same way that empirical evidence does. Four variables behave as expected: copper, chalcopyrite, the work index of DMH, and soluble copper. The first two have a positive impact. As empirical evidence shows, when copper grade increases, copper recovery also increases. The presence of chalcopyrite has the same effect as copper grade, because in porphyry copper deposits such as DCH, RT, and DMH, chalcopyrite is one of the minerals that increases the copper grade of the ore. On the other hand, the work index of the ore from DMH mine and soluble copper both have a negative, or inverse, impact on copper recovery. The work index affects the liberation, so when the work index increases it becomes more difficult to liberate copper-bearing minerals from the ore, therefore recovery decreases. Soluble copper grade has an expected adverse effect on flotation recovery, because soluble copper ore does not float under sulphide copper flotation conditions.
There are two variables which have unexpected behaviour: P80 and digenite. P80 has a positive impact on the estimated recovery, and digenite a negative one. Both behaviours are the opposite to what is expected from the empirical evidence. It is known that when P80 increases copper liberation decreases, therefore recovery should decrease. The model shows the opposite behaviour, which could imply that the mill plant operates at the lower boundary of optimal grinding size. Digenite also has an unexpected impact on copper recovery, and further investigation of this phenomenon is needed.
In addition there is one variable, Fe, which is presented in the regression model in first and second degrees. This variable has the expected overall effect of reducing copper grade recovery when Fe is increased in the ore feed.
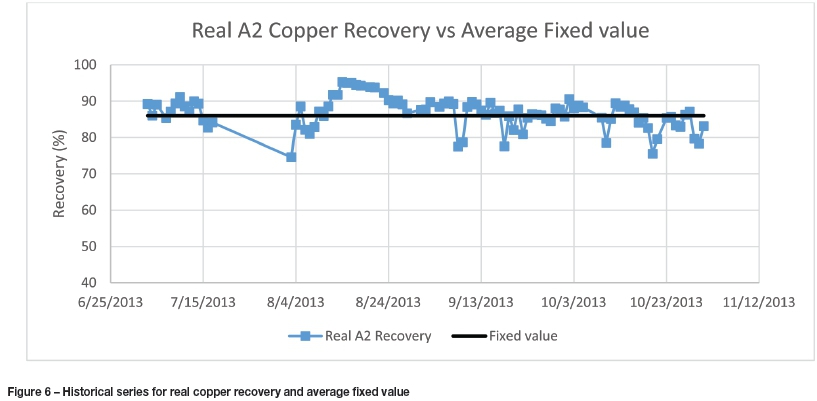
The final model shows a great advantage compared with using an average fixed value to project recovery in medium-and long-term studies with a variable ore feed. If a fixed value of 86% for recovery were used to predict copper recovery in the period under analysis, as shown in Figure 6, the mean absolute error would have been 3.9%. The final model gives a mean absolute error in the same period of only 2.4%, which represents a significant 1.5% improvement in recovery.
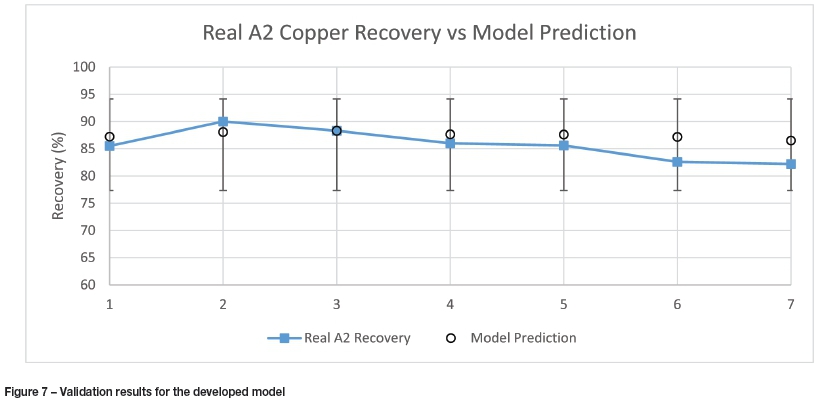
Validation
The recovery regression model was validated using monthly plant data between January and July 2014. The model prediction shows a correlation coefficient of 89.7% and a mean absolute error of 2.75%. Results of the validation are shown in Table VIII and Figure 7.
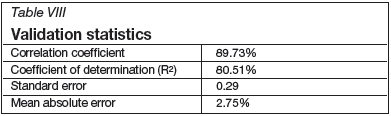
The low mean absolute error and high correlation coefficient obtained indicate that the developed model is able to predict, within an acceptable range, the real copper recovery in the plant.
The developed geometallurgical model is a significant improvement compared to the current fixed value used for copper recovery. Also, the regression equation shows that it is able to capture with confidence any variation in the feed ore characteristics.
Conclusions
The results presented show that is possible to improve, with an acceptable certainty, recovery estimations for a concentration process based on operating and ore characteristics data. The database used included information relating to feed grades, ore hardness, particle size, mineralogy, pH, and reagent mix for froth flotation. The final regression model used only copper, iron, and soluble copper feed grades, molybdenite, chalcopyrite, digenite, the work index of the ore from DMH, and P80.
A methodology based on a systemic approach and an adequate selection of variables was used to adjust a multivariate regression model that represented the copper recovery. The best model found used 8 out of 32 variables collected in the database. The model fit achieved a correlation coefficient of 75.6% with a mean absolute error of 2.4%, which is acceptable for medium-term projections purposes.
Model validation was performed for the developed regression model. Results show a correlation coefficient of 89.7% and a mean absolute error of 2.75% between the real observations and the predicted values. These high correlation and low error values indicate that the model has the ability to predict recovery variability with an acceptable confidence, which shows the model is an improvement compared to the use of a fixed value. This improved forecasting capacity assists investment decisions and would allow optimization of production plans, due to its ability to identify low- and high-risk options. The usefulness of these improvements in forecasting capacities, evaluating risks, and defining risk values for mitigation control will be the focus of a forthcoming study.
The model variables impact the recovery as expected, with the exception of P80 and digenite. Further study is needed to elucidate the unexpected behaviour of these variables on recovery.
References
Berry, M. 2009. Better decision-making from mine to market by better assessment of geological uncertainty. AusIMM Project Evaluation Conference, Melbourne, Vic., 21-22 April 2009. Publication Series no 3/2009. Australasian Institute of Mining and Metallurgy, Carlton, Australia. pp. 15-19. [ Links ]
Boisvert, J., Rossi, M., and Ehrig, K. 2013. Geometallurgical modeling at Olympic Dam Mine, South Australia. Mathematical Geosciences, vol. 45. pp.901-925. [ Links ]
Bond, F.C. 1963. Metal wear in crushing and grinding. 54th Annual Meeting of the American Institute of Chemical Engineers, Houston, TX. AIChE, New York. [ Links ]
Bulled, D. and McInnes, C. 2005. Flotation plant design and production planning through geometallurgical modelling. Centenary of Flotation Symposium, Brisbane. Australasian institute of Mining and Metallurgy. pp. 809-814. [ Links ]
Coward, S., Vaan, J., Dunham, S., and Stewart, M. 2009. The primary-response framework for geometallurgical variables. Seventh International Mining Geology Conference, Perth: Australia. Australasian institute of Mining and Metallurgy. pp. 109-113. [ Links ]
Danoucaras, A.N., Vianna, S.M., and Nguyen, A.V. 2013. A modeling approach using back-calculated induction times to predict recoveries in flotation. International Journal of Mineral Processing, vol. 124. pp. 102-108. [ Links ]
Hatton, D.R. and Hatfield, D.P. 2012. A probabilistic equation for flotation simulation. Minerals Engineering, vol. 36-38. pp. 300-302. [ Links ]
Montgomery, D.C. and Runger, G.C. 2002. Multiple linear regression. Applied Statistics and Probability for Engineers. Wiley, New York. pp. 411-467. [ Links ]
Nakhaei, F., Mosavi, M.R., Sam, A., and Vaghei, Y. 2012. Recovery and grade accurate prediction of pilot plant flotation column concentrate: neural network and statistical techniques. International Journal of Mineral Processing, vol. 110-111. pp. 140-154. [ Links ]
Ralston, J., Fornasiero, D., Grano, S., Duan, J., and Akroyd, T. 2007. Reducing uncertainty in mineral flotation - flotation rate constant prediction for particles in an operating plant ore. Mineral Processing, vol. 84. pp. 89-98. [ Links ]
Suazo, C.J., Kracht, W., and Alruiz, O.M. 2010. Geometallurgical modelling of the Collahuasi flotation circuit. Minerals Engineering, vol. 23, no. 2. pp. 137-142. [ Links ]
Wirfiyata, F. and McCaffery, K. 2011. Applied geo-metallurgical characterisation for life of mine throughput prediction at Batu Hijau. Fifth International Conference on Autogenous and Semiautogenous Grinding Technology, Vancouver, Canada, 25-29 September 2011. Canadian Institute of Mining, Metallurgy and Petroleum. [ Links ]

