


Services on Demand
Article
 English (pdf)
 Article in xml format
 Article references
Indicators

Related links
-
 Cited by Google
 -
 Similars in Google
Share

 Permalink
Journal of the Southern African Institute of Mining and Metallurgy
On-line version ISSN 2411-9717
Print version ISSN 2225-6253
J. S. Afr. Inst. Min. Metall. vol.115 n.6 Johannesburg Jun. 2015
GENERAL PAPERS
Q-coda estimation in the Kaapvaal Craton
D.J. Birch; A. Cichowicz; D. Grobbelaar
Council for Geoscience, South Africa
SYNOPSIS
The Q-coda method for estimating the quality factor Q(f)= Qo(f)n was used to characterize seismic wave attenuation in a region of the Kaapvaal Craton that includes the mining areas of the Bushveld Complex and Witwatersrand Basin. Seismic waveform data, collected by locally distant stations of the South African National Seismograph Network (SANSN), consisted of mining-related events with magnitudes ranging from ML 1.8 to ML 4. Q was calculated for nine different source-receiver pairs spanning the study region. A weighted average Q based on the number of available data gave an estimated attenuation relation for the study region of Q(f) = 327f0.81.
Keywords: seismic wave attenuation, coda waves, Q-coda method.
Introduction
Earthquake activity in South Africa is significantly more prevalent in the mining regions, especially gold mining, than anywhere else in the country (Saunders et al., 2008). This has led to a concentration of seismograph stations of the South African National Seismograph Network (SANSN) around mining areas. An accurate understanding of the attenuation is important to seismograph networks. It affects not only the results of day-to-day monitoring such as magnitude calculations, but also advanced seismological studies such as determining the characteristics of the seismic source. With the increase in the number of seismograph stations around the gold and platinum mining areas, a study to determine the attenuation of seismic waves is this region is necessary.
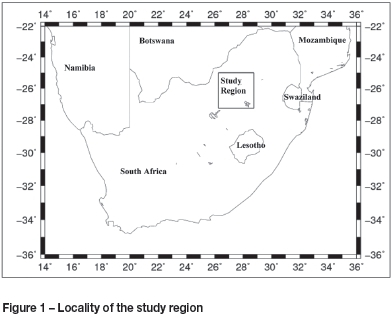
The region under investigation stretches from the gold mines at Klerksdorp in the south to the platinum mines at Rustenburg in the north (Figure 1). The study region lies at the centre of the Kaapvaal Craton and includes the economic mineral rich formations of the Witwatersrand Supergroup and Bushveld Complex. The Q-coda method for estimating the attenuation parameter, Q, was applied to the gold and platinum mining districts of South Africa. Data from stations of the South African National Seismograph Network (SANSN) at local distances were used. The data-set includes only mining-related events initiated at shallow depths (< 5 km).
S-wave coda decay has been widely used to characterize the local, lateral heterogeneity of the shallow crust. The method, developed by Aki (1969) and Aki and Chouet (1975), is a statistical approach to the coda wave amplitude decay characterized by a single backscattering model. Aki (1969) described the origin of coda waves from local earthquakes as backscattered waves and regarded them as a superposition of secondary waves, sometimes being referred to as the S-coda or QS. Aki (1969) proved that they could be treated entirely statistically and that they were caused by heterogeneities in the shallow crust because of their short period nature. The strict interpretation of Q, referred to as the quality factor, according to Langston (1989) is that it is the attenuation effect due to scattering of the elastic waves by elastic heterogeneity.
The general approach to estimating the attenuation in a country with little tectonic seismicity and a short history of recorded seismicity (Saunders et al., 2008) is to use models that have been derived for similar stable continental regions. One such region is Norway, which is characterized by small to moderate, crustal earthquakes (Bungum et al.,1991). Ottemöller and Havskov (2003) use a quality factor of QS/Lg(f )= 470f0.7for Norway.
Q-coda method
The extent to which backscattered S-waves are generated is dependent on the heterogeneity of the shallow crust and is quantified as the attenuation of the medium by the parameter Q.
Aki and Chouet (1975) proposed two extreme models to account for the observations on the coda of seismograms.
Both models led to similar formulae that allowed for the separation of the effects of the earthquake source and attenuation on coda spectra. The single backscattering model is most frequently used to determine Q (Scherbaum and Kisslinger, 1985; Lee et al., 1986; Woodgold, 1990; Gupta et al., 1998; Yun et al., 2007; Parvez et al., 2008). Aki and Chouet (1975) also noted several important properties of coda waves that were highlighted and explained by Sato (1977). One such property is that the coda wave power spectra of local earthquakes of different magnitudes and locations but from the same sampling volume have a characteristic time-dependent decay. This serves as proof that the coda wave train is the result of scattered S-waves for local earthquakes.
The coda wave amplitude Ac(f,T) we observe on a seismogram is a function of the seismic source S(f), the site effect Z(f), the instrument transfer function I(f), and the medium function C(f,T).
Ac(f,T) = S(f).Z(f).I(f).c(f,T) [1]
The medium function describes the geometrical spreading and attenuation, which are responsible for the coda amplitude decay. The source-receiver distance is small (< 100 km) and considered negligible when compared with the travel path of the backscattered waves. Thus, the sampling volume for which Q is calculated is much larger than the source volume where the seismicity is generated. In the single backscattering model, scattering is considered to be a weak process and the loss of seismic energy through scattering is neglected (Aki and Chouet, 1975). The single backscattering model expresses the medium function as follows:
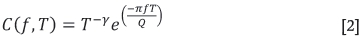
where T = lapse time; γ = geometrical spreading factor; f= frequency; Q = coda quality factor.
The lapse time is the time that has elapsed since the earthquake origin time. The geometrical spreading factor is assumed to be equal to unity for body waves and 0.5 for surface waves. This model allows us to separate the medium function from the rest by taking the natural logarithm on both sides.

For a particular central frequency,f, the least-squares fit for a plot of ln(AC(f,T).T) vs. T allows us to solve for the quality factor, Q.
The frequency dependence of Q was modelled as a power-law relationship of the form:

where Q = Qo at 1 Hz and n characterizes the frequency dependence of the attenuation in the medium.
A procedure to determine Q was written in MATLAB, using the following steps:
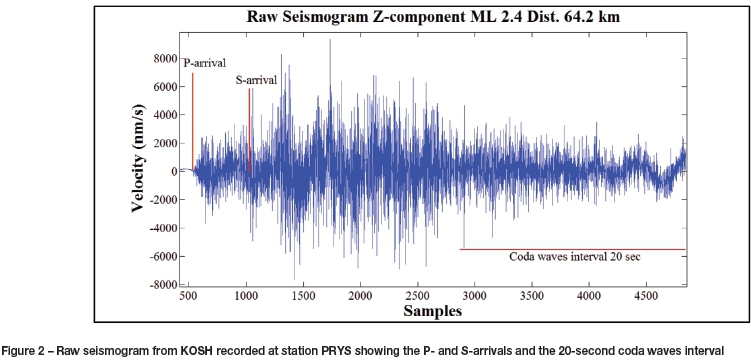
➤ The P- and S-arrivals of raw seismograms were re-picked to ensure accuracy. The seismograms were then trimmed for faster processing (Figure 2)
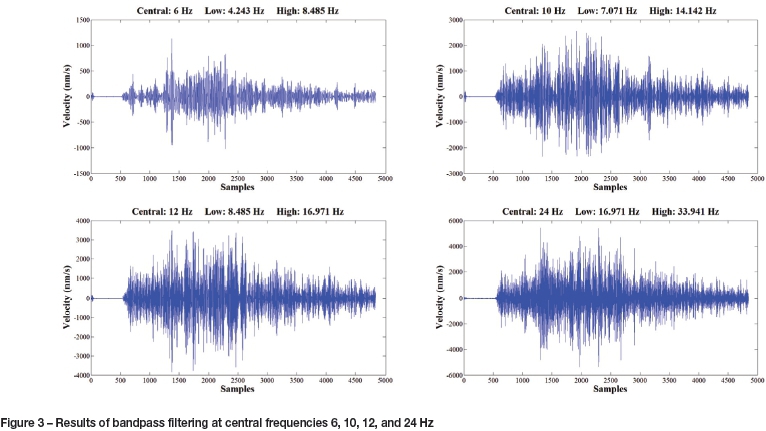
➤ The trimmed seismograms were filtered at central frequencies of 3, 4, 5, 6, 7, 8, 10, 12, 14, 16, 20, and 24 Hz, using an 8-pole Butterworth bandpass filter (Figure 3)
➤ The coda waves were extracted from 20-second time windows starting at 2Ts (Ts is the arrival time of S-wave less the origin time of the event). For lapse times > 2Ts the general form of the coda is established (Rautian and Khalturin, 1978)
➤ The rms coda amplitudes were calculated for windows of 0.5 seconds
➤ The slope of the coda wave amplitude decay was extracted from least-squares fits of the data, which allowed us to solve for Q at each frequency (Figure 4)

➤ A power-law relationship (Equation 4) was modelled using a least-squares fit of the data (Figure 5).
Certain quality control measures were employed. The signal-to-noise ratio of the coda was calculated by taking the rms amplitude of a 5-second window of noise before the P-arrival and comparing it with that of a 5-second window at the end of the 20-second coda wave interval. Waveforms with a ratio of less than 2.0 were not used. Any coda amplitude decay with a positive slope was rejected. Least-squares fits of the coda amplitude decay with relative standard errors of greater than 50% were rejected.
Data description
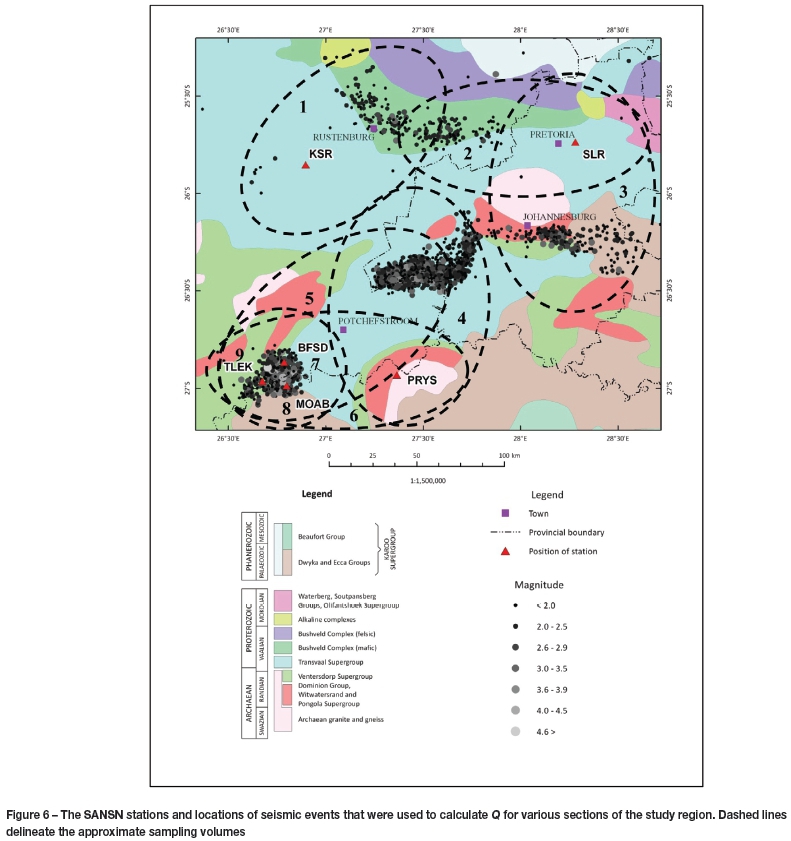
Waveform data were collected for seismic events located in the vicinity of the platinum mines near Rustenburg, the gold mines of the Central and West Rand, which form part of the Witwatersrand Basin, and the gold mines near Klerksdorp. These recordings were written at locally distant stations of the SANSN (viz. BFSD, KSR, MOAB, PRYS, SLR and TLEK, see Figure 6). The data includes densely clustered, small magnitude (ML 1.8 to ML 4) events.
Three seismograph stations of the SANSN are located in the Klerksdorp area, resulting in source-receiver distances for these events of 0-30 km. In all the other cases, the seismograph stations were located 50-70 km from the seismicity.
Scherbaum and Kisslinger (1985) estimated the sampling volume for the coda waves of lapse time T as an ellipsoid with axes α=Δ and b=vs.T/2, where Δ is the hypocentral distance and vs the S-wave velocity, and the source and station positioned at the foci. For shallow mining events located at distances > 50 km and with depths less than 5 km (the deepest mining), we can assume that hypocentral distance is approximately equal to epicentral distance. The average shear wave velocity in the upper 3 km was assumed to be 3.5 km/s (Kgaswane et al., 2012) and the coda wave duration was T= 20 seconds. The maximum sampling volume would therefore take the shape of an ellipsoid with the major axis a = 70 km and minor axis b = 35 km. Since events are spread across the different mining areas, the total approximate sampling volume has an approximate diameter of 140 km. In the Klerksdorp area, BFSD, MOAB, and TLEK, sample roughly the same area defined by a diameter of 35 km.
Figure 6 shows the source-receiver pairs that were selected to calculate a quality factor for this study. Some stations were used twice with nearby seismic events from two different areas. A total of nine different pairs were used. The geology of the various sampled volumes is also displayed in Figure 6.
The data mainly sampled rock formations of the Transvaal Supergroup, with sources located in the igneous rocks of the Bushveld Complex and sedimentary formations of the Witwatersrand Supergroup.
Results and discussion
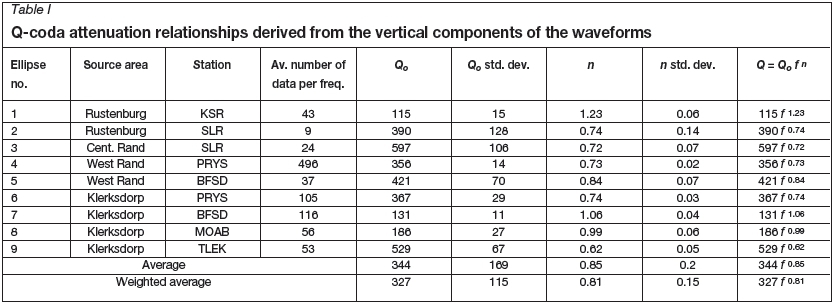
The results are listed in Table I. The quality factor was calculated using the vertical components of the waveforms only, since site effects cause amplification on the horizontal components at specific frequencies, which would contaminate the results.
The attenuation parameter Qo varied between 597 and 115. A low Qo corresponds to a high attenuation. The parameter n, which describes the power-law relationship between Q and frequency, varied between 1.23 and 0.62. A value greater than unity would suggest that higher frequencies attenuate less than the lower frequencies. This is difficult to explain, but it could be related to the fact that higher frequencies are more susceptible to small-scale heterogeneities, which give rise to S-wave scattering and, ultimately, the coda waves. In this case, a higher frequency wave would be scattered more often, becoming more prevalent in the coda and appearing to be attenuated less than the lower frequency waves.
The number of available data in the different areas varied significantly, with the lowest average number of data per frequency being only 9, while the highest was 496. It is, therefore, best to calculate a weighted average as opposed to treating the individual results equally. This was done based on the average number of data per frequency. The average was also calculated for comparison. The weighted average yielded a quality factor of 327 f0.81.
The ellipses 1, 7, and 8 from Figure 6 deviated from the relatively low attenuation observed in the remaining sampled volumes, yielding values for Qo between 186 and 115 and for n between 1.23 and 0.99. The geology does not provide an explanation for this, since the three stations BFSD, MOAB, and TLEK would have sampled very similar rock masses. These three areas also do not have the lowest numbers of data available, suggesting that a lack of data is most likely not the cause.
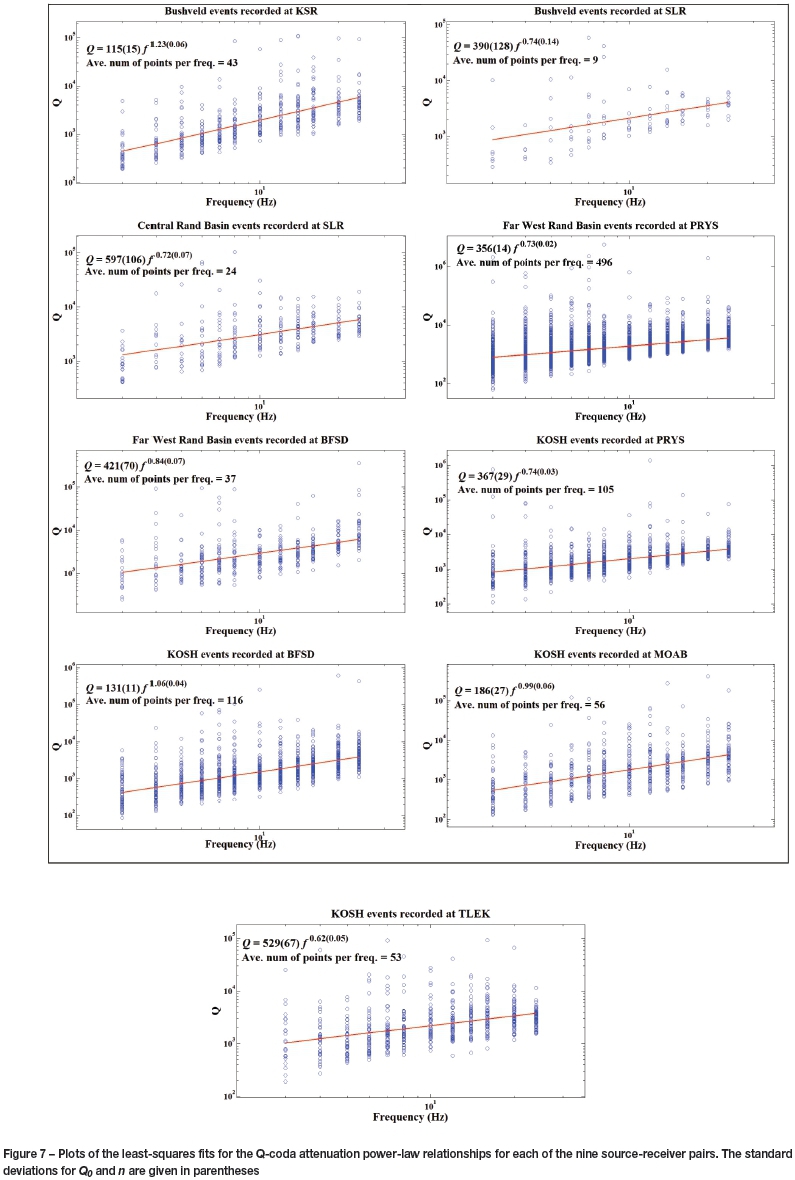
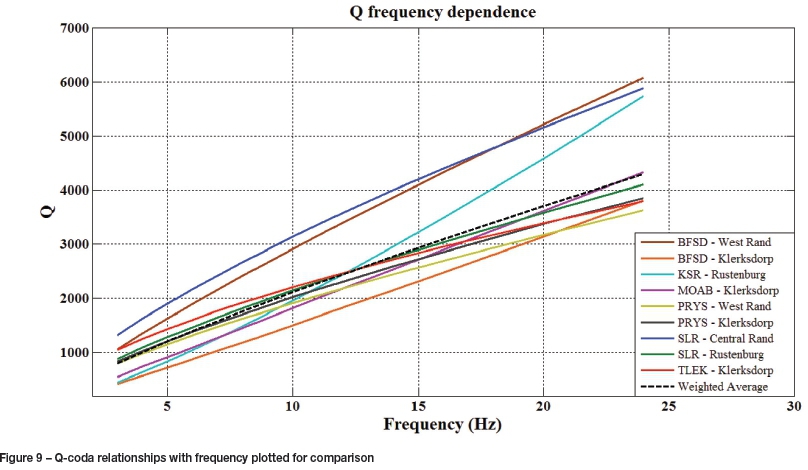
The least-squares fits for the attenuation power-law relationships are plotted in Figure 7, Figure 8 shows the relationships plotted on a geological map of the region.
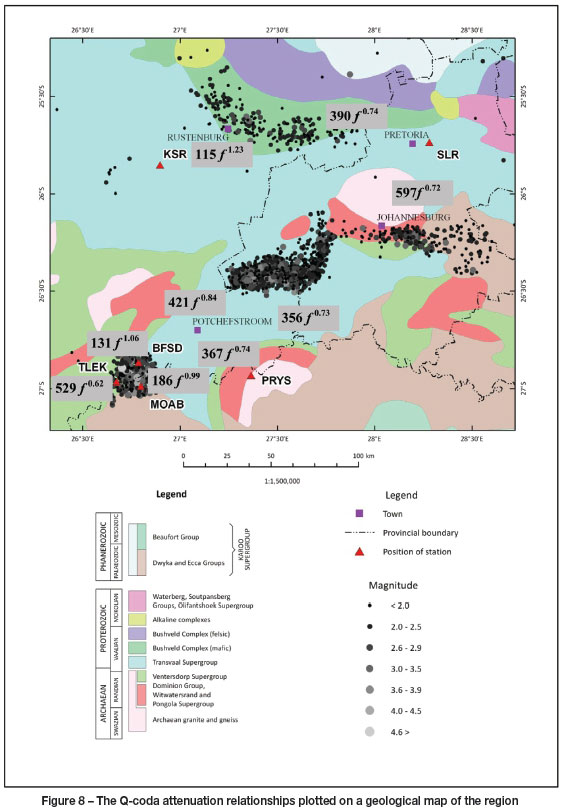
Figure 9 allows for an easier comparison of the results. Apart from three outliers, the curves show good agreement. The pairings of BFSD with data from the West Rand, SLR with data from the Central Rand, and KSR with data from Rustenburg (areas 1, 3, and 5 from Figure 6) deviate from the rest with a much higher quality factor (lower attenuation) in the upper end of the frequency range. This may be attributed to similarities in the geology of the areas, since the Traansvaal Supergroup is prominent in all three sampling volumes. Another possibility is that the stations may be experiencing site effects, which would amplify the ground motion at certain frequencies.
Conclusions
A Q-coda estimation following the single backscattering model of Aki and Chouet (1975) was carried out for nine different source-receiver pairs using seismicity recorded by locally distant stations of the SANSN. Magnitudes of the seismic events ranged from ML1.8 to ML4. Q was calculated for the vertical component of bandpass filtered seismograms at central frequencies of 3, 4, 5, 6, 7, 8, 10, 12, 14, 16, 20, and 24 Hz.
The majority of the results from the individual areas showed good agreement with each other, while three of the nine areas showed a significantly higher Q in the upper end of the frequency range.
The results confirm that a low-attenuation model is suited to this stable continental region, although Q(f) is slightly lower than what was proposed for Norway. A calculation of the weighted average, based on the number of available data, yielded a quality factor vs. frequency power-law relation of Q(f)= 327 f0.81for the study region. We conclude that while the local attenuation may vary significantly, a suitable attenuation model for the region is given by the weighted average of the individual constituents.
References
Aki, K. 1969. Analysis of the seismic coda of local earthquakes as scattered waves. Journal of Geophysical Research, vol. 74, no. 2. pp. 615-631. [ Links ]
Aki, K. and Chouet, B. 1975. Origin of coda waves: source, attenuation and scattering effects. Journal of Geophysical Research, vol. 80, no. 23. pp. 3322-3342. [ Links ]
Bungum, H., Alsaker, A., Kvamme, L.B., and Hansen, R.A. 1991. Seismicity and seismotectonics of Norway and nearby continental shelf areas. Journal of Geophysical Research, vol. 96. pp. 2249-2265. [ Links ]
Gupta, S.C., Teotia, S.S., Rai, S.S., and Gautam, N. 1998. Coda Q estimates in the Koyna Region, India. Pure and Applied Geophysics, vol. 153. pp. 713-731 [ Links ]
Johnson, M.R., Anhaeusser, C.R., and Thomas, R.J. (eds). 2006. The Geology of South Africa. Geological Society of South Africa and Council for Geoscience, Johannesburg/Pretoria. 691 pp. [ Links ]
Kgaswane, E.M., Nyblade, A.A., Durrheim, R.J., Julià, J., Dirks, P.H.G.M., and Webb, S.J. 2012. Shear wave velocity structure of the Bushveld Complex, South Africa. Tectonophysics, vol. 554-557. pp. 83-104. [ Links ]
Langston, C.A. 1989. Scattering of long-period Raleigh waves in Western North America and the interpretation of Coda Q measurements. Bulletin of the Seismological Society of America, vol. 79, no. 3. pp. 774-789. [ Links ]
Lee, W.H.K., Aki, K., Chouet, B., Johnson, P., Marks, S., Newberry, J.T., Ryall, A.S., Stewart, S.W., and Tottingham, D.M. 1986. A preliminary study of coda Q in California and Nevada. Bulletin of the Seismological Society of America, vol. 76, no. 4. pp. 1143-1150. [ Links ]
Ottemôller, L. and Havskov, J. 2003. Moment magnitude determination for local and regional earthquakes based on source spectra. Bulletin of the Seismological Society of America, vol. 93, no. 1. pp. 203-214. [ Links ]
Parvez, I.A., Sutar, A.K., Mridula, M., Mishra, S.K., and Rai, S.S. 2008. Coda Q estimates in the Andaman Islands using local earthquakes. Pure and Applied Geophysics, vol. 165. pp. 1861-1878. [ Links ]
Rautian, T.G. and Khualturin, V.I. 1978. The use of the coda for determination of the earthquake source spectrum. Bulletin of the Seismological Society of America, vol. 68, no. 4. pp. 923-948. [ Links ]
Sato, H. 1977. Energy propagation including scattering effects single isotropic scattering approximation. Journal of Physics of the Earth, vol. 25. pp. 27-41. [ Links ]
Saunders, I., Brandt, M., Steyn, J., Roblin, D., and Kijko, A. 2008. The South African National Seismograph Network. Seismological Research Letters, vol. 79, no. 2. pp. 203-210. [ Links ]
Scherbaum, F. and Kisslinger, C. 1985. Coda Q in the Adak seismic zone. Bulletin of the Seismological Society of America, vol. 75, no. 2. pp. 615-620. [ Links ]
Woodgold, C.R.D. 1990. Estimation of Q in Eastern Canada using coda waves. Bulletin of the Seismological Society of America, vol. 80, no. 2. pp. 411-429. [ Links ]
Yun, S., Lee, W.S., Lee, K., and Noh, M.H. 2007. Spatial distribution of coda in South Korea. Bulletin of the Seismological Society of America, vol. 97, no. 3. pp. 1012-1018. [ Links ]

