


Services on Demand
Article
 English (pdf)
 Article in xml format
 Article references
Indicators

Related links
-
 Cited by Google
 -
 Similars in Google
Share

 Permalink
Journal of the Southern African Institute of Mining and Metallurgy
On-line version ISSN 2411-9717
Print version ISSN 2225-6253
J. S. Afr. Inst. Min. Metall. vol.115 n.6 Johannesburg Jun. 2015
PLATINUM CONFERENCE PAPERS
Crush pillar support - designing for controlled pillar failure
M. du PlessisI; D.F. MalanII
ILonmin Platinum, Marikana, North-West province, South Africa
IIDepartment of Mining Engineering, University of Pretoria, South Africa
SYNOPSIS
The aim of any mine design is to ensure that the excavations remain stable for the period they will be in use. Various pillar systems are used to ensure that underground stopes remain stable and that mining activities do not affect the surface infrastructure through either surface subsidence or seismicity.
Intermediate-depth platinum mines make use of in-stope pillars designed to fail while the pillars are being cut at the mining face. The pillar stress exceeds the loading capacity and the pillars crush as a result.
The aim of the paper is to provide an overview of in-stope crush pillars. This will include the application, behaviour, function, mechanism, impact, and design of a crush pillar system.
Keywords: crush pillars, controlled failure, limit equilibrium model, pillar layout
Introduction
Safe mining practices are aimed at maximizing the extraction of a particular orebody. Mine stability is a key consideration and the type of layout (i.e. pillar type and spans) must be suitable for the prevailing rock mass conditions. Crush pillar mining appears to be a method unique to South African hard rock mines, with the pillar system being applied to shallow and intermediate-depth gold and platinum orebodies. It allows for a higher extraction than what can typically be achieved with a conventional rigid/elastic non-yielding pillar system. The crush pillar system must, however, be used in conjunction with a barrier pillar system. The crush pillar dimensions are generally selected to give a width to height ratio (w.-h) of approximately 2 (Ryder and Jager, 2002). This w-.h ratio is selected to ensure that the pillars fail as they are being cut at the mining face. Once the pillar has failed in a stable manner, the residual strength of the pillar contributes to the required panel support by carrying the deadweight load to the height of the uppermost parting on which separation is expected to occur. Closely spaced support elements are typically used between adjacent rows of pillars to provide additional in-panel support.
Ozbay and Roberts (1988) suggested that crush pillars should be implemented at depths greater than 400 m below surface. This is based on the assumption that the average face stress at this depth is large enough to enable crushing of the pillars.
In contrast to stable pillar layouts, failure of crush pillars is in fact desired as long as it occurs in a controlled manner. Pillar failure and the resulting load-shedding should ideally be continuous to prevent accumulation of elastic strain energy.
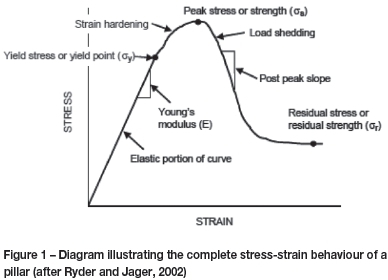
Figure 1 is an illustration of the stress-strain relationship of a typical pillar. The initial straight line portion of the curve up to the yield point reflects the elastic response of the pillar. The yield point indicates the onset of inelastic behaviour, whereafter the pillar exhibits strain hardening until it reaches its peak strength. Load shedding then follows until the pillar reaches its residual strength. Crush pillars are designed to function in this residual part of the pillar stress-strain curve.
Historic use and design of Merensky crush pillars
RPM (Rustenburg Section) was the first platinum mine reported to have used crush pillars (Ozbay et al., 1995). Crush pillars were implemented as early as 1974 on Frank Shaft (now Khomanani Mine) and RPM (Union Section) in 1977 (Korf, 1978). The pillar system was introduced to prevent back breaks as a result of large spans created when the support method was changed from stonewalls (1927) to stonepacks to crush pillars (1974) as mining progressed deeper. Interestingly enough, none of the platinum mine crush pillar sites investigated by Ozbay (1995) made use of barrier pillars in conjunction with the crush pillars.
Crush pillar layouts were initially designed using pillar dimensions that were successful in other areas. The pillar dimensions and spacings were then adjusted until the pillars exhibited the required behaviour (Ozbay et al., 1995). The typical range of w:h ratios of the crush pillars varied between 1.5 and 2.5. This accommodated the varying stoping widths (0.9 m to 2 m), the weak footwall rock in some areas, and structural weaknesses in the rock. An alternative design approach was to cut the pillar at a w:h ratio of 2 and then increase or decrease the pillar width until crushing was achieved.
Ozbay et al. (1995) stated that the main purpose of the crush pillars was to provide enough resistance to support the rock up to the highest known parting plane (i.e. the Merensky Bastard reef contact at a height of 5-45 m), and not to support the full overburden rock mass to surface. The load requirement of a crush pillar to function as local support can be established by determining the support resistance required, which is dictated by the height of the prominent parting. Support resistance in the order of 1 MPa is quoted (Roberts et al., 2005a), based on the back-analysis of back breaks that occurred at Randfontein Estates and Northam Platinum, where the failures took place at 40 m and 30 m into the hangingwall respectively. Parting heights of 10 m and 20 m would result in a support resistance requirement of approximately 0.3 MPa and 0.6 MPa respectively.
Typical crush pillar layouts
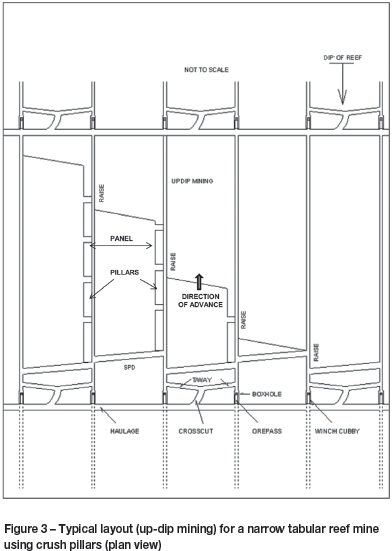
A typical mining configuration for a crush pillar layout consists of pillars being positioned either adjacent to raises/winzes (dip mining) or strike gullies (breast mining). The pillars are separated in the direction of mining by a holing to allow for either ventilation (vent holing) or to increase extraction (pillar holing). Crush pillar layouts typically consist of approximately 30-33 m wide panel spans (inter-pillar) with slender pillars 2 m, 2.5 m, 3 m, or 4 m wide and 3 m, 4 m, or 6 m in length. The pillars are separated by 0.5 m to 3 m wide holings. In some instances a siding is mined adjacent to the raise or gully to ensure that the failed pillar material does not fall into the travelling way. These sidings are approximately 2-2.5 m deep and are carried a maximum of either 3 m or 6 m behind the panel face (depending on the standard applied by the mining company). Figure 3 is an example of a typical up-dip crush pillar layout. An off-reef haulage links to the reef horizon via a crosscut and a travelling way.
Uncertainty regarding pillar behaviour and design
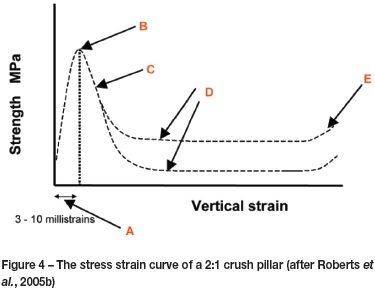
The measured and observed behaviour of a 2:1 Merensky crush pillar is summarized in Figure 4 and Table I. Based on stress measurements, Roberts et al. (2005b) determined that a crush pillar reaches its peak strength at between 3 and 10 millistrains, then fails following a further compression of approximately 5 millistrains along an estimated negative post-peak stiffness slope of 12 GN/m. Following further compression to the extent of 50-90 millistrains, it is assumed that footwall heave occurs as a result of the lateral confinement of the foundation. At this point it is assumed that the crushing of the foundation restricts the pillar's load capacity as the pillar is reliant on the foundation, which is believed to be the limiting load-bearing component. Further compression could result in an increase in the contact friction angle; the result is a 'squat effect' with the slope of the stress-strain curve becoming positive. This is assumed to occur when the vertical strain is > 0.4.
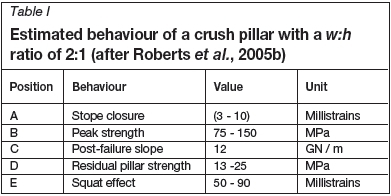
The value of the peak pillar strength is unknown. The values quoted above are based on estimates as described by Ryder and Ozbay (1990).
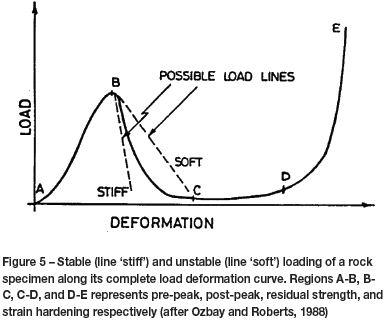
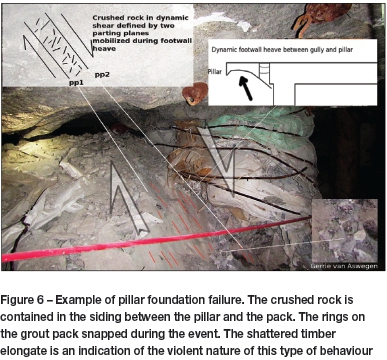
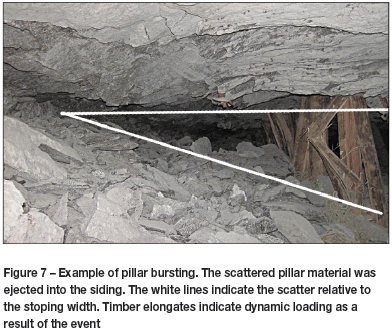
On most mining operations, the design of the crush pillars is based on trial and error. As the pillar strength is unknown, the pillar sizes are adjusted to obtain the correct behaviour. Several factors affect the behaviour of the crush pillars, and in many cases satisfactory pillar crushing is not achieved. This results in a seismic hazard in many of the mines using crush pillars. If pillar crushing does not occur, once these pillars move to the back area of a stope, some pillars may burst while oversized pillars may punch into the footwall. If pillars are designed in such a way that they are fractured during cutting by the face abutment stresses so that the pillars will already have yielded and reached their residual strength, further compression of the pillars will be associated with an increase in load and stability will be ensured, (Ozbay and Roberts, 1988). The stiffness of the strata must therefore be greater than the post-peak stiffness of the pillar (Figure 5) or violent pillar failure and hangingwall instability will occur (Figure 6 and 7). The pillar design should be aimed at determining pillar dimensions for which the post-peak curve of the pillar is as flat as possible.
There are many factors influencing the behaviour of crush pillars. These factors affect the ability of the pillar to crush as well as the reaction of the strata in response to the pillar when entering a post-peak state. Some of the contributing factors are:
➤ Mining depth (stress)
➤ The mining height and pillar size (w:h ratio)
➤ Stope layouts, including the position of the pillars and presence of a siding
➤ Strata stiffness and the influence of mining losses (i.e. potholes or unmined ground) or regional pillars
➤ Strength of the pillar foundation relative to the pillar strength and load applied
➤ Peak and residual pillar strength
➤ Mining discipline resulting in over- or undersized pillars.
Evaluation of parameters that govern crush pillar behaviour
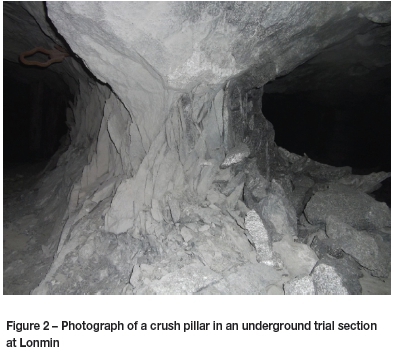
During the past four decades, several parameters have been studied in an attempt to better understand and predict the behaviour of crush pillars. Crush pillar layouts have, however, remained essentially unchanged over this period. To assess some of the key parameters as outlined in the previous section, a simplified model has been derived to investigate some of the parameters governing crush pillar behaviour. The approach applied and results achieved are expanded on in the subsequent sections of the paper. The aim is to understand the impact of these parameters on crush pillar behaviour. All of the results are preliminary and must be substantiated by underground observations and measurement. A trial is being conducted at Lonmin Platinum to calibrate the model and validate the preliminary findings.
Formulation of the limit equilibrium model
Malan and Napier (2006) represented the force equilibrium of a material 'slice' of a fractured pillar as shown in Figure 8. The slice of fractured material has a mining height H at a distance x from the stope face. The slice is confined by reef-parallel and reef-normal stress components os and σηrespectively, as well as by shear tractions, τ. It is assumed that the edge of the pillar is at x = 0 and that the seam-parallel stress component is uniform over the height of the pillar and increases as x increases. From Figure 8 it can be inferred that the equilibrium force balance acting on the slice of height H and unit out of plane width requires that:

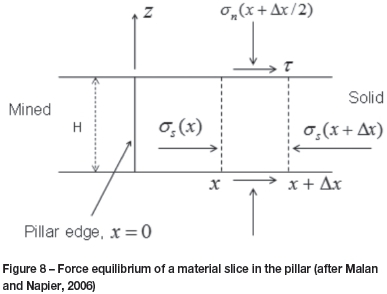
Following integration and the application of assumptions and substitutions for and τ, the following expressions were derived by Malan and Napier (2006) to express the average horizontal and vertical stress values for a failed pillar.
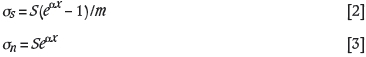
with α=2μm/Η, μ=tan φ the frictional coefficient, S the cohesion, and m a strengthening parameter. No allowance is made for roof or floor foundation failure and the stress components increase exponentially from the pillar edge. As pointed out by Salamon et al. (2003), a Mohr-Coulomb plasticity model without strain-softening behaviour is inadequate for simulating actual pillar behaviour where rapid load-shedding or 'bursting' may occur. To address this shortcoming, it is assumed that initial failure in the seam or reef is controlled by the additional relationship:

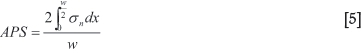
where S0 and m0 represent the intact strength of the pillar material. Equation [4] can be used to implicitly determine the boundaries between the intact pillar core and the failed edge regions. Equation [3] predicts an exponential increase in the pillar stress away from the edge towards the centre of the pillar. If the pillar width is w and if the pillar is completely failed, assuming that the stress profile is symmetric about the centre of the pillar, the average stress in the pillar (APS, average pillar stress) is given by:
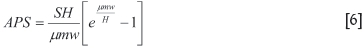
Substituting Equation [3] into [5] and following the integration of Equation [5], the average pillar stress is expressed by the following relationship (Du Plessis et al., 2011):
Simulation of crush pillar behaviour
The evaluation of an analytical limit equilibrium model to simulate crush pillar behaviour was described by Du Plessis et al. (2011). The values predicted by this model were compared to the numerical values obtained from the TEXAN (Tabular EXcavation ANalyzer) simulations. Good correlation was obtained and this serves as a useful validation of the model implemented in the numerical code. In general, the limit equilibrium model appears to be very attractive for simulating pillar failure as the gradual crushing of the outside of the pillar and the transfer of stress to the intact core can be replicated.
Du Plessis and Malan (2012) indicated that the analytical solution derived by the author provided a reasonable fit to the underground crush pillar stress measurements conducted by Watson (2010).
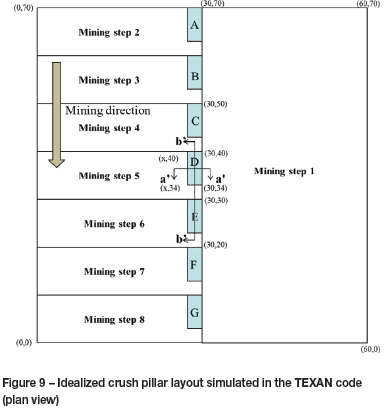
The impact of pillar width on crush pillar behaviour was investigated by simulating an idealized crush pillar layout (Figure 9) in the TEXAN code. The layout consists of a 30 m χ 70 m stope panel with a second panel being mined in a sequential fashion adjacent to this first panel. The layout was simulated as eight mining steps with seven crush pillars being formed in this process. For the second panel, the size of each mining step was 10 m and the sizes of the crush pillars were varied to obtain the required w:h ratio. Furthermore, mining heights of both 1 m and 2 m were used to compare the impact of pillar width for a constant w:h ratio on pillar crushing. The element sizes used were 0.5 m.
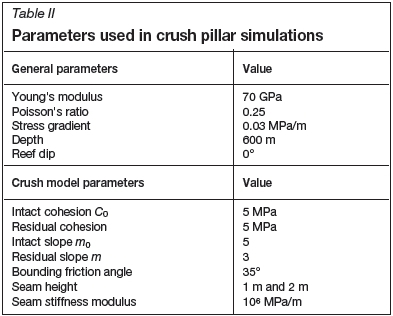
The parameters used for the simulations are shown in Table II. Note that these values were chosen arbitrarily and a better calibration of this model based on underground measurements will be required in the future. For pillars simulated with a w:h = 2:1 it appears as if these original parameters used to test the simulation of pillar crushing with a limit equilibrium model (Table II) are very conservative and at the upper limit ensuring that pillar crushing is achieved for the simulations carried out (Du Plessis and Malan, 2012).
Results from numerical simulations
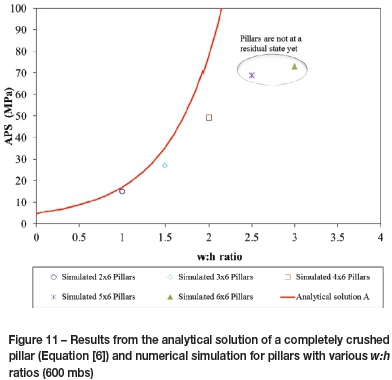
Figure 10 indicates the TEXAN modelling results for the various layouts simulating the effect and behaviour of different pillar widths (w:h ratios). All of the results are for pillar D formed in mining step 5. The residual (for smaller w:h range pillars) and peak stress (for larger w:h range pillars) as highlighted in Figure 10 are re-plotted in Figure 11. This compares the results of the numerical analysis and the analytical solution for the same set of input parameters. Note that the larger w:h range pillars did not reach a residual state and therefore the peak stresses of these pillars were used, as highlighted.
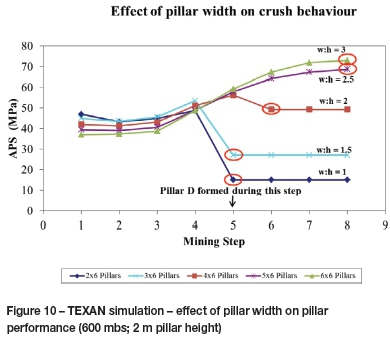
The preliminary numerical analyses indicated that the pillars with a w:h >2.0 were not yet in a crushed state (at 600 mbs). The 4 m wide pillar (w:h = 2:1) did experience late crushing. Comparative simulations indicated that crush pillars with a w:h ratio of 2 implemented at depths shallower than 600 m will most likely not crush (Du Plessis and Malan, 2012). The simulated pillar behaviour indicated that once the peak strength of a pillar is reached, the stress increase causes complete failure of the core of the pillar and the pillar then moves to a residual state (also shown in Figure 15). Oversized pillars that are typically encountered underground either do not crush or fail violently in the back area. The study highlighted a key attribute of the limit equilibrium models: the pillar stress increases in an exponential fashion towards the centre of the pillar. This may lead to to the formation of unduly high stresses in the core of wide pillars. The simulated results indicated that the cores of these oversized pillars were still intact. As the oversized pillars did not crush at the face when being cut, these pillars move into the back area as the mining face advances. In the back area, the pillar is at a higher stress. The change in stress caused by a mining increment is lower than when the pillar is formed at the face. The pillar may therefore either not crush (particularly when oversized) or fail violently, as the stresses on these pillars are much higher and the loading environment has become much softer as the pillar is no longer close to the face abutment. The slope of the post-peak load deformation relationship becomes flatter with increasing w:h ratios (Salamon and Oravecz, 1976). Salamon predicted that the softest loading system (strata stiffness) will present the greatest danger of uncontrolled failure
The analytical solution of a completely crushed pillar, as indicated in Figure 11, provides a two-dimensional solution (infinitely long pillars) to a three-dimensional problem. If very long pillars are simulated in TEXAN, the residual pillar stress of the failed pillars moves closer to the analytical solution (pillars with w:h < 2:1). The residual pillar stress of these failed pillars touches or lies just below the analytical solution curve.
Assessing pillar behaviour
Figure 10 and 11 indicate that pillars of different dimensions (w:h ratio) behave differently. There are limiting factors affecting pillar crushing which include pilllar width, mining depth, regional stability (presence of geological structures), pillar length, etc. It is important to understand which underlying factors play a role and how they affect the behaviour of crush pillars. In this paper some of these characteristics will be highlighted by determining the governing trends.
Figure 12 combines the results of the numerical simulations and the analytical solution. Note that the numerical simulation considered that the pillar is initially part of the solid rock mass, and is then formed by the approaching mining face, in order to establish how the pillar behaves precutting whilst being formed at the face and post-cutting as it moves into the back area as the mining face continus to advance. Figure 12 was compiled to establish how the state of stress of each cut pillar changes and compares in relation to the analytical solution during this pillar-forming stage. The behaviour of each pillar is indicated by the arrows representing the stress relation as a result of mining. The range includes the initial state of stress (after mining step 1), the increase in stress as the pillar is formed (towards the maximum), and where applicable the reduction in pillar stress to the residual state (pillar crushing). From Figure 12 it is apparent that the stress range of the larger pillars (w:h > 2:1) is situated far below the analytical solution.
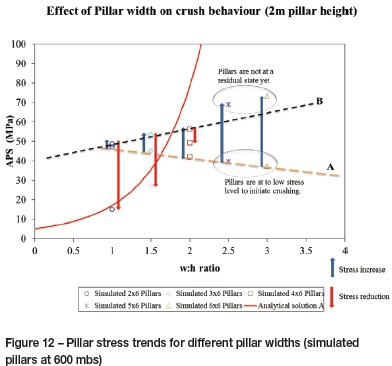
Line A represents the initial pillar stress (all pillars) and line B the peak pillar stress (for the failed pillars only). From the figure it is clear that the pillars with a larger width-to-height ratio (i.e. w:h > 2:1) are at a much lower initial stress. The pillars are therefore able to absorb the change in stress as they are formed and mining progresses. The state of peak pillar stress is therefore not reached and pillar crushing is not achieved. For these pillars a much higher level of initial stress is required.
As mentioned earlier, various factors affect the initial stress state of the rock mass and pillar. These include pillar width, mining height, mining depth, pillar length (width-to-length ratio >5), and the presence of geological structures (regional stability).
Figure 13 compares the stress profile from the edge of pillar D, over the pillar holing and ahead of the mining face, for both a 1 m and 2 m mining height (for mining step 5). For a lower mining height, a narrower pillar is required to maintain the same w:h ratio. As mentioned, late pillar crushing was achieved for the the 4 m wide pillar (2 m stoping height; SW = 2). The 2 m wide pillar (1 m stoping height; SW = 1) did experience pillar crushing while the pillar was being formed at the mining face (also refer to Figure 14, which compares the stress change per mining step). In both cases, significantly large face stresses were achieved in the region approximately 2 m ahead of the mining face. These were sufficiently large to initiate early pillar crushing while the pillar was being formed at the face. This is, however, not the case for larger pillars with w:h > 2:1. Lower pillar edge stress is achieved for the pillars with larger w:h ratios (110 MPa for a pillar with w:h = 3:1 compared to 189 MPa for pillar with w:h = 2:1). This effect is highlighted in Figure 12 and Figure 15.
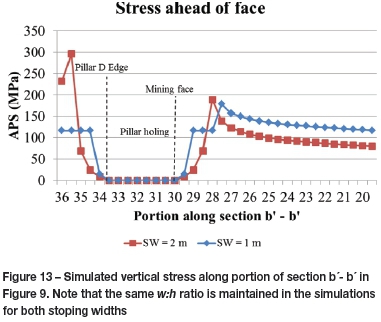
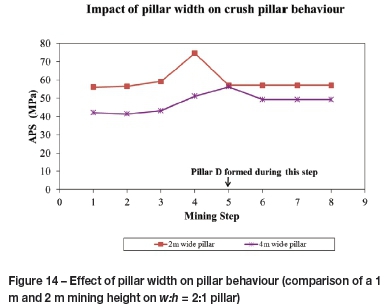
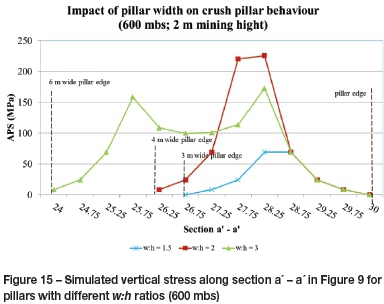
Figure 15 indicates the exponential stress increase towards the centre of the pillar. This could, however, lead to excessively high stresses in the cores of wide pillars where a crushed state is not reached. Note that the stress profile for the w:h = 2:1 pillar is for mining step 5 and just before the pillar completely crushes and moves to a residual state in mining step 6 (refer to Figure 14, which indicates the stress sequence as a result of mining). At this point the pillar has completely crushed from the outside towards the centre of the pillar. The pillar core also reaches a maximum stress limit, after which complete failure of the pillar is reached and the pillar moves to a residual state (as can be seen for a w:h = 1.5 pillar). As mentioned, the core of an over-sized pillar does not reach this maximum stress limit and remains intact.
Considering the aforementioned factors influencing the stress state of a pillar, a zone defining possible pillar crushing can be identified. Figure 16 distinguishes between zone 1 (pillar crushing) and zone 2 (no pillar crushing). The window for achieving pillar crushing therefore becomes smaller as the pillar width increases (as indicated by zone 1 pinching out at a w:h of approximately 2.5). Line C defines a possible linear extrapolation of the anticipated residual pillar stress. In theory, the residual state of the pillar should coincide with the curve representing the analytical solution. The amount of stress change required per increment of mining for these large pillars does, however, become substantial. As indicated by the results of the numerical modelling, pillar crushing is typically not achieved by these larger pillars. Although the pillars are at a higher stress, the incremental stress increase reduces as the pillars move towards the back area (refer to Figure 10). A critical stress level is therefore not reached whereby the pillars crush completely (the pillar core remains intact).
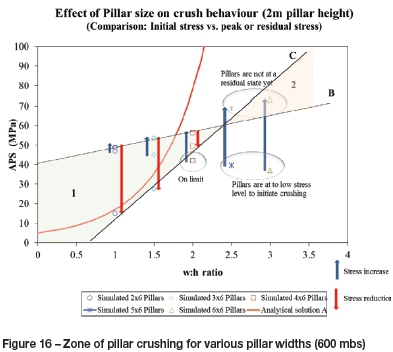
This highlights the importance of crush pillars requiring a sufficiently high initial stress level to ensure that the pillar can fail throughout and move to a residual state. The peak strength of the pillar must be exceeded while the pillar is close to the mining face to cause complete failure of the core. It is for this reason that the analytical solution may be of practical use only for pillars with low width-to-height ratios (w:h approx. 2:1). Numerical simulations conducted for pillars with w:h > 2.5 indicated that the pillars did not crush even at 1000 m below surface. The wider pillars are therefore able to absorb the change in stress as the pillar is formed and mining progresses. In the back area the change in stress per mining increment decreases and the pillar core remains solid.
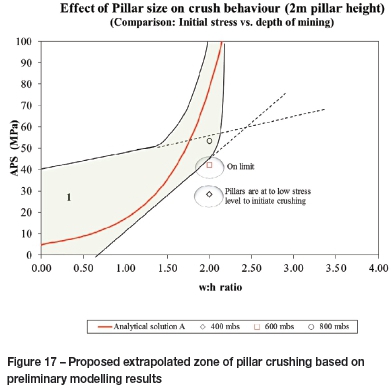
From the preliminary results obtained, it is hypothesized that the zone of pillar crushing can essentially be extended as indicated in Figure 17. The cut-off zone extends just beyond a pillar w:h ratio of 2 and stretches towards the analytical solution curve. This is based on numerical simulation for various scenarios including mining depth, pillar width, pillar height, and the impact of infinitely long pillars.
Conclusion
This paper provides a general overview of crush pillars. Although the function of crush pillars is well understood (the residual state of the pillar must support the deadweight to the uppermost unstable parting), the behaviour of pillars in underground mines is, in some instances, unpredictable, resulting in pillar seismicity. Although the concept that the pillar design should be aimed at determining pillar dimensions for which the post-peak curve of the pillar is as flat as possible is widely accepted, several factors influence the ability of a pillar to enter a residual state while the pillar is being formed at the mining face. If the pillar does not crush while in close proximity to the stiff face abutment, the transition to a soft loading environment as the pillar moves into the back area could cause the pillar to fail violently.
A derived limit equilibrium model and its implementation in a numerical boundary element code were used to predict the potential residual state of crush pillars. This included simulating an idealized crush pillar layout to determine the stress of a crush pillar prior to formation (while still part of the mining face), when cut at the face, and when the pillar is in the back area of a stope as the mining face advances.
The results indicate that there are many factors affecting pillar crushing, including pillar width, mining depth, mining height, regional stability, and pillar length. These factors have an impact on the initial stress state of the pillar. The comparative simulations indicated that a pillar with a w.h > 2:1 may not crush completely and could pose a seismic risk in the back area of a stope. Furthermore, the initial stress required to ensure the crushing of a 2:1 pillar core is achieved only at mining depths greater than 600 m below surface. The peak strength of the pillar must be exceeded while the pillar is close to the mining face to cause complete failure of the pillar core. It is for this reason that it is envisaged that the analytical solution might be of practical use only for pillars with low width-to-height ratios. A zone of pillar crushing exists around the analytical solution curve. The window for pillar crushing, however, decreases as the pillar width increases and is influenced by the initial stress state of the pillar. Mining losses such as potholes also affect the initial stress state of crush pillars in close proximity to these geological structures. The influence of potholes was also simulated in order to to understand the impact on crush pillar behaviour, but the results are not presented in this paper.
It should be emphasized that all of these results and conclusions are based on the parameters assumed for the limit equilibrium model. Regarding further work, rock testing is required to determine the post-peak properties and behaviour of the Merensky Reef. This will improve the confidence in the derived analytical solution as a tool for estimating the residual strength of crush pillars. Furthermore, underground measurements are required to back-analyse the crush pillar behaviour and calibrate the model. A trial mining site using crush pillars has been established at Lonmin Platinum.
Acknowledgement
The work described in this paper forms part of the PhD study of Michael du Plessis at the University of Pretoria. The contribution of Dr John Napier with regards to the development of the limit equilibrium model as well as the TEXAN code is greatly appreciated.
References
Du Plessis, M. Malan, D.F. and Napier, J.A.L. 2011. Evaluation of a limit equilibrium model to simulate crush pillar behaviour. Journal of the Southern African Institute of Mining and Metallurgy, vol. 111, no. 12. pp. 875-885. [ Links ]
Du Plessis, M. and Malan, D.F. 2012. The simulation of crush pillar behaviour in the tabular layouts of the Bushveld Complex. Proceedings of Eurock 2012, Stockholm, Sweden, 28-30 May 2012. International Society for Rock Mechanics. [ Links ]
Korf, C.W. 1978. Stick and pillar support on Union Section, Rustenburg Platinum Mines, Association of Mine Managers of South Africa. pp. 71-82. [ Links ]
Malan, D.F. and Napier, J.A.L. 2006. Practical application of the TEXAN code to solve pillar design problems in tabular excavations. SANIRE2006 Symposium - Facing the Challenges, Rustenburg, South Africa. South African National Institute for Rock Engineering. pp. 55-74. [ Links ]
Ozbay, M.U., and Roberts, M.K.C 1988. Yield pillars in stope support. Proceedings of the SANGORM Symposium in Africa, Swaziland. South African National Group on Rock Mechanics, Johannesburg. pp. 317-326. [ Links ]
Ozbay, M.U., Ryder, J.A., and Jager, A.J. 1995. The design of pillar systems as practiced in shallow hard-rock tabular mines in South Africa. Journal of the South African Institute of Mining and Metallurgy, vol 95, no. 1. pp. 7-18. [ Links ]
Roberts, D.P., Roberts, M.K.C., and Jager, A.J. 2005a. Alternative support systems for mechanised stopes, PlatMine project report 2004-0189. Miningtek Division, CSIR, Johannesburg. [ Links ]
Roberts, D.P., Roberts, M.K.C., Jager, A.J., and Coetzer, S. 2005b. The determination of the residual strength of hard rock crush pillars with a width to height ratio of 2:1. Journal of the South African Institute of Mining and Metallurgy. vol. 105. pp. 401-408. [ Links ]
Ryder, J.A. and Jager, A.J. 2002. A Textbook on Rock Mechanics for Tabular Hard Rock Mines. Safety in Mines Research Advisory Committee (SIMRAC), Johannesburg. pp 287, 298-299. [ Links ]
Ryder, J.A. and Ozbay, M.U. 1990. A methodology for designing pillar layouts for shallow mining. International Symposium on Static and Dynamic Considerations in Rock Engineering, Swaziland, 10-12 September 1990. International Society for Rock Mechanics. [ Links ]
Salamon, M.D.G. and Oravecz, K.I. 1976. Rock Mechanics in Coal Mining. Coal Mining Research Controlling Council. Chamber of Mines, Johannesburg. [ Links ]
Salamon, M.D.G., Badr, S., Mendoza, R., and Ozbay, M.U. 2003. Pillar failure in deep coal seams: numerical simulation. Proceedings of the 10th Congress of the International Society for Rock Mechanics. South African Institute of Mining and Metallurgy, Johannesburg. pp. 1011-1018. [ Links ]
Watson, B.P. 2010. Rock Behaviour of the Bushveld Merensky Reef and the Design of Crush Pillars. PhD thesis, School of Mining Engineering, University of the Witwatersrand, Johannesburg, South Africa. [ Links ]

