


Services on Demand
Article
 English (pdf)
 Article in xml format
 Article references
Indicators

Related links
-
 Cited by Google
 -
 Similars in Google
Share

 Permalink
Journal of the Southern African Institute of Mining and Metallurgy
On-line version ISSN 2411-9717
Print version ISSN 2225-6253
J. S. Afr. Inst. Min. Metall. vol.115 n.5 Johannesburg May. 2015
GENERAL PAPERS
Unplanned dilution and ore loss prediction in longhole stoping mines via multiple regression and artificial neural network analyses
H. Jang; E. Topal; Y. Kawamura; Synopsis
Department of Mining Engineering and Metallurgical Engineering, Western Australian School of Mines, Curtin University, Australia
SYNOPSIS
Unplanned dilution and ore loss directly influence not only the productivity of underground stopes, but also the profitability of the entire mining process. Stope dilution is a result of complex interactions between a number of factors, and cannot be predicted prior to mining. In this study, unplanned dilution and ore loss prediction models were established using multiple linear and nonlinear regression analysis (MLRA and MNRA), as well as an artificial neural network (ANN) method based on 1067 datasets with ten causative factors from three underground longhole stoping mines in Western Australia. Models were established for individual mines, as well as a general model that includes all of the mine data-sets. The correlation coefficient (R) was used to evaluate the methods, and the values for MLRA, MNRA, and ANN compared with the general model were 0.419, 0.438, and 0.719, respectively. Considering that the current unplanned dilution and ore loss prediction for the mines investigated yielded an R of 0.088, the ANN model results are noteworthy. The proposed ANN model can be used directly as a practical tool to predict unplanned dilution and ore loss in mines, which will not only enhance productivity, but will also be beneficial for stope planning and design.
Keywords: stoping, unplanned dilution, ore loss, artificial neural network
Introduction
In recent years, stoping methods have been magnified as an extraction strategy in underground hard rock mining. According to a report from Austrade (2013), in 2013 70% of underground metal mines in Australia utilized open stoping, sublevel stoping, various narrow stoping methods, and other types of stoping and caving methods to extract ore. In addition, 51% of underground metal production in Canada relies on open stoping methods (Pakalnis et al., 1996). A disadvantage of popular stoping methods is that many mines are severely affected by dilution problems. Pakalnis (1986) surveyed 15 open stope Canadian mines and concluded that 47% of the operations suffered from more than 20% dilution. Likewise, Henning and Mitri (2007) reported that approximately 40% of open stoping operations in Canada suffered from 10% to 20% dilution.
Dilution can be defined as 'the contamination of ore with lower grade material', and it can be generally classified into two categories: planned and unplanned. Planned dilution, also referred to as primary or internal dilution, is contamination by low-grade material within the ore block; whereas unplanned dilution, also known as secondary or external dilution, is contamination by lower grade material exterior to the ore block. Both of these dilute the ore stream value. Ore loss can similarly be classified as planned and unplanned. Planned ore loss represents the ore-grade material that has been excluded from the mining block at the stope design stage, whereas unplanned ore loss is the part of the mining block that remains in the stopes after mining.
This study includes unplanned dilution and ore loss, which can be attributed to as over- and underbreak in underground stoping production. These phenomena can be divided into dynamic and quasi-static types; the quasi-static type occurs after blasting, while the dynamic type occurs immediately (Mandal and Singh, 2009). The dynamic over- and underbreak types are the main interest of this study, and a new terminology, 'uneven break' (UB), is used to identify it. To extend the definition of dilution, UB can be defined as the tons of mined unplanned dilution (positive) or ore loss (negative) per ton of ore mined, expressed as a percentage.
UB rate = (tons of unplanned dilution or oreloss/tons ore mined) x 100 [1]
UB affects not only the safety of the workforce and machinery, but is also severely detrimental to the viability of the operation throughout all of the mining stages. It directly downgrades the ore and causes unnecessary mucking, haulage, crushing, hoisting, and milling activities, thus decreasing productivity. Despite these effects, current UB management relies on previous production results from similar stopes and veteran engineers' intuitions. UB has been considered an unavoidable and unpredictable phenomenon in practice due to the extremely complex mechanism of interaction between the many causative factors.
In this study, new UB prediction models are established through multiple linear and nonlinear regression analysis (MLRA and MNRA) as well as an artificial neural network (ANN) method. The data was collected from three underground longhole stoping mines in Western Australia. The UB prediction models were established for individual mine sites. Moreover, entire data-sets were used to propose a general model to predict UB. The proposed models are compared with actual stope dilution and the current UB predictions for mines.
Overview of unplanned dilution and ore loss in stoping
Unplanned dilution and ore loss directly affect the profitability of mining and are the most critical factors affecting the economics of underground stoping. The importance of unplanned dilution and ore loss control has been emphasized by many researchers. Tatman (2001) reported that reducing unplanned dilution is the most effective way to increase mine profits, and Henning and Mitri (2008) stressed the significant influence of unplanned dilution on the profitability of mining operations. More specifically, in 2008, Stewart and Trueman (2008) reported that unplanned dilution costs A$25 per ton, compared with A$7 per ton for mucking and haulage, and A$18 per ton for milling in typical narrow-vein longhole stoping operations. Suglo and Opoku (2012) conducted a study on Kazansi Mine and calculated the financial loss from unplanned dilution during 1997 to 2006 at US$45.98 million. In 2002, US$11.30 million was spent to control unplanned dilution at the Konkola Mine in Zambia (Mubita, 2005).
Previous studies on unplanned dilution and ore loss control
Unplanned dilution and ore loss have been investigated by many researchers, but a practical prediction model that considers a broad range of causative parameters has not been introduced until now. Most of the previous studies have attempted to discover the relationship between unplanned dilution and a few particular causative factors.
Germain and Hadjigeorgiou (1997) used simple linear regression to analyse stope overbreak at the Louvicourt Mine in Canada. The stope performances were recorded by a cavity monitoring system (CMS), and the actual stope geometries and blasting patterns were recorded. The authors concluded that the relationship between stope performance and other dependent parameters is very complex, and the correlation coefficient (R) values for the powder factor and Q-value were only -0.083 and 0.282, respectively. Despite this data, the stope volume showed a moderate positive correlation with the ratio between stope volume and its real surface area (RVS).
Wang et al. (2002) found that dilution was greater for a parallel drilling pattern than for a fanned pattern, while Clark and Pakalnis (1997) reported that dilution tended to increase when blast-holes fanned out. Stewart (2005) demonstrated the difficulties of predicting unplanned dilution by comparing the conflicting results; opposing observations on the unplanned dilution problem are common and evident when an aspect of the unplanned dilution problem is restricted to a few causative parameters.
Henning and Mitri (2007) used a three-dimensional elastic-plastic numerical analysis program (Map3D) to examine the influence of depth, in-situ stress, and stope geometry on the stope wall overbreak. The authors considered two criteria: the area of zero tensile strength (σ3= 0) and the tensile strength of the rock mass (σ3= σt). The contour of the relaxation zone (σ3= 0) remained nearly constant, while the potential overbreak associated with the rock mass tensile strength increased with depth for a given stope geometry or hangingwall dip. Subsequently, the influence of the mining sequencing on blast-hole stoping dilution was studied (Henning and Mitri, 2008) in 172 sequentially mined longhole stopes. The authors concluded that the overbreak significantly increased in stopes that had one or more backfilled walls.
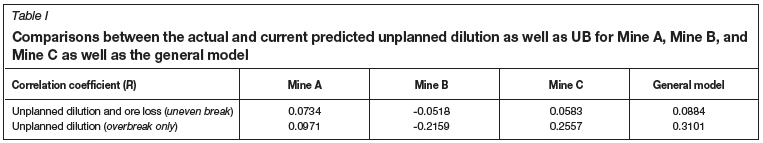
Recently, the stability graph method (Mathews et al., 1981; Potvin, 1988) has been commonly used to design and manage stope stability. The stability graph method is a useful tool for constructing a site-specific database, and some authors have indicated that it may facilitate stope dilution prediction (Diederichs and Kaiser, 1996; Pakalnis et al., 1996). Despite of the popularity of the stability graph method, some limitations have been pointed out by several researchers. Martin et al. (1999) stated that the far field stress with respect to the stope orientation has not been considered. In addition, Potvin and Hadjigeorgiou (2001) noted that the method is not appropriate for controlling rockburst conditions. Furthermore, the method does not consider any blasting factors, induced stress by stope developing sequences, and the exposure time of the stope wall. Essentially, the UB could not be predicted in practice using the stability graph method itself. For instance, the stability graph method was also used at the three mines in the current investigation as a guideline for stope design and a tool to predict unplanned dilution. The predicted performances are shown in Table I.
As shown in Table I, the UB predictions were extremely unsatisfactory and were limited to only unplanned dilution, but not ore loss. In addition, comparisons between the actual and current predicted unplanned dilution as well as the current UB predictions for the general model are shown in Figure 1.
Despite significant research effort, UB is still considered an unpredictable phenomenon. This study provides an optimistic perspective on predicting the potential UB using the advanced artificial neural network method.
Factors that influence unplanned dilution and ore loss
UB can be defined as a dynamic-type over- and underbreak that corresponds to unplanned dilution and ore loss. Numerous interacting factors affect UB. Thus, the mechanism underlying UB cannot be properly analysed based only on a single causative factor or a group of factors, but it is imperative to consider the entire range of factors that may contribute.
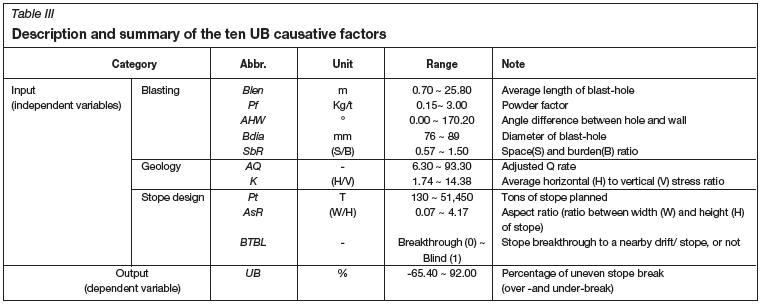
Several researchers (Clark, 1998; Henning and Mitri, 2007; Mathews et al., 1981; Mubita, 2005; Potvin, 1988; Stewart, 2005; Tatman, 2001; Villaescusa, 1998; Yihong and Weijin, 1986) have indicated that the factors that are likely to cause unplanned dilution and ore loss can be divided into three core groups with one subsidiary group (i.e. blasting, geological, stope design, and human error and others). Certain representative recommendations were classified into four groups and are summarized in Table II.
Different terminology has been used by various investigators, but the fundamental considerations for the UB phenomena causative factors correspond. The ten UB causative factors employed in this study are also provided in Table II, and the details are given in Table III.
In this research, the adjusted Q rate (AQ) and average horizontal to vertical stress ratio (K) were used as the representative geological parameters, and five blasting parameters, including the average length of blast-hole (Blen) powder factor (Pf), angle difference between the hole and wall (AHW), diameter of blast-hole (Bdia), and space and burden ratio (SbR), were used as the likely causative factors for UB. The planned tons of stope (Pt), aspect ratio (AsR), and stope either breaking through into a nearby drift and/or stope or not ( BTBL) were considered the likely UB causative factors in the stope design category. Because the data collection herein relied on historical records, human errors such as blast-hole deviation and drilling error were impossible to obtain. Thus, the average blast-hole length ( Blen) data was collected to indirectly compute the blast-hole deviation, because drilling accuracy for longhole drilling is generally expressed as a percentage of the blast-hole depth (Stiehr and Dean, 2011).
Data collection
Data collection is a herculean task but vital for this study, and the prediction capability of the proposed model fully relies on the data quality. To avoid potential bias and establish appropriate UB prediction models, the extensive range of historical stope reconciliation data and geological data was scrutinized. Initially, 1354 data-sets with 45 parameters in three core causative categories were collected via a thorough review of over 30 000 historical documents from three underground longhole and open stoping mines in Western Australia. Ultimately, ten parameters were used as the representative causative factors for UB. Figure 2 is an overview of one investigated mine with an example of stope reconciliation data using a cavity monitoring system (CMS).

As shown in Figure 2, the planned stope model was compared with the actual stope model, which was obtained using the CMS. The unplanned dilution volume and ore loss percentage were calculated not only for the hangingwall but also the footwall. The geology, stope design, and blasting data were collected in succession through examining corresponding documents.
For a coherent analysis, 287 abnormal data-sets were removed through examining univariate, bivariate, and multivariate outliers because they could influence the analysis in various ways and decrease the reliability of the proposed model.
Multiple regression analysis
Multiple linear and nonlinear regression analysis (MLRA and MNRA) were applied to propose an appropriate UB estimation model for each mine site, as well as a general model based on all of the data-sets.
Multiple linear regression analysis
Initially, all independent variables were forced into the MLRA model, which is referred to as the MLRA-enter model. Next, the insignificant variables were progressively removed to
obtain the optimised MLRA-stepwise model based on the statistical significance levels for F and t values. The MLRA-enter and stepwise model results are shown in Table IV.
As can be seen from Table IV, for the Mine A data-set, the adjusted coefficients of the determinant (R2adj) for the MLRA-enter and stepwise models were 0.280 and 0.293, respectively. The K, Blen, Hdia, BTBL, and SbR were removed from the MLRA-stepwise model due to their low t-value significance levels. The Mine B data-set MLRA models yielded the highest R2adjvalues among the MLRA models; the MLRA-enter and stepwise models yielded 0.322 and 0.330, respectively. Hdia was not considered in the models because the Mine B data-set had only one value for this variable. The t-values for BTBL, SbR, Pt, Pf, and AsR were inadequate; they were therefore removed from the MLRA-stepwise model. The MLRA-enter and stepwise models for Mine C had the lowest adjusted coefficients of the determinant (R2aj), 0.166 and 0.163, respectively. The F and t values for K, Hdia, SbR, and Pt were unsuitable and were removed from the MLRA stepwise model. All of the data from the three mines was used for the general model, and the R2 adjwas calculated as 0.171 for both the MLRA-enter and stepwise models. The K Hdia, SbR, and Pt were gradually removed from the MLRA-stepwise model due to their low F and t values.
Even though the MLRA models showed poor and moderately linear relationships with the dependent variable (UB), certain fundamental engineering aspects were elucidated. Using the proposed MLRA models, independent variables such as BTBL, Pf, Hdia, SbR, Pt, AsR, and K showed a positive relationship to the UB. In contrast, Blen, AHW, and AQ had a negative relationship with the UB. In MLRA-enter model, some irregular patterns were noted. For instance, BTBL in Mine A, SbR and AsR in Mine B, and Hdia in Mine C showed a negative relationship; these patterns may be due to independent variables that were forced to into the MLRA-enter models. To consolidate reliable models, these variables were removed from the MLRA-stepwise models.
When multiple regression analysis is applied, heteroskedasticity and multicollinearity problems must be considered because they may yield an erroneous conclusion. In this study, no suspicious results were found from the MLRA-stepwise and MNRA models through checking the residual plots, variance inflation factor (VIF), and the Durbin-Watson value (Durbin and Watson, 1950).
Multiple nonlinear regression analysis
Dilution and ore loss are the most complex phenomena in underground mining production, and they are affected by various factors as described previously. The complex phenomena cannot be fully interpreted using a linear model. Thus, MNRA was performed to obtain more significant relationships than from the MLRA. In this study, the twin-logarithmic model was used, and the following nonlinear relation was assumed:

where Y denotes the predicted value corresponding to the dependent variables (XiX2,...Xn), and ft to ft are the parameters for the nonlinear relationship. Equation [2] can be transformed into a linear domain through log transformation as shown in Equation [3]; thus, the β values can be determined based on a multiple linear regression of log(Y) on log(X1, log(X2)...log(Xn) (Cankaya, 2009).

The dependent variable (UB) has negative values that express the ore loss rate; and two independent variables (BTBL and AHW) contain zero values. The negative and zero values cannot be applied to the logarithmic function. Hence, the data-sets must be transformed into positive, real values. For an unbiased transformation, unity was added after the data-sets were normalized between zero and one. Thus, the data-sets yielded values between one and two. MNRA was accomplished using the Levenberg-Marquardt iterative estimation algorithm (Marquardt, 1963). Subsequently, optimal models for Mine A, Mine B, Mine C, and the general model were obtained after eight, twelve, six, and six iterations, when the residual sum of squares reached 1.0E-008. The MNRA model results are shown in Table V.
The adjusted coefficients of the determinant (R2adj) for Mine A, Mine B, Mine C, and the general model were 0.317, 0.368, 0.181, and 0.192, which are slightly higher than from the MLRA-stepwise models. In fact, the MNRA models were also insufficient for clarifying the relationship between the UB and given independent variables.
Artificial neural network
An artificial neural network (ANN) can be defined as a parallel computational inference model whose functionality is simply mimicked by a biological neuron. The fundamental structure of an ANN comprises input, hidden, and output layers and numbers of a simple mathematical element, the artificial neurons, which are in each layer. The neurons are fully interconnected to each layer, and the connection intensity is expressed by the weight. The optimum weight of all connections can be obtained through continuous forward and backward processes with a certain learning algorithm during the training stage. Next, a new set of inputs can yield a prediction only through the forward process with the optimized weight from the previous training. Indeed, the ANN is optimized by simply discovering the optimum weights of the model connections. The structure of the multilayer feedforward ANN used in this study can be seen in Figure 3.

In the proposed ANN model, the conjugate gradient algorithm (CGA) (Hestenes and Stiefel, 1952) was applied as an learning algorithm of the ANN model and the weights can be updated as follows:

where w(p+1)indicates the updated weight for p+1 step, g is the error gradient (g = dE(x,w)ldw), and βρ+1 is the conjugate
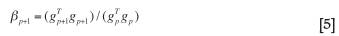
gradient algorithm constant. In the CGA, the search direction is determined with a conjugate direction that generally yields more rapid convergence than with the steepest descent (M0ller, 1993). Various types of combination coefficients (β) were introduced to determine the appropriate conjugate direction. A well-known algorithm was introduced by Fletcher and Reeves (1964), and the β for p+1 step can be calculated as follows:
UB prediction using a conjugate gradient ANN
ANN performance is greatly affected by the learning algorithm, transfer function, and ANN architecture. Special care must be taken when designing the ANN architecture and choosing its activation function for computational elements. The hyperbolic tangent (tansig) and log sigmoid (logsig) functions are widely used as nonlinear activation functions. The tansig and logsig output vary between [0, 1] and [-1, 1], respectively. In this study, tansig was used because it showed better performance than logsigin the previous over-and underbreak prediction study conducted by Jang and Topal (2013). In this context, data-sets were scaled into the range -1 to +1using Equation [6]. After the model estimates the output, the scaled output can be standardized using Equation [7].

Where, x presents values of dependent parameters. xs, xmin and xmax indicate normalised, minimum, and maximum values respectively. To consolidate the appropriate ANN architecture, the optimum number of hidden neurons must be defined. Certain empirical suggestions have been introduced, such as by Hecht-Nielsen (1987) and Kaastra and Boyd (1996). However, the proper number of hidden neurons may differ in simulations even for the same problem; thus, so an iterative loop operation was designed to determine the optimum number of neurons in each model.
Furthermore, one of the obstacles that may be encountered during the training of the ANN model is over-fitting. The fitting may appear to be excellent during the training stage, but the proposed model cannot predict a correct output for untrained samples. In other words, the model is not general. To avoid the over-fitting problem, the cross-validation (Hansen and Salamon, 1990) method was applied. The data-sets used for validation are not involved in the training process, and the generalization for each training step is cross-checked using untrained validation data-sets to prevent the over-fitting. In this study, the data-sets were randomly divided into three subsets; training, validation, and test. 70% of the data-sets were used for training, 15% were assigned to the validation, and 15% were assigned to the test stage. The entire CGA-ANN was programmed using Matlab code (MathWorks, 2013), and optimum models for Mine A, Mine B, Mine C, and the general model were generated. The UB prediction model details are demonstrated in Table VI.
In all models, the training and validation RMSE decreased dramatically within 30 iterations, and it gradually reduced through 100 iterations. The optimum number of hidden neurons for the ANN model for Mine A, Mine B, Mine C, and the general model were 7, 16, 16, and 40 respectively. The RMSE for the training stages was less than 2.36E-2, and strong positive correlations (R > 0.7) were observed. Figure 4 illustrates test performance graphs of each model.

Considering that UB has been neglected as an unpredictable phenomenon, these results are noteworthy. The result will be thoroughly scrutinized for comparison with the current UB prediction results for mines in the following section.
Results and discussion
MLRA, MNRA, and ANN were used to develop the optimum UB prediction model based on 1067 data-sets with ten UB causative factors from three longhole stoping underground mines in Western Australia. The UB prediction model was established not only for each mine, but also for all of the mine data-sets. Ultimately, the MLRA, MNRA, and ANN prediction performances were compared with the current prediction mine results (Figure 5).

As can be seen from Figure 5, the MLRA and MNRA models yielded poor and moderate UB prediction performances. Their correlation coefficients (R) were between 0.412 and 0.607. In contrast to multiple regression analyses, the ANN models yielded fair and excellent UB prediction performances. The correlation coefficients (R) for Mine A, Mine B, and Mine C were 0.944, 0.801, and 0.704, respectively. The general model for ANN was trained with 747 datasets, and 160 untrained data-sets were used to validate the system during the training process to prevent over-fitting. Ultimately, the optimized ANN model was established with the RMSE of 1.90E-2 and tested with 160 untrained data-sets. The correlation coefficient (R) for the test was 0.719.
The proposed ANN engine can be easily applied to underground stoping mines because the input parameters of the proposed ANN are generally collected for each underground stope. Engineers can examine potential unplanned dilution and ore loss prior to the actual stope development by inputting these parameters to the proposed ANN.
Conclusions
New unplanned dilution and ore loss prediction models were established using multiple linear regression analysis (MLRA), multiple nonlinear regression analysis (MNRA), and an artificial neural network (ANN) method for 1067 historical stope data-sets collected from three underground longhole stoping mines in Western Australia. Models were established not only for each mine but also for the data-sets as a whole to propose a general model for predicting UB. Correlation coefficients (R) were used to evaluate the MLRA, MNRA, and ANN performance; their values for the general model were 0.419, 0.438, and 0.719, respectively. Considering the current UB prediction in investigated mines yielded an R of 0.088, the ANN model results are significant.
Although the exact causes of unplanned dilution and ore loss are extremely complex, the general trends underlying the UB mechanism were somewhat elucidated using the ANN model. The established ANN models were calibrated using untrained data-sets during the test stage. Thus, they can be directly used as a tool for practical prediction for any underground longhole stoping operation. As such, this paper will create significant benefit for underground stope planning and design.
References
Austrade. 2013. Underground Mining. Sydney, Australia. [ Links ]
Cankaya, S. 2009. A comparative study of some estimation methods for parameters and effects of outliers in simple regression model for research on small ruminants. Tropical Animal Health and Production, vol. 41, no. 1. pp. 35-41. [ Links ]
Clark, L. and Pakalnis, R. 1997. An empirical design approach for estimating unplanned dilution from open stope hangingwalls and footwalls. 99th Annual Conference of the CM, Vancouver, BC. [ Links ]
Clark, L. M. 1998. Minimizing dilution in open stope mining with a focus on stope design and narrow vein longhole blasting. MASc thesis, University of British Columbia. [ Links ]
Diederichs, M. S. and Kaiser, P. K. 1996. Rock instability and risk analyses in open stope mine design. Canadian Geotechnical Journal, vol. 33, no. 3. pp. 431-439. [ Links ]
Durbin, J. and Watson, G.S. 1950. Testing for serial correlation in least squares regression: I. Biometrika, vol. 37, no. 3/4. pp. 409-428. [ Links ]
Fletcher, R. and Reeves, C.M. 1964. Function minimization by conjugate gradients. The Computer Journal, vol. 7, no. 2. pp. 149-154. [ Links ]
Germain, P. and Hadjigeorgiou, J. 1997. Influence of stope geometry and blasting patterns on recorded overbreak. International Journal of Rock Mechanics and Mining Sciences, vol. 34, no. 3-4. pp. 115.e111-115.e112. http://dx.doi.org/10.1016/S1365-1609(97)00219-0 [ Links ]
Hansen, L.K. and Salamon, P. 1990. Neural network ensembles. Pattern analysis and machine intelligence. IEEE Transactions, vol. 12, no. 10. pp. 993-1001. [ Links ]
Hecht-Nielsen, R. 1987. Kolmogorov's mapping neural network existence theorem. 1st IEEE International Conference on Neural Networks, San Diego, CA, USA. [ Links ]
Henning, J.G., and Mitri, H.S. 2007. Numerical modelling of ore dilution in blasthole stoping. International Journal of Rock Mechanics and Mining Sciences, vol. 44, no. 5. pp. 692-703. [ Links ]
Henning, J.G. and Mitri, H.S. 2008. Assessment and control of ore dilution in long hole mining: case studies. Geotechnical and Geological Engineering, vol. 26, no. 4. pp. 349-366. [ Links ]
Hestenes, M.R. and Stiefel, E. 1952. Methods of conjugate gradients for solving linear systems. Journal of Research of the National Bureau of Standards, vol. 49, no. 6. pp. 409-436. [ Links ]
Jang, H. and Topal, E. 2013. Optimizing overbreak prediction based on geological parameters comparing multiple regression analysis and artificia neural network. Tunnelling and Underground Space Technology, vol. 38. pp. 161-169. http:dx.doi.org/10.1016/j.tust.2013.06.003 [ Links ]
Kaastra, L. and Boyd, M. 1996. Designing a neural network for forecasting financial and economic time series. Neurocomputing, vol. 10. pp. 215-236. [ Links ]
Mandal, S. and Singh, M. 2009. Evaluating extent and causes of overbreak in tunnels. Tunnelling and Underground Space Technology, vol. 24, no. 1. pp. 22-36. [ Links ]
Marquardt, D.W. 1963. An algorithm for least-squares estimation of nonlinea parameters. Journal of the Society for Industrial and Applied Mathematics vol. 11, no. 2. pp. 431-441. [ Links ]
Martin, C., Tannant, D., Yazici, S., and Kaiser, P. 1999. Stress path and instability around mine openings. Proceedings of the 9th ISRM Congress on Rock Mechanics, Paris, France, 25-28 August 1999. [ Links ]
Mathews, K., Hoek, E., Wyllie, D., and Stewart, S. 1981. Prediction of stable excavation spans for mining at depths below 1000 m in hard rock. CANMET DSS Serial No: 0sQ80-00081. Ottawa. [ Links ]
MathWorks, I. 2013. R2013a. Natick, MA. [ Links ]
M0ller, M.F. 993. A scaled conjugate gradient algorithm for fast supervised learning. Neural Networks, vol. 6, no. 4. pp. 525-533. http://www.sciencedirect.com/science/article/pii/S0893608005800565 [ Links ]
Mubita, D. 2005. Recent initiatives in reducing dilution at Konkola Mine, Zambia. Journal of the South African Institute of Mining and Metallurgy, vol. 105, no. 2. pp. 107-112. [ Links ]
Pakalnis, R. 1986. Empirical stope design at Ruttan mine. Department of Mining and Minerals Processing, University of British Columbia, Vancouver, Canada. pp. 90-95. [ Links ]
Pakalnis, R., Poulin, R., and Hadjigeorgiou, J. 1996. Quantifying the cost of dilution in underground mines. International Journal of Rock Mechanics and Mining Sciences and Geomechanics Abstracts, vol. 33, no. 5. p. 233A [ Links ]
Potvin, Y. 1988. Empirical open stope design in Canada. PhD thesis, University of British Columbia. [ Links ]
Potvin, Y. and Hadjigeorgiou, J. 2001. The stability graph method for open-stope design. Underground Mining Methods: Engineering Fundamentals and International Case Studies. Society for Mining, Metallurgy and Exploration, Littleton, CO. pp. 513-520. [ Links ]
Stewart, P. and Trueman, R. 2008. Strategies for minimising and predicting dilution in narrow vein mines-the narrow vein dilution method. Narrow Vein Mining Conference, Ballarat, Victoria, Australia, 14-15 October 2008. [ Links ]
Stewart, P.C. 2005. Minimising dilution in narrow vein mines. Doctor of Philosophy thesis, University of Queensland. [ Links ]
Stiehr, J.F. and Dean, J. 2011. ISEE Blasters' Handbook. International Society of Explosives, Cleveland, oH. pp. 442-452. [ Links ]
Suglo, R.S. and Opoku, S. 2012. An assessment of dilution in sublevel caving a Kazansi Mine. International Journal of Mining and Mineral Engineering, vol. 4, no. 1. pp. 1-16. [ Links ]
Tatman, C. 2001. Mining dilution in moderate- to narrow-width deposits. Underground Mining Methods: Engineering Fundamentals and International Case Studies. Society for Mining, Metallurgy and Exploration, Littleton, CO. pp. 615-626. [ Links ]
Villaescusa, E. 1998. Geotechnical design for dilution control in underground mining. Proceedings of the Seventh International Symposium on Mine Planning and Equipment Selection, Calgary, Alberta, 6-9 October 1998. Balkema, Rotterdam. pp. 141-149. [ Links ]
Wang, J., Milne, D., Yao, M., and Allen, G. 2002. Factors influencing open stope dilution at Hudson Bay Mining and Smelting. 5th North American Rock Mechanics Symposium, Toronto, Canada. [ Links ]
Yihong, L. and Weijin, Z. 1986. Reducing waste-rock dilution in narrow-vein conditions at tungsten mines in China. Mining Science and Technology, vol. 4, no. 1. pp. 1-7. [ Links ]
© The Southern African Institute of Mining and Metallurgy, 2015. ISSN2225-6253. Paper received Nov. 2014 and revised paper received Feb. 2015.

