


Services on Demand
Article
 English (pdf)
 Article in xml format
 Article references
Indicators

Related links
-
 Cited by Google
 -
 Similars in Google
Share

 Permalink
Journal of the Southern African Institute of Mining and Metallurgy
On-line version ISSN 2411-9717
Print version ISSN 2225-6253
J. S. Afr. Inst. Min. Metall. vol.115 n.5 Johannesburg May. 2015
PYROMETALLURGICAL PAPERS
A finite difference model of the iron ore sinter process
J. Muller; T.L. de Vries; B.A. Dippenaar; J.C. Vreugdenburg
Kumba Iron Ore, Anglo American plc
SYNOPSIS
Iron ore fines are agglomerated to produce sinter, which is an important feed material for blast furnaces worldwide. A model of the iron ore sintering process has been developed with the objective of being representative of the sinter pot test, the standard laboratory process in which the behaviour of specific sinter feed mixtures is evaluated. The model aims to predict sinter quality, including chemical quality and physical strength, as well as key sinter process performance parameters such as production rate and fuel consumption rate. The model uses the finite difference method (FDM) to solve heat and mass distributions within the sinter pot over the height and time dimensions. This model can further be used for establishing empirical relationships between modelled parameters and measured sinter properties. Inputs into the model include the feed material physical properties, chemical compositions, and boundary conditions. Submodels describe relationships between applied pressure differential and gas flow rate through the bed of granulated fine ore particles, combustion of carbonaceous material, calcination of fluxes, evaporation and condensation of water, and melting and solidification. The model was applied to typical sinter test conditions to illustrate the results predicted, and to test sensitivities to parameters such as feed void fraction, feed coke percentage, and the fraction of combustion heat transferred to the gas phase. A model validation and improvement study should follow, ensuring sinter test results are free from experimental errors by conducting repeated tests.
Keywords: iron ore sintering, finite difference method, coke combustion, calcination, evaporation and condensation, melting and solidification, sinter strength
Introduction
Blast furnaces are predominantly used for ironmaking, with more than 90% of the world's clean iron units produced in these processes (Kogel et al., 2006). High-grade lump iron ore, high-grade ore fines, and concentrates from lower grade ores are utilized as feed to blast furnaces. These ore fines are agglomerated typically through sintering or pelletization to improve the blast furnace burden permeability, reducing the coke consumption rate and improving reduction rate. Sinter is used as blast furnace feed at percentages of up to 90%, and contributes to reduced operating costs (Kogel et al., 2006).
Research and development for the sintering process on the laboratory or pilot scale is typically conducted by means of a sinter pot test. The VIU (Value In Use) team at Kumba Iron Ore routinely uses sinter pot tests to evaluate new sinter raw materials, primarily in terms of production rate, coke consumption, and product sinter physical properties. Optimum sinter blends can be investigated as well as the impact of changes in sinter blends on the sintering performance and sinter quality, providing information for marketing of the iron ore. As such, the VIU sinter pot test equipment is in high demand.
Sinter pot tests are time-consuming, thus the turnaround time can be slow. The tests are also very costly. For these reasons, it is clear that a modelling tool that could predict the key outcomes of sinter tests with a reasonable level of accuracy would be a valuable tool for assessing the performance of sinter blends in the initial phases of a project. It is not expected that the model could replace the pot test, but that it would complement the pot test work and possibly reduce the number of actual tests required. This paper discusses the work done to date towards this goal.
The sinter pot test
The continuous industrial sintering belt process is approximated by using a batch 'pot' test in which the material contained in the stationary sinter pot passes through the same process stages as it would on a sinter belt. Sinter pot test measurements are used as basis for the validation of one-dimensional (1D) models (Patisson et al., 1991; Zhou et al., 2012a). The sinter pot test is illustrated in Figure 1.
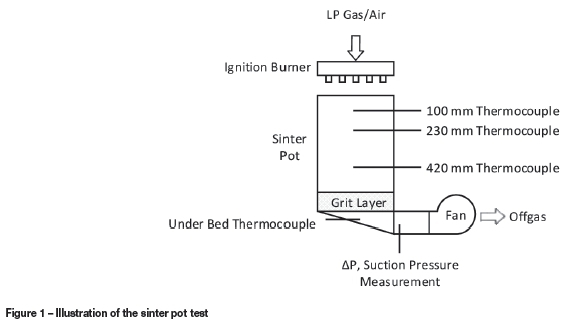
The procedure for the sinter pot test is as follows. After the equipment is prepared, the raw material blend is manually weighed and fed into the test pot via a high-intensity mixer and a granulation drum. Once the pot has been filled, key settings, including the ignition time and temperature and the pressure drop set-points of the various stages, are entered on the sinter control system via the SCADA interface. Typically, the applied pressure differential below the pot is pressure-controlled rather than flow rate controlled, and the material in the pot is ignited using LP gas.
After ignition, the temperature is manually controlled by the operators by regulating the gas flow rate. The ignition stage ends automatically after the prescribed time has elapsed and the process proceeds to the sintering stage. The end of sintering is defined as the time at which the peak exhaust gas temperature is measured, indicating that the flame front has travelled all the way through the sinter cake. An optional cooling cycle may be included after this, where cold air continues to be drawn through the sinter cake. However, this is used only occasionally.
After sintering is completed, the sinter cake is removed from the pot using an overhead crane. The cake then proceeds to physical and metallurgical testing. This starts with a set of drop tests followed by a drum breakdown procedure; after which the sample is screened to determine the size distribution of the final sinter. The FeO content of the sample is measured by titration. Additional tests are conducted: a tumble index (TI ) test as per ISO 3271, a reducibility index (RI ) test as per ISO 4695 and ISO 7215, and a reduction disintegration (RDI ) test as per ISO 4696-1 and 4696-2. If required, REAS (Reduktion, Erweichung, und Abschmelzen - meaning reduction, softening, and melting) tests are also carried out to determine the softening and melting characteristics of the sinter.
The performance of a sinter in the pot test is defined by several measures, including productivity, fuel rate, and the strength and reactivity of the sinter as defined by the physical and metallurgical tests listed above. In order for a sinter model to be useful to VIU, it ultimately needs to be able to predict all of these parameters with a reasonable degree of accuracy. To validate the sinter model, sinter pot tests would typically be conducted in which additional thermocouples are mounted in the pot at various depths so that the measured temperature profiles in the sinter cake can be recorded and compared with those predicted by the model. Thermocouples are typically inserted at depths of 100 mm, 230 mm, and 420 mm, measured from the top of the sinter pot.
Sinter modelling
General principles
The sinter pot test can be simulated by modelling the mass and heat transfer phenomena occurring within the sinter bed over time as the boundary conditions change. Chemical reactions, heat transfer, and physical transformation can be modelled, and the temperature profiles, chemical compositions, gas flow velocities, etc. predicted. Physical strength parameters of the final sinter can be estimated through correlations with some of these predicted variables. Previous researchers have developed several such models describing iron ore sintering with various degrees of complexity (Dash et al., 1974; Thurlby, 1988; Patisson et al., 1991; Clixby and Young, 1992; Yang et al., 2004; Majumder et al., 2009). More recently, Zhou et al. (2012a) also reported on the development of such a model, and evaluated such work currently available in the literature (Zhou et al., 2012b).
The sinter pot test itself is a transient problem with heat and mass transfer occurring in all three dimension, but predominantly in the height dimension as the flame front travels downwards through the sinter bed. It is therefore typical to assume variations over the area of the sinter pot to be negligible, and to model the sintering process using a transient 1D approach as illustrated in Figure 2 (Zhou et al., 2012b).
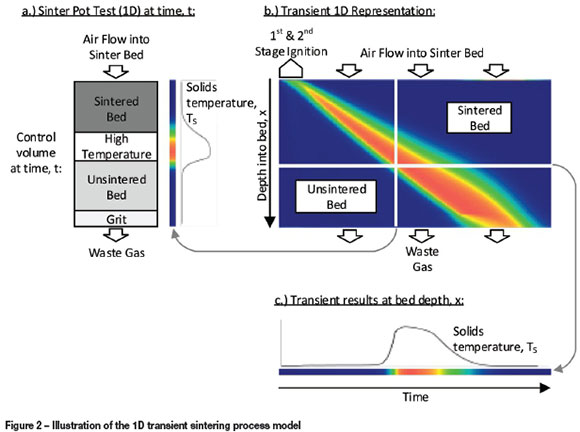
The transformation of a 1D section of solid material (control volume) from the sinter bed (Figure 2a), which includes a returned (recycled) sinter fines layer at the bottom (grit), is modelled over time. Gas flow in the model is from the top to bottom of this 'control volume'. The solids temperature and chemical composition profiles are modelled over time, as well as the change in temperature and chemical composition of the gas flowing from top to bottom. The variable profiles along the sinter bed height (e.g. solids temperature, shown in Figure 2a) are combined for all of the time steps simulated to produce an illustration such as Figure 2b, showing solids temperature. This illustrates the complete sinter process from start to finish, representative of the 'control volume* of material, which moves at the speed of the sinter strand. Variables may also be illustrated over time and at a specific depth, for example, the solids temperature as shown in Figure 2c.
Model inputs
Initial and boundary conditions that have to be specified as inputs to the model include the following:
> Individual feed materials specification (e.g. each ore, flux, fuel, etc.): amount of each constituent in feed mixture (recipe), chemical composition, particle size distribution, physical properties (density, porosity)
> Granulated feed material (mixedfeed to the sinter pot) and bottom grit layer specification: particle size, void fraction, and sphericity
> Sinter product requirement: basicity (CaO/Si02), and percentages of FeO, MgO, and SiO2(optional)
> Sinter process/boundary conditions: bed and grit layer heights, ignition duration, ignition gas temperature, chemical composition, pressure at top of bed, and applied pressure differential below bed (for first and second ignition stages, and then normal sintering)
> Simulation controls: number of height elements, duration of time step, simulation maximum time, iterative calculation controls, sub-model control parameters, and results derivation parameters (e.g. sintering time defining temperature).
The amounts of ores, fuels, return fines, burnt lime, and moisture are specified in terms of the ratios making up the granulated feed. The amounts of other fluxes (dolomite, silica, lime) are determined for the feed blend prior to model calculation, in order to achieve the required sinter product basicity (CaO/SiC>2) and percentages of MgO and S1O2.
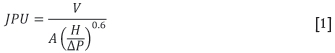
The model allows for the void fraction to be estimated from the JPU (Japanese Permeability Unit) that is often measured for the granulated sinter feed material in separate test work. The actual pressure drop over the standardized JPU test sample is calculated using Equation [1] (Lwamba and Garbers-Craig, 2008). The material void fraction is iteratively determined using the Ergun equation (Equation [2]) with the other physical material properties of the sinter feed.
where
δρ: pressure drop (mm H20)
H: height (mm)
V: air flow rate (Nm3.min-i)
A: area (m2).
Model solution
The finite difference method (FDM) has been used to solve transient mass and energy conservation equations. The modelling approach followed and software algorithm are in principle the same as those described in more detail elsewhere (Majumder et al., 2009). An overview of the method is provided here, but for brevity the conservation and other model equations are not been repeated, unless they were different to those used in previous studies (Majumder et al., 2009) or of specific importance as stated later.
The control volume (illustrated in Figure 2a) is divided into collections of elements representing gas and solid separately. Variables defined for each element include temperature, chemical composition, reaction rates, etc. For solid elements, the liquid fraction is also defined as a variable, whereas for the gaseous elements, variables are also defined for velocity and pressure.
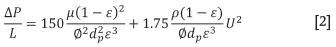
The combustion of carbonaceous material with oxygen from the air drawn in at the top of the sinter bed primarily determines the amount of heat generated, causing melting of solid phases and therefore forming the basis of the sintering process. The air flow velocity is controlled by the applied pressure differential at the bottom of the sinter bed, and is influenced by the physical properties of the solids, and by heat transfer and the chemical reactions occurring. The model iteratively determines the mass flow rate of gas drawn into the sinter at each simulated time step (Figure 2a). The gas-solid heat and mass transfer is calculated in each element by moving from the top to bottom and using sub-models to describe physical phenomena. After calculation of all the submodels and the resulting heat and mass transfer between the solids and gas, the pressure drop is calculated over each solid material element, and the air flow rate into the bed adjusted until the total calculated pressure drop converges to that specified as the model input. The pressure drop is calculated as follows using the Ergun equation (Majumder et al., 2009):
where
ΔP: pressure drop (Pa)
L: height (mm)
μg: gas viscosity (Pa.s)
ε: bed void fraction
0: particle sphericity
dp: mean particle diameter (m)
U: gas velocity (m.s-1)
ρ: gas density (kg.m-3).
Another important aspect of the energy balance calculated in each element is the assumptions made with respect to the heat of reaction from chemical reactions. Solid and/or gas phase species react with each other to yield products that are also in either the solid and/or gas phase (e.g. Equation [3]). In the energy balance of the model, the heat of reaction is split between the enthalpies of the solid and gas products (Yang et al., 2004). For each of the chemical reactions identified, a fraction yiis specified as the fraction of the heat distributed to the gas, with the balance to the solids. For the chemical reactions the model parameters are defined as important model inputs that greatly affect the predicted temperature profiles - ydol: dolomite calcination;ycomb: coke combustion;yevap: evaporation;ycond: condensation.

Sub-models
Sub-models are formulated to model the gas-solids heat transfer and mass transfer due predominantly to chemical reactions as the gas enters at the top and moves through the sinter bed. Convective heat transfer between gas and solids is modelled only, with conduction and radiation excluded for simplification. Depending on the nature of the chemical reactions, heat is generated or consumed by the chemical reactions and distributed between the resulting gas and solid phases. Chemical reactions are modelled for water evaporation and condensation, dolomite calcination, coke combustion, and melting and solidification of all materials, including Fe raw materials. The physical transformation of the solids (e.g. bed shrinkage) and its effect on the bed permeability is not modelled here due to the unavailability of experimental data. The details on each these sub-model as implemented in the sinter model are provided below.
Convective heat transfer
Heat transfer between the downward-moving gas and solids particles in the sinter bed occurs mostly by means of forced convection. Heat transfer rate is calculated in each finite element from the relevant solids and gas temperatures, and a modelled heat transfer coefficient, hgs, using the model reported by Majumder et al. (2009) and Pattison et al. (1991):
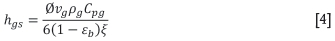
where
hgs: convective solid-gas heat transfer coefficient (W.m-2.K-1)
0: particle sphericity
vg: gas viscosity (Pa.s)
pg: gas density (kg.m-3)
Cpg: gas specific heat (J.kg.-1.K-1)
εb: bed void fraction
ξ: channelling length factor.
Water evaporation and condensation
Water evaporates from the wet granulated feed in the warmer areas of the sinter bed around where the flame front progresses downwards through the sinter bed. As the gas flows through the unsintered bed, it carries this water vapour downwards into cooler areas of the bed below the flame front, where condensation becomes possible.
The rates at which evaporation (drying) or condensation occur in each solids element are estimated using the model reported by Patisson et al. (1990). Firstly, the mass transfer rate in the gas boundary layer is modelled as a function of the gas temperature and pressure, the gas-solid heat transfer coefficient, and the logarithmic mean of the actual and saturated molar fractions of moisture in the gas phase (Patisson et al., 1990):
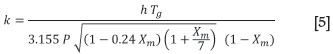
where
k: boundary gas layer mass transfer rate (m.s-1)
h: heat transfer coefficient (W.m-2.K-1)
Tg: gas temperature (K)
P: absolute gas pressure (Pa)
Xm: logarithmic mean of actual and saturated molar fraction moisture in vapour.
The rate of moisture transfer is then calculated, depending on the actual moisture partial pressure (Pattison et al. , 1990):
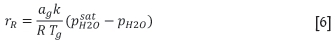
where
rR: rate of moisture transfer (mol.m-3.s-1)
a: bed specific area (m2.m-3)
k: boundary gas layer mass transfer rate (m.s-1)
R: ideal gas law constant (J.mol-1.K-1)
Tg: gas temperature (K)
:H2O saturation partial pressure in gas (kPa)
ph2O: actual H2O partial pressure in gas (kPa).
This is then used to model the rate of moisture transfer between the gas and solids phases, and is also dependent on the specific area of the solids, and the actual and saturation H2O partial pressures in the gas phase. Condensation is modelled to occur at a constant rate, independent of the amount of moisture in the solids. Evaporation is modelled also to occur at a constant rate up to a critical moisture content, after which the rate decreases in the ratio, P(Wr) (Patisson et al., 1990):
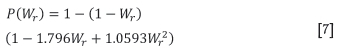
where Wr is the ratio of the actual moisture content to the critical moisture content. A critical moisture content of 5% was used here (as per Majumder et al., 2009).
Limestone and dolomite calcination
CaCO3 and MgCO3 are present in some of the sinter feed materials, typically as dolomite and lime. These species start to decompose at a certain temperature in the sintering process, enriching the gas with CO2. The decomposition rates are modelled for CaCO3 and MgCO3 in each solids finite element using simple rate equations as functions of the solids temperature at that point (as per Thurlby, 1988):
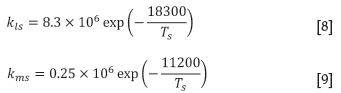
where
kls: calcination rate constant of CaCO3 (1.s-1)
kms: calcination rate constant of MgCO3 (1.s-1)
Ts: solids temperature (K).
Coke combustion
Coke (and possibly other carbonaceous materials) is added to the sinter feed mixture as the fuel source. The carbon reacts with oxygen to produce CO and CO2, generating the heat required to initiate melting of the solids and assimilation of the remaining particles. Sinter models reported in the literature apply different combustion models, which also consider the generation and further combustion of CO, as well as the Boudouard reaction whereby CO2 is converted back to CO. Here the combustion model by Gibb and Field has been applied (as per Mei et al., 2010). In this approach the above combustion reactions are combined as follows, where the degree of oxidation is represented by the parameter 0:
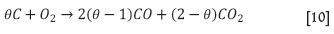
The parameter 0 is modelled as a function of temperature (Equation [5]). At lower temperatures CO2 is predicted as the main product, while at higher temperatures (from around 1000K) mostly CO is predicted as the Boudouard reaction is predominant (Zhou, 2012a).
where Tpis the particulate (solids) temperature (K), and As and Ts are model parameters with values of 2500K and 6240K respectively, as suggested by Mei et al. (2010).
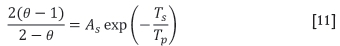
The overall coke combustion rate is determined by the diffusion rate of oxygen to the reaction surface and by the carbon reaction rate. The oxygen diffusion rate equation is solved analytically to yield the coke combustion reaction rate equation in terms of the external oxygen diffusion rate, the surface reaction rate, and the rate of internal diffusion and surface reaction (Mei et al., 2010). The coke combustion rate is calculated with the Gibb model as a function of the parameter 0 and other parameters, including the coke particle physical properties, far field oxygen concentration, external and internal gas diffusion coefficients, and the particle (solids) temperature. The following set of equations, as reported by Mei et al. (2010), describes the model:
0: oxidation mechanism parameter, molar ratio of C to O2 atoms reacting
ε: coke particle void fraction
Mc: carbon molar mass (kg.kmol-1)
Mo2: oxygen molar mass (kg.kmol-1) Co: far field oxygen (O2) concentration in the bulk gas (kg.m-3)
pc: coke solid density (kg.m-3)
k1: rate of external diffusion (1.s-1)
k2: rate of surface reaction (1.s-1)
k3: rate of internal diffusion and surface reaction (1.s-1)
DO2/N2: external diffusion coefficient of O2 through N2 (m2.s-1)
DO2-C:internal diffusion coefficient of oxygen through coke particles (m2.s-1)
Rp: average coke particle radius (m)
kc: carbon oxygen rate (1 .s-1)
ac: carbon oxidation rate equation pre-exponential factor, 14 m.s-1
Tc: carbon oxidation rate equation constant, 21 580K
Tp: coke particle temperature (solid temperature) (K)
β: reaction parameter
a: coke particle volume to internal surface ratio (m3.m-2).
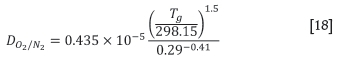
The diffusivities used above are calculated as follows as functions of the gas temperature, Tg. The external diffusion coefficient of 02 through N2 (Majumder etal, 2009):
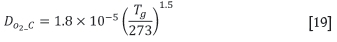
The internal diffusion coefficient of O2 through coke particles (Dash et al, 1974):
Melting and solidification
Melting and solidification are two of the most important phenomena in sintering since they enable particle assimilation and directly affect the physical properties of the sinter product. When the fines reach a certain temperature the primary melt forms, with its properties being a function of the temperature achieved and its chemical composition (Debrincat et al., 2004). The primary melt chemical composition is in turn influenced by the gradual assimilation of different individual particles into the melt, and subsequently also the bonding phases formed during solidification and the properties of the sinter product, e.g. sinter strength and reducibility (Debrincat et al, 2004).
This complex process of melting and solidification is simplified firstly by not specifically modelling the rate at which it occurs, based on the implicit assumption that heat transfer is rate limiting (modelled separately). A method by Zhou et al (2012a) is used here to estimate the fraction melted as a function of the solids temperature and chemical composition of the fines fraction:

where β is the mass fraction of melted material, Tsis the solids temperature, Tsolis the solidus temperature of around 1100°C, and Tliqis the liquidus temperature of the -1 mm fines fraction of around 1400ºC (Zhou etal, 2012a). The value for the phase change factor, a, depends on factors such the type of iron ore, particle size, ore porosity, and solids chemical composition (Zhou et al, 2012a). Due to these complexities, a value of 1 has been assumed for a, similar to that used by Pattison et al. (1991) for estimating the fraction melted during solidification.
For each solids element, the fraction melting or solidifying is derived from the above relationship for that melted in the current and previous time steps. The heat of melting or solidification is derived and included in the energy balance of each element. An average of 0.254 MJ.kg-i is used as the latent heat of melting, and 0.117 MJ.kg-i for the latent heat of solidification. These values are the averages derived from other sources, as reported by Zhou et al (2012a).
Model outputs
The model produces several outputs, which can be used to evaluate overall performance of the sinter mix and predicted sinter product properties with regard to the inputs specified, or to analyse the interrelated phenomena occurring in the sinter bed in order to make process improvements. In future, it may be possible to correlate some calculated model variables with some measured sinter properties, and these relationships may then be included in the model.
The model variables available for each element include:
> Solids variables: temperature, and chemical composition (wt.%)
> Gas variables: temperature, pressure, chemical composition (vol.%), velocity, and inlet mass flow rate
> Reaction rates: evaporation/condensation, limestone and dolomite calcination, and coke combustion reaction rates
> Other parameters: heat transfer coefficient, fraction melted and solidified, enclosed area above 200°C and HOOT (as described in Zhou etal, 2012a).
Some of the more important model results calculated (before or after the simulation) are:
> Bed void fraction: calculated from the granulated feed material JPU prior to the simulation, to be used then as a model input
> Coke consumption rate: coke usage rate calculated as the specified mass of coke feed divided by the calculated mass of sinter produced, with units of kg.t-1 sinter
> Sinter product mass and chemical composition: calculated from the feed material mixture specification, subtracting ignition loss components {e.g. carbon and carbonates)
> Sintering time: indicative of the speed with which the flame front travels through the bed and the sintering rate. Calculated as the time until the bottom of the bed cools to a specified temperature (e.g. 150°C)
> Burn-through times: similar to the sintering time, but calculated as the time to reach the maximum temperature below the sinter bed
> Production rate: rate of sinter produced calculated using the predicted mass of sinter produced and sintering time, typically units of t.m-2 per 24 h
> Variable averages: variables (from the above list) averaged over the height of the sinter bed at the end of the simulation.
Results
Typical sinter pot test
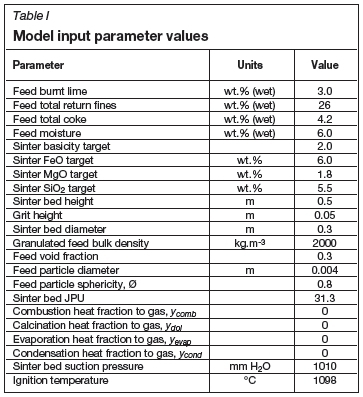
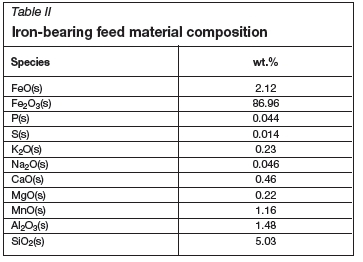
The sinter model was configured to represent typical sinter test conditions to illustrate the results that could be generated. The most important model input parameters with typical values are summarized in Table I. In Table II the chemical composition of the iron-bearing feed material is provided. The sinter feed void fraction has been specified as 0.3 (Table I), similar to what was estimated for the specified feed JPU of 31.3, particle size of 0.004 m, and sphericity of 0.8 using the method described earlier and shown as a result parameter in Table III.
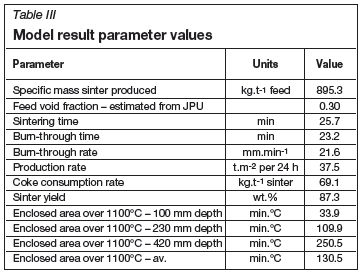
The model, predicted results are summarized in Table III. Together with the typical sinter performance parameters, the enclosed areas calculated above 1100°C are reported at different depths and on average over the sinter bed, which could be correlated to physical strengths measured of sinters produced in the test work.
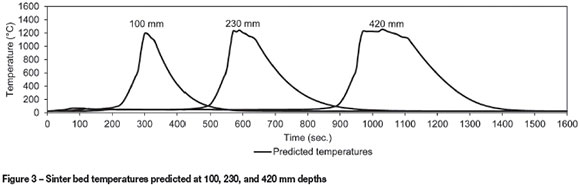
Figure 3 illustrates the solids temperatures predicted by the model at depths of 100, 230, and 420 mm. This shows that the sinter bed temperatures increase sharply to over 1200°C, when melting starts to consume energy from the combustion reactions. As the coke is consumed, temperature decreases and the melted material solidifies.
Model sensitivities
Prior to conducting test work for model validation, the model (as defined in the previous section) was used to evaluate the sensitivities of certain model parameters. This evaluation was performed to provide guidance for subsequent experimental planning, model validation, and model improvements.
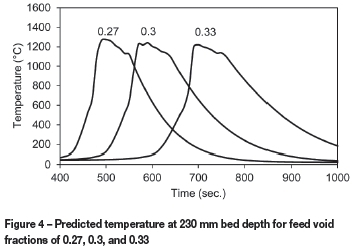
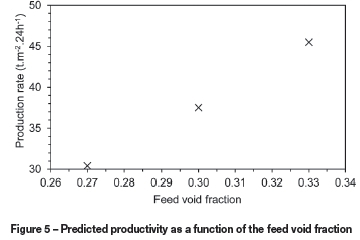
The void fraction of the sinter feed material could be derived from the solid and bulk densities, correlations with particle size, or from the actual JPUs as described earlier. These methods are likely to result in different values, and the bed void fraction is expected to change during sintering. The model was therefore used to estimate the sensitivity to void fraction by changing the baseline value of 0.3 by 10% in both directions. The temperature profiles predicted at a bed depth of 230 mm in Figure 4 show significant variations, with the times at which peak temperature is reached differing by around 100 seconds. Figure 5 shows that the production rate decreases significantly for a lower void fraction, and increases for a higher void fraction.
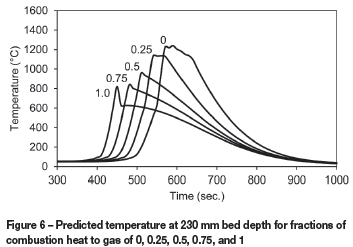
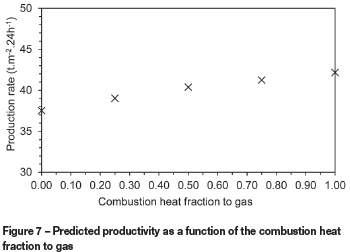
Another model parameter with uncertainty is the fraction of combustion heat that is transferred to the gas. Figure 6 illustrates the change in temperature profiles predicted at a bed depth of 230 mm when this parameter is varied between 0 and 1. This shows that values larger than around 0.25 are less likely since the predicted peak temperatures are lower than what would normally be obtained in sinter test work. In further model development work the value of this parameter could be found for the best fit between predicted and measured temperatures. Figure 7 illustrates that the production rate increases slightly with higher fractions of combustion heat transferred to the gas.
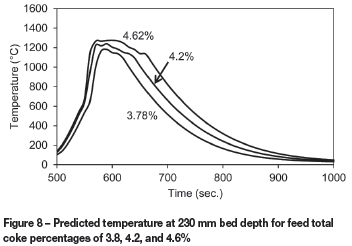
The percentage of coke in the feed was also varied within ±10% of the baseline value of 4.2%. Figure 8 shows some variation in the predicted temperature profiles at a bed depth of 230 mm, with a generally wider profile and higher peak temperature predicted for higher percentages of coke as more heat is generated for a longer duration. This higher percentage coke results in slightly lower production rates as burn-through takes longer (Figure 9). This illustrates how the model could be used to find the optimum amount of coke in the feed, as well as the sensitivity to inaccuracies in the feed recipe.

Conclusions
A model of the iron ore sintering process was developed and solved using the finite difference method. The model was applied for typical sinter test conditions to illustrate results predicted, and sensitivities of certain parameters evaluated in preparation for test work to validate and further develop the model. Results were highly sensitive to the feed void fraction, which would therefore have to be determined with a high accuracy when performing test work for model validation. Further results indicated that the fraction of combustion heat transferred to the gas could possibly be varied between zero and around 0.25 to obtain an improved fit between predicted temperatures and those measured experimentally during model validation. The results also showed that wider temperature profiles with higher peak values are predicted for increased amounts of coke in the feed, resulting in lower production rates, which would be useful in applying the model to determine optimum coke feed rates. The outcomes of this study could be used to design a sinter test programme to validate and improve the sinter model. It is recommended that tests be repeated to confirm that the measurements are free from experimental errors prior to comparison with model results.
References
Clixby, G. and Young, R.W. 1992. Mathematical model of the sintering process. Proceedings of the 10th Process Technology Conference. Second International Symposium on Modeling in the Iron and Steel Industry, Toronto. vol. 10. pp. 391-402. [ Links ]
Dash, I., Carter, C.E., and Rose. E. 1974. Heat wave propagation through a sinter bed; a critical appraisal of mathematical representations. SIMAC 74: Proceedings of the Conference on Measurement and Control in the Steel Industry, Sheffield. pp. 8/1-8/7. [ Links ]
Debrincat, D., Loo, C.E., and Hutchens, M.F. 2004. Effect of iron ore particle assimilation on sinter structure. ISIJ International, vol. 44, no. 8. pp. 1308-1317. [ Links ]
Kogel J.E., Trivedi N., Barker, J.M., and Krukowski, S.T. 2006. Industrial Minerals and Rocks: Commodities, Markets, and Uses, 7th edn. Society for Mining, Metallurgy, and Exploration, Inc. (SME). pp. 1391-1392. [ Links ]
Kohonen, T. 2001, Self-Organizing Maps, 3rd edn. Springer Series in Information Sciences, vol. 30. [ Links ]
Lwamba, E. and Garbers-Craig, A.M. 2008. Control of the grain size distribution of the raw material mixture in the production of iron sinter. Journal of the Southern African Institute of Mining and Metallurgy, vol. 108. pp. 293-300. [ Links ]
Loo, C.E., Tame, N., and Penny, G.C. 2012. Effect of iron ores and sintering conditions on flame front properties. ISIJ International, vol. 52, no. 6. pp. 967-976. [ Links ]
Majumder, S., Natekar, P.V., and Runkana, V. 2009. Virtual indurator: a tool for simulation on induration of wet iron ore pellets on a moving grate. Computers and Chemical Engineering, vol. 33. pp. 1141-1152. [ Links ]
Mei, C., Zhou, J., Peng, X., Zhou, N., and Zhou, P. 2010. Simulation and Optimization of Furnaces and Kilns for Nonferrous Metallurgical Engineering. Springer, New York. pp. 50-52. [ Links ]
Patisson, F., Bellot, J.P., and Ablitzer, D. 1990. Study of moisture transfer during the strand sintering process. Metallurgical Transactions B, vol. 21B. pp. 37-47. [ Links ]
Patisson, F., Bellot, J.P., Ablitzer, D., Marliere, E., Dulcy, C., and Steiler, J.M. 1991. Mathematical modelling of iron ore sintering process. Ironmaking and Steelmaking, vol. 18, no. 2. pp. 89-95. [ Links ]
Thurlby, J.A. 1988. A dynamic mathematical model of the complete grate/kiln iron-ore pellet induration process. Metallurgical Transactions B, vol. 19B. pp. 103-102. [ Links ]
Yang, W., Ryu, C., Choi, S., Choi, E., Lee, D., and Huh, W. 2004. Modeling of combustion and heat transfer in an iron ore sintering bed with considerations of multiple solid phases. ISIJ International, vol. 44, no. 3. pp. 492-499. [ Links ]
Zhou, H., Zhao, J.P., Loo, C.E., Ellis, B.G., and Cen, K.F. 2012a. Numerical modeling of the iron ore sintering process, ISIJ International, vol. 52, no. 9. pp. 1550-1558. [ Links ]
Zhou, H., Zhao, J.P., Loo, C.E., Ellis, B.G., and Cen, K.F. 2012b. Model predictions of important bed and gas properties during iron ore sintering. ISIJ International, vol. 52, no. 12. pp. 2168-2176. [ Links ]
© The Southern African Institute of Mining and Metallurgy, 2015. ISSN2225-6253. This paper was first presented at the, Pyrometallurgical Modelling Principles and Practices, 4-5 August 2014, Emperors Palace Hotel Casino Convention Resort, Johannesburg.

