


Services on Demand
Article
 English (pdf)
 Article in xml format
 Article references
Indicators

Related links
-
 Cited by Google
 -
 Similars in Google
Share

 Permalink
Journal of the Southern African Institute of Mining and Metallurgy
On-line version ISSN 2411-9717
Print version ISSN 2225-6253
J. S. Afr. Inst. Min. Metall. vol.115 n.4 Johannesburg Apr. 2015
STUDENT EDITION
LHD optimization at an underground chromite mine
W. Mbhalati
University of the Witwatersrand
SYNOPSIS
Conzal Mine was not meeting production targets in 2013, and it was established that this was caused by the inability of the load haul dump machines (LHDs) to tram the required tonnages. An investigation of the LHD productivity was therefore conducted to identify the inhibiting factors. This was accomplished by carrying out a literature review on LHD operations to gain in-depth knowledge and conducting observations in the working environment. The relevant information and data on the LHD type used at Conzal was also acquired.
The major inhibitor was found to be excessively long tramming distances in all the sections of the mine. The one-way tramming distances were all significantly greater than the 90 m set in the mine's code of practice (COP), with the Main Shafts section having the longest average one-way tramming distance of 260 m. The other inhibitor was LHD utilization, which in 2013 was only 47% against a target of 70%. Simulation of the LHD operation, taking these two factors into account, showed that production could be increased by more than 100%. As a result, it was recommended that conveyor belts should be extended regularly in order to keep tramming distances within the recommended one-way distance of 90 m. In addition, utilization can be improved by minimizing employee absenteeism as well as by modifying the travelling routes such that LHDs do not encounter unnecessary delays.
Keywords: underground transport, tramming, load-haul-dump optimization.
Introduction
This report focuses on the factors inhibiting the productivity of load haul dump machines (LHDs) at Conzal Mine from achieving set targets. The aim was to identify the major factors contributing to low productivity and recommend ways of reducing or eliminating them.
Background
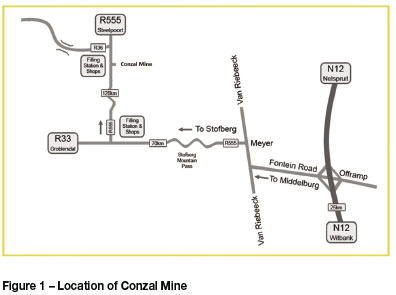
Conzal Mine1 is located near the town of Steelpoort on the eastern limb of the Bushveld Complex, approximately 350 km north-east of Johannesburg, in Limpopo Province (Figure 1).
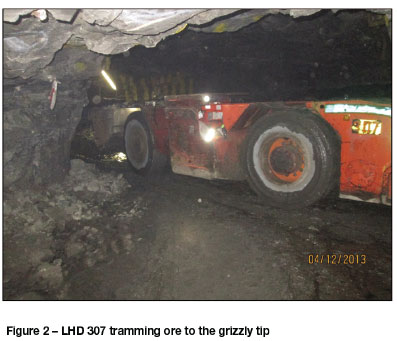
The mine exploits the MG1 and MG2 chromite seams of the in the Rustenburg Layered Suite of the Bushveld Complex. Conzal Mine historically consisted of three shafts: namely, the North, South, and Broken Hill shafts. The main focus of the project was on the South and Broken Hill shafts, as the North shaft was closed down after reaching the end of its productive life. Both shafts access the underground workings by means of declines, and the mining method is bord and pillar. Ore transportation at Conzal Mine is by means of a batch and a continuous transportation system. The batch transportation utilizes LHDs, which load the broken ore from the face and tram it to the tip, which then feeds into the continuous transportation system consisting of conveyor belts. The mine makes use of a total of 11 low-profile LHDs (illustrated in Figure 2), with three of the eleven used as standby machines and for underground construction.
Project objectives
Production is effectively the heart of all mining operations. It is therefore essential that production targets are met on a daily basis so that the mine remains profitable.
Throughout 2013, Conzal Mine was struggling to meet production targets. It is believed that the main reason for the mine not meeting its production target was due to the LHDs not being able to tram enough ore from the face to the grizzly tips. There was therefore a need to determine main factors that inhibited LHDs at Conzal Mine from meeting their tramming target of 2 200 t/d.
The objectives of the project were to:
➤ Identify major factors leading to the inability of the LHDs to reach the production target
➤ Provide solutions and recommendations on how to overcome these inhibiting factors.
Methodology
In order to achieve the above objectives, the following methodology was employed:
➤ A visit underground to inspect the operating environment of LHDs
➤ A literature review of LHD operations
➤ Interviews with relevant personnel (mine manager, mine overseers, engineer, GIT, foremen, artisans, mine planner, miners and operators) to gain additional information on LHD performance and mining conditions
➤ Underground observation of LHD operation
➤ Collection of statistical data such as monthly tonnages, LHD availability and utilization, tramming distances, and breakdowns
➤ Data analysis and simulations
➤ Draw conclusions and provide recommendations based on the data analysis and simulation results.
Literature review
The invention of LHDs can be said to be a milestone in mining. The LHD has since become a dominant machine in mechanized mines and plays an important role in overall mine production (Samanta et al., 2004, p. 1). LHDs are very versatile and powerful machines, capable of working in the most hostile of conditions while producing the required tonnages provided that the mine design suits their usage.
The literature review was instrumental in highlighting common problems in the mining industry that were relevant to the LHD problem faced by Conzal Mine. Some of these common factors are discussed below.
Maintenance
Maintenance is a very critical aspect of the availability and productivity of LHDs as it can reduce machine-related downtime (Inductive Automation, 2011, p. 7). It is imperative that maintenance is conducted on a regular basis to ensure that LHDs retain their original performance capability and reduce the rate of wear. To mitigate the effects of machine downtime, Conzal makes use of a maintenance structure that can be classified into three categories, consisting of preventative, periodic, and breakdown maintenance.
Availability
The availability of a machine influences the ability to tram the required tons from the face to the grizzly tip. Availability is the total up-time of an LHD expressed as a percentage of the total allotted time for the machine. LHD availability decreases with age, therefore the optimization of availability can defer the need to spend capital on new machinery when the current fleet has reached its end of life (Machine Downtime, 2014). From empirical results, the average availability of an efficient LHD system in the mining industry should be around 80% to 85%.
Utilization
The utilization of a machine can be defined as the time during which the machine is in motion (transmission hours) expressed as a fraction of the engine hours. Conzal measures utilization in the following manner:

Utilization can depend on many factors, such as the transport sytem design, availability of panels to be loaded, and presence of operators, to name a few. The major issue affecting utilization is the transport system design. Poor transport system design during mine planning can result in too few or too may machines in relation to the number of of producing faces, resulting in underutilization of some of the LHDs (Mathiso, 2013).
Tramming distances and cycle time
The tramming distance can be defined as the one-way distance to the dumping point (as in the case of Conzal Mine) or as the two-way distance, which includes the distance travelled back to the loading point. Tramming distances have a direct influence on the cycle time of a machine, and long tramming distances reduce the rate of ore delivery (tons per hour) by the LHDs. This has an overall effect on the LHDs' ability to meet production targets. LHD efficiency generally starts to drop when the effective one-way tramming distances are greater than about 80 m (Leeuw, 2013). Massive production losses and inefficiencies can occur once the tramming distance exceeds this general rule-of-thumb distance.
Observations, results, and analysis
Tramming distances, cycle times, and other underground and surface observations were used to further understand working conditions and obtain data for analysis. Further useful information like the monthly tonnages, downtime, and availability and utilization data was obtained from the relevant mine departments.
Monthly tonnage
The original hoisted ore target at Conzal Mine was 2 000 t/d, which was later increased to 2 200 t/d when the Broken Hill Shaft was re-opened for production in April 2013. The tonnage statistics for 2013 are given in Table I.
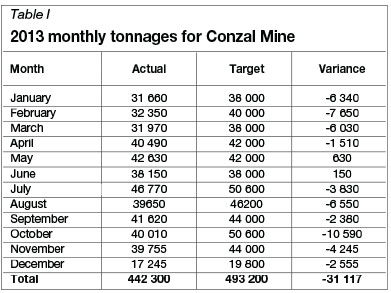
From Figure 3, it can be seen that Conzal failed to meet target for of 2013. Only during the months of May, June, and August was the mine able to meet its target. As a result, the variance in the tonnage for the entire year amounted to a value equivalent to one month's production (31 117 t).
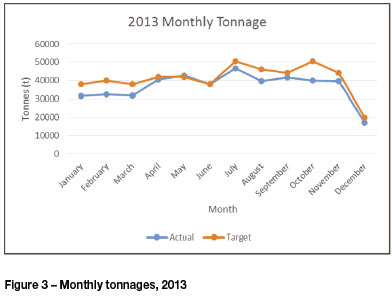
It can be clearly observed in Figure 3 that there was a sudden reduction in the production in December 2013. This is because the mine produces for only half the month due to public holidays and the customary Christmas break in South Africa. When considering tonnages in isolation, it is inconclusive whether the main cause of not meeting target is due to LHDs, as the tonnages produced depend on many other factors, such as:
➤ Poor or substandard mining operations in the form of bad shot-hole drilling and blasting practices
➤ Availability of blasted panels for loading as a result of poor ground conditions or even a loss of panels
➤ Stoppages of mining as a result of the Department of Mineral Resources (DMR) issuing Section 54 notices for dangerous or unsafe working conditions, which means the loss of several production days while the concerns are addressed.
Availability
The LHD availability was calculated based on the effective shift time. At Conzal the effective LHD shift time for the day and night shifts is 7 hours, and 6 hours for the afternoon shift; hence a total of 20 hours per day is available for tramming. Table II shows the average monthly availability of all LHDs at Conzal from 2011 to 2013.
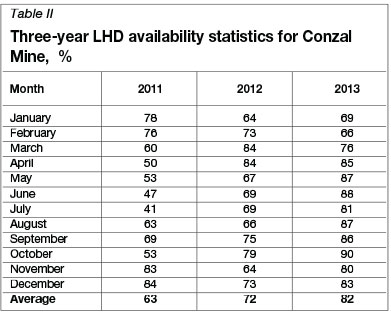
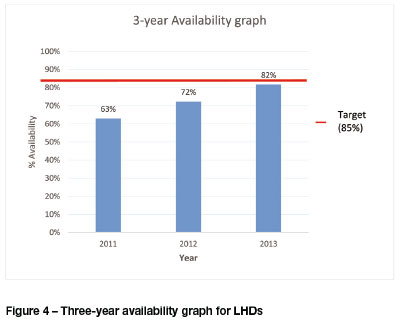
Figure 4 shows the availability of LHDs from 2011 to 2013. It can be seen that the availability of the machines has increase by 19%, from 63% in 2011 to 82% in 2013. The improvement was a result of the commissioning of a refurbished fleet in 2012 from Sandvik. The previous machines had been in continuous operation since 2004. As a result, older machines spent more time being repaired due to the high rate of component failure, which contributed to the low 63% availability in 2011. Although there has been a substantial increase in availability since then, it is still below the mine target of 85%.
Utilization
Effectively, only a maximum of eight LHDs are utilized per shift due to the number of available panels for loading. The selection of the eight LHDs designated for full-time operation was based on the age of the fleet. From the fleet of eleven LHDs, seven have been in operation for more than five years and the other four were commissioned in 2012. As a result, three of the older LHDs are used as standby units in case of breakdowns. Table III shows utilization values in 2013.
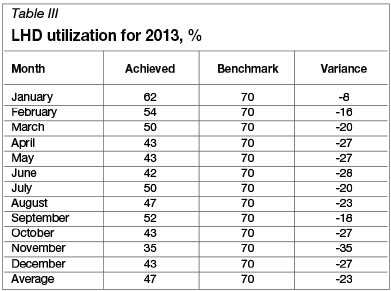
The utilization of LHDs at the mine is a major concern as it is critically low. During 2013 Conzal Mine achieved an average LHD utilization of 47%, which is far below the mine target of 70%.
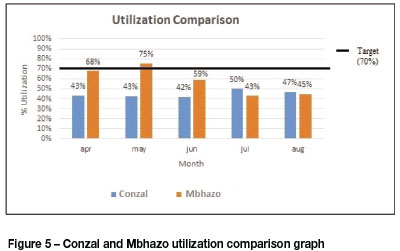
In order to obtain a better analysis of utilization, data was acquired from Mbhazo Mine, which utilizes the same mining method and machinery as Conzal. Only the months of April to August were taken into consideration because of the availability of data from Mbhazo. It can be seen from Figure 5 that the average utilization at Conzal was lower than at Mbhazo, despite the former marginally outperforming Mbhazo in July and August. The average utilization for Conzal for the period under consideration was 45%, while the average for Mbhazo was 58%. However a firm conclusion cannot be drawn from this comparison as the data covers only a short period. The situation could be different if data for a longer period, such as a year or more, could be compared.
Tramming distances
The tramming distances were measured from the plans provided by the surveyors. These were measured according to the sections in each shaft to get a better understanding of the average tramming distances. Table IV indicates the one-way tramming distances for the various sections at Conzal Mine.
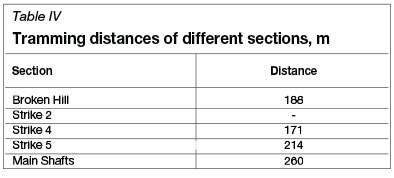
The average tramming distance for Strike 2 could not be measured due to the unavailability of an updated plan at that time, as well as the mine's SOP, which restricts personnel from walking on designated LHD routes and thus prohibits underground physical measurements.
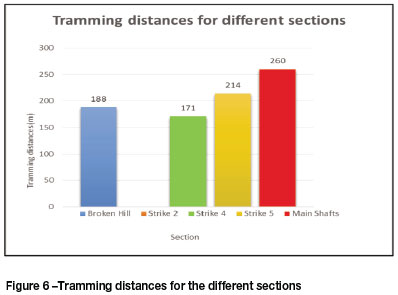
From the data collected one can clearly see that tramming distances are a serious concern. For LHDs to operate efficiently the one-way tramming distances should not be greater than the COP of 90 m. At Conzal, the average one-way distances for the sections measured were all significantly greater than 90 m. This resulted in great losses in efficiency and ultimately implied that the mine is not getting its return on investment from these machines because they are unable to tram the required tonnages to the tips. Figure 6 shows that the Main Shafts section had the longest tramming distances, followed by Strike 5 and Broken Hill.
As stated in the literature review, there is a relationship between long tramming distances and the tonnages produced by each section because long distances increase cycle times and consequently reduce tonnage output. This relationship between these three factors can be seen in Table V, which shows the tramming distances, cycle times, and tonnages produced in each section in December 2013.
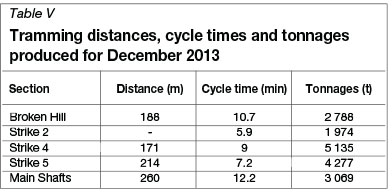
It should be noted that Strike 2 had four working panels, whereas the other sections had eight panels each. This meant the section was naturally bound to produce less than the other sections.
The data in the table shows clearly that tramming distances had a direct impact on the ability to meet production targets. The Main Shafts had the longest tramming distances and cycle times, which resulted in a lower tonnage than the other sections with an equal number of panels.
Cycle time
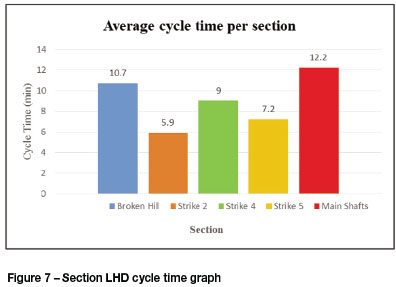
Several cycle times were recorded by means of a stopwatch over three days during the afternoon and night shifts across all the sections. The means of the readings are tabulated in Table VI.
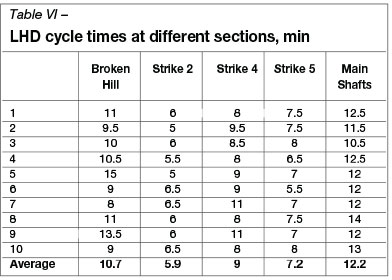
One can see the differences in cycle time according to different sections in Figure 7. The Main Shafts section has the longest average cycle times, followed by Broken Hill and then Strike 4. Lengthy cycle times can be attributed to many factors, varying from operator efficiency and attitude to badly designed tramming routes.
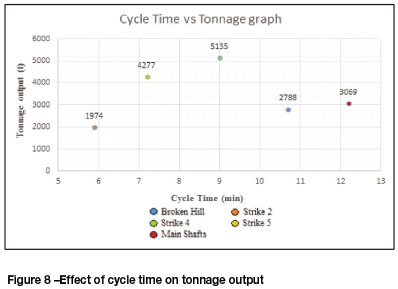
Lengthy cycle times have a direct impact on the tonnages trammed, since fewer cycles will be completed, resulting in poor production output. From Figure 8, one can see that there is an inverse relationship between cycle time and production output. As the cycle time increases, the tonnage outputs tend to decrease (apart from Strike 2, which had half the number of panels of the other sections).
As mentioned, badly designed tramming routes, which could manifest in the form of a rolling footwall, have bearing on cycle time. For example it was observed that Strike 4, despite having the shorted tramming distance, experienced long cycle times because of several issues. Firstly, the footwall was often was rolling and in some parts was unacceptably steep. Secondly, there was standing water on the footwall, which reduced traction. Figure 9 shows the roadway conditions at the time of the investigation at Strike 4.
Downtime
In December 2013, there were several issues, such as lack of spares, that led to certain LHDs experiencing lengthy downtimes. Table VII shows the downtime for different LHDs in the month.
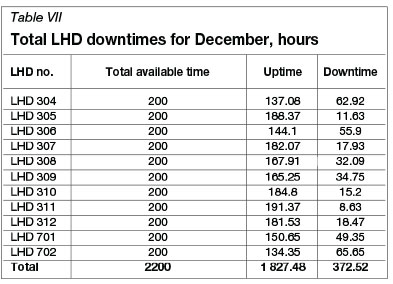
From the pie chart (Figure 10), it can be clearly seen that LHDs 304, 306, 701, and 702 had had the longest downtimes in December 2013. It should be noted that machines 304, 306, and 701 were old and had not being refurbished. Consequently these LHDs were used as standby machines, seeing that they were already spending a lot of time under repair.
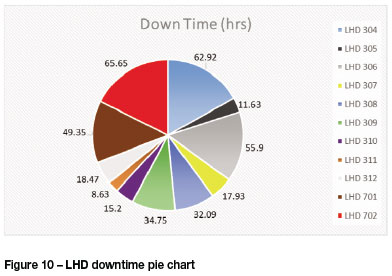
Figure 11 shows LHD 306 undergoing repairs after breaking its rear axle. Such breakdowns take approximately a whole shift to repair and if the spares are not available, it could take up to two days to get the machine back in service. For this particular machine, the downtime was two full days as the mine had to wait for the replacement part from the supplier.
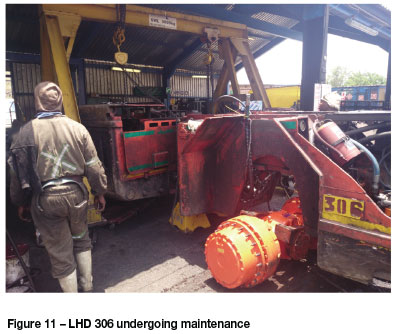
These downtimes have a huge impact on the tonnages hoisted. A loss of 352 t per operational LHD was experienced for the entire December period (see Appendix A for the calculation of this value). This illustrates the need for downtime to be minimized in order to maximize outputs.
LHD output simulations
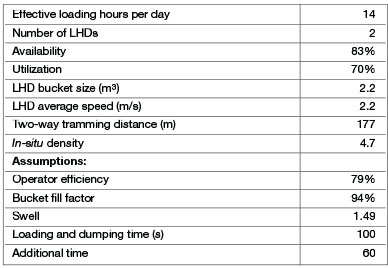
LHD simulations using Microsoft Excel® were conducted to quantify possible improvements in production when the tramming distances were reduced to the standard of approximately 90 m and the LHD utilization increased to the benchmark of 70%. A single month (December) was considered and the simulations were done for all the sections on the mine. In order to complete these simulations, a triangular distribution was carried out on factors such as operator efficiency, LHD bucket fill factor, and swell to simulate their random nature during loading and hauling operation. The basic equations that were used to complete the simulation were the cycle time, LHD payload, and LHD output per month. The calculations, as well as input variables, can be found in Appendix B. It should be stressed that the results of the simulations do not consider other factors such as blasting delays and interruption from engineering and other service department. To obtain a realistic potential LHD output subject to these considerations, more than a thousand random iterations were done for the two different scenarios:
➤ Scenario 1: the utilization was kept at the then-prevailing average value of 47% and the tramming distances were randomized through a triangular distribution based on the ideal one-way distance of 90 m
➤ Scenario 2: the utilization was set to a target value of 70% while the tramming distances were randomized as in scenario 1.
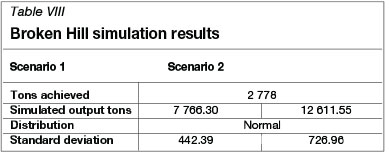
Broken Hill
Broken Hill section achieved only 2 778 t in December 2013. The results of the simulations, tabulated in Table VIII, indicate that the LHDs at Broken Hill section could achieve up to 7 866 t in the first scenario (approx. 90 m tramming distance and 47% utilization) and up to 12 612 t for the second scenario (approx. 90 m tramming distance and 70% utilization). This means that an increase of up to 179% can be achieved by just reducing the tramming distances to the optimum, and up to 352% by reducing tramming distances and increasing utilization.
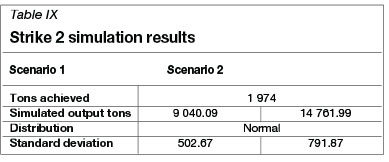
Strike 2
Strike 2 follows a similar trend to the Broken Hill section. Compared to the actual output of 1 974 t, the simulation results indicated that Strike 2 section's production could be improved by 358% in scenario 1 and 648% in scenario 2. Table IX shows the summary for this section.
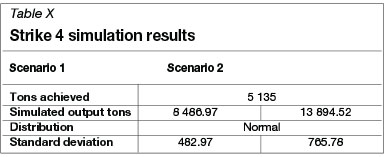
Strike 4
This section managed to achieve 5 135 t for the month of December. Based on the simulations, this section has the potential to improve by 65% and 171% for scenario 1 and 2 respectively. One can now see the effect of the tramming distances, as the increments are not as high as those for Broken Hill or Strike 2, since this section had shorter tramming distances than the others.
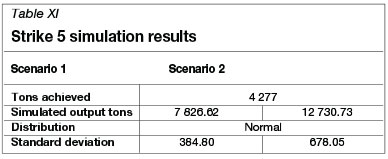
Strike 5
This section follows the same trend as the other sections with the simulations indicating that there would be an improvement in the output tonnages when the two scenarios are applied. The improvements based on Table XI are 83% and 198% for scenarios 1 and 2 respectively.
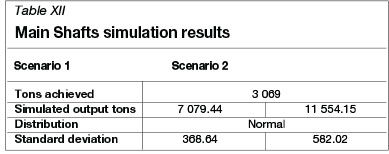
Main Shafts
The Main Shafts section performed relatively poorly in that it managed to produce only 3 069 t in December 2013. The simulated output of the LHDs in this section could be increased by up to 131% for the first scenario and 276% for the second scenario. This demonstrates that the extremely long tramming distances in this section constitute a serious bottleneck in the overall attainment of the mine's production target. Such long distances translate into very low LHD efficiencies.
Conclusions
LHD transportation needs to be designed in such a way that it is efficient and meets the production requirements of a mine. Conzal's production for 2013 was 442 283 t, against a target of 493 200 t.
Based on the analysis of the tonnages, availability and utilization figures, tramming distances, cycle times, breakdowns, and the LHD simulation results, it was concluded that the major factors preventing the LHDs from meeting the required production target were tramming distances and utilization. LHD simulations showed that the production outputs of all the sections could be increased considerably by decreasing tramming distances and increasing LHD utilization. This is because tramming distances have a direct impact on all the other issues investigated, and if the tramming is reduced to optimal distances, then all the other issues will mostly likely be alleviated. When the tramming distance is reduced:
➤ The cycle times will be reduced because the LHDs will be travelling a shorter distance at the same speed, which can translate to more ore being trammed in a given period
➤ Breakdowns are likely to be reduced because the machines will suffer less wear and tear
➤ The reduction in breakdowns will automatically improve availability, which will in turn further increase the ore tonnage trammed.
Recommendations
Based on the analysis of the results and observations, the following recommendations were made to address the factors that resulted in failure to meet production target.
➤ Tramming distances for all the sections must be reduced to less than 90 m. This can be achieved by extending the belts on all the sections on a regular basis to ensure that tramming distances are within the optimal distance
➤ The utilization of the LHDs needs to be improved significantly. A low utilization value is unacceptable for efficient tramming. Utilization can be improved in various ways, including reducing absenteeism and
increasing team spirit amongst the employees. The design of the tramming system also needs to be carefully re-evaluated to address any design errors that could lead to low utilization.
➤ Maintenance needs to be optimized so that LHD downtime can be reduced. This can be achieved by maintaining an adequate stock of spares in the mine store
Cycle time needs to be reduced, and this can be done by improving roadways and introducing an improved housekeeping system to ensure that they are maintained in good condition.
Acknowledgements
I would like to offer my special thanks to the following persons and organizations for their assistance with this investigation:
➤ The company referred to as Conzal Mine, for giving me the opportunity to conduct the investigation and fulfil the requirements of the project
➤ My project supervisors, P. Leeuw, D. Pretorius, and B. Mathiso for their generosity and dedication in assisting me to produce this report
➤ My mother and father, Mr and Mrs Mbhalati, for their love and constant support in times of difficulty and struggle
➤ The mining and engineering crews at the Mine for their assistance in acquiring the data and knowledge required for the project.
References
Inductive Automation. 2011. White Papers on Automation, Process Control & Instrumentation Topics. http://www.automation.com/pdf_articles/Whitepaper-Reduce-Downtime-Raise-OEE.pdf. [ Links ] [Accessed 21 April 2014].
Leeuw. P.K.J.. 2013. Mine Transportation. Notes for Mine Transportation course. University of the Witwatersrand. [ Links ]
Machine Downtime. 2014. Machine Downtime. http://machine-dowwntime.com/ [Accessed 23 April 2014]. [ Links ]
Mathiso, B. 2013. Maintenance coordinator [Interview] 9 December 2013. [ Links ]
Samancor Chrome. 2014a. About Us - Company Overview. http://www.samancorcr.com/content.asp?subID=2 [Accessed 15 April 2014]. [ Links ]
Samancor Chrome. 2014b. Our Business - Operations and Locations. http://www.samancorcr.com/content.asp?subID=8 [Accessed 15 April 2014]. [ Links ]
Samanta, B., Sarkar, B., and Mukherjee, S.K. 2004. Reliability modelling and performance analyses of an LHD system in mining. Journal of the South African Institute of Mining and Metallurgy, vol. 104, no. 1. pp. 1-8. [ Links ]
Paper written on project work carried out in partial fulfilment of BSc. (Mining Engineering)
1The actual mine name is omitted owing to the confidential nature of the information in this investigation.
Appendix A
Calculations of the tons lost per LHD for the month of December 2013:
➤ Total available tramming time for the eight full-time operational LHDs Tt = 1600 hours
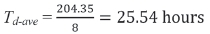
➤ Total downtime for the eight LHDs Td = 204.35 hours
➤ Total average downtime per LHD
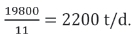
➤ Daily tonnage target =
Effective loading time per day = 20 hours
➤ Required tons per hour:

➤ Required tons per hour per LHD,
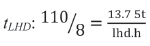
The total tons lost for December due to average downtime per LHD can be calculated as follows:
➤ Tons lost per LHD for December = Td-ave * tLHD
= 25.54 h * 13.75 t/h
= 351.23 t per LHD
Appendix B
Template of LHD simulation input variables
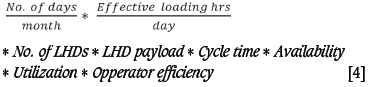
LHD output per month:
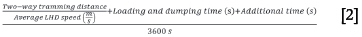
1. Cycle time (h) =
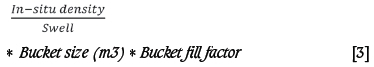
2. LHD payload (t) =
3. LHD output (t/month) =

