


Serviços Personalizados
Artigo
 Inglês (pdf)
 Artigo em XML
 Referências do artigo
Indicadores

Links relacionados
-
 Citado por Google
 -
 Similares em Google
Compartilhar

 Permalink
Journal of the Southern African Institute of Mining and Metallurgy
versão On-line ISSN 2411-9717
versão impressa ISSN 2225-6253
J. S. Afr. Inst. Min. Metall. vol.115 no.3 Johannesburg Mar. 2015
GENERAL PAPERS
Multifractal interpolation method for spatial data with singularities
Q. Cheng
Department of Earth and Space Science and Engineering, Department of Geography, York University, Toronto
SYNOPSIS
This paper introduces the multifractal interpolation method (MIM) developed for handling singularities in data analysis and for data interpolation. The MIM is a new moving average model for spatial mapping and interpolation. The model decomposes the raw data into two components: singular and nonsingular components. The former can be characterized by a localized singularity index that quantifies the scaling invariance property of measures from a multifractal point of view. The latter is a smooth component that can be estimated using ordinary kriging or other moving average models. The local singularity index characterizes the concave/convex properties of the neighbourhood values. The paper utilizes a binomial multiplicative cascade model to demonstrate the generation of one- and two-dimensional data with multi-scale singularities which can be modelled by asymmetrical multifractal distribution. It then introduces a generalized moving average mathematical model for analysing and interpolating data with singularities. Finally, it is demonstrated by a one-dimensional case study of de Wijs' data from a profile in a zinc mine, that incorporation of spatial association and singularity can improve the interpolation result, especially for observed values with significant singularities.
Keywords: data analysis, spatial mapping, moving average models, multrifractal interpolation.
Introduction
Since the term 'kriging' was coined by Georges Matheron in the early 1960s on the basis of Krige's master's thesis dealing with interpolation of point samples, geostatistics has been rapidly developed as a branch of science and relevant techniques have been commonly applied in many fields of science for mapping, estimation, simulation, and prediction (Journel and Huijbregts, 1978; Goovaerts, 1997). The International Association for Mathematical Geosciences (IAMG) is proud of the invention and further development of the subject by our members. Kriging and other geostatistical techniques have been widely applied outside of geosciences, where users unaware of its origins and mathematical evolution refer to it simply as a type of spatial analysis. The semivariogram, a function of distance between locations, can measure the spatial autocorrelation between values at locations separated by a distance. Models empirically fitted to semivariograms are used for assigning weights to linear equations whose solutions provide weighted averages for kriging data with stationarity (Goovaerts, 1997; Deutsch and Journel, 2008). Traditionally, kriging is for interpolating data in the neighbourhood and estimating values at locations where no data is available. Interpolation algorithms have been developed for a variety of simple, indicator, and higher-order kriging as well as kriging with transformed and compositional data. Algorithms for interpolation of data with anisotropic spatial association (e.g. Chiles and Delfiner, 1999), mixed categorical and/or continuous data (Journel and Huijbregts, 1978; Goovaerts, 1997), and compositional data (Pawlowsky-Glahn and Olea, 2004), have been created.
Case studies comparing these methods are available in the literature (e.g. Park and Jang, 2014). Application of kriging depends heavily on stationarity of the mean and second-order moments involving the variogram and standard deviation of a regionalized random variable. Simple kriging (SK) may be applied if the mean of the data has a known but constant trend, whereas ordinary kriging (OK) may be applied if the trend is constant but unknown. If the trend is unknown but follows some polynomial model, other types of kriging accounting for trends can be used (Hansen et al., 2010). In most cases stationarity of second order moments is also assumed. However, the real data, especially exploratory data involved in characterizing mineralization and hazardous events, often does not meet stationarity requirements because of singularities.
A new approach is the multiple point geostatistics which is a new field of spatial and temporal analysis (Mariethoz and Caers, 2014). Multiple point geostatistics uses training images to quantify and to include structural information into stochastic simulation (Guardiano and Srivastava, 1993;Strebelle, 2002).
The multifractal interpolation method (MIM) based on multifractal theory (Cheng, 1999a, 2000) has been developed for the analysis and interpolation of data with singularities. Multifractal theory integrates both spatial association and local singularities and can enhance and retain the local structure properties (Cheng, 2006a,b). This paper introduces a generalized binomial multiplicative cascade process to demonstrate the generation of one- and two-dimensional data with multi-scale singularities which can be modelled by asymmetrical multifractal distribution. It will then introduce a generalized moving average mathematical model for analyzing and interpolating between data with singularities. Finally the method will be demonstrated by a one-dimensional example.
Multiplicative cascade processes and multifractal distributions
Singular physical, chemical, and biological processes can result in anomalous energy release, mass accumulation, or matter concentration, all of which are generally confined to narrow intervals in space or time (Cheng, 2007a). The end products of these nonlinear processes can be modelled as fractals or multifractals. Singularity is a property of nonlinear natural processes, examples of which include, but are not limited to, cloud formation (Schertzer and Lovejoy 1987), rainfall (Veneziano 2002), hurricanes (Sornette, 2004), flooding (Malamud et al., 1996; Cheng 2008; Cheng et al., 2009), landslides (Malamud et al., 2004), forest fires (Malamud et al.,1996), earthquakes (Turcotte 1997), mineral deposits and related geochemical anomalies (Agterberg, 1995; Cheng et al., 1994; Xie and Bao, 2004; Cheng and Agterberg, 2009), solar wind turbulence (Macek, 2007), DNA series (Rosas et al., 2002), heat flow at the mid oceanic ridges (to be published by the author elsewhere) and landscape textures (Plotnick et al., 1993). Multifractal modeling involves quantification of multi-scale singularities and various types of properties associated with spatial distribution of the singularities (Halsey et al., 1986; Feder, 1988; Mandelbrot, 1989; Evertsz and Mandelbrot, 1992). This section introduces an asymmetrical cascade process that generates results with singularities characterized by asymmetrical multifractal models. There are several formalisms for describing multifractal distributions, one of which is the multifractal model based on the partition function (Halsey et al., 1986). This model involves three functions: the mass exponent function or Renyi exponent ţ(q), the coarse Holder exponent a(q), and the fractal spectrum function /(α) (Halsey et al., 1986).
In order to demonstrate the singularities and their distributions in one- or two-dimendional data, I introduce the theories and concepts of multiplicative cascade processes (MCPs), which play a fundamental role in quantifying turbulent intermittency and other nonlinear processes (Schertzer and Lovejoy 1985, Schertzer et al. 1997). MCPs have been extensively discussed in the literature (e.g. Gupta and Waymire 1993, Over and Gupta 1996, Menabde and Sivapalan 2000; Serinaldi 2010). The model of de Wijs is a simple two-dimensional multiplicative cascade model (de Wijs 1951, Agterberg 2001, 2007a) described in terms of multiplicative canonical cascade processes (Lovejoy and Schertzer, 2007). Other modifications exist, e.g. a cascade model with functional redistribution rate (Agterberg 2007b); a two-dimensional cascade model with anisotropic partition (Cheng 2005); a generalized two-parameter binomial multiplicative model as proposed by Koscielny-Bunde et al. (2006) and applied for describing multifractal spectra of runoff time series; a three-parameter binomial multifractal model proposed by Macek (2007) and applied to characterize solar wind turbulence data based on a generalized two-scale weighted Cantor set for characterizing asymmetrical multifractal distribution; a two-dimensional cascade model with variable and conditional dependence partition (Cheng, 2012); and a five-parameter binomial multiplicative cascade model has been recently proposed by the author (Cheng, 2014) for describing fundamental multifractal indices characterizing asymmetrical multifractal distribution of real-world data.
The five-parameter generalized multiplicative cascade processes involve the partitioning of with a length L (e.g. in unit of meter) into h equal segments of which m1 receive d1 (> 0) and m2 receive d2 (> 0) proportion of mass in the previous segment, respectively, where m1 + m2 < h. For a closed system with preservation of unit measure (e.g. with total mass M), d1 + d2 = 1. Otherwise, d1 + d2 < 1 or d1 + d2 > 1, corresponding to a loss or gain of mass during the cascade process, respectively. At the nth partition, the segment length will be sn = L(1/h)n; the segments are subject to k times segments with measure d1/m1 and n - k times segments with measure d2/m2, and thus the measures of these segments are 'κ = M(d1/m1)k(d2/m2)n-k. Therefore, the numbers of segments with 'kwill be  Letting n ―> ∞ we can find series of n and k with k = ξ n, 0 <ξ < 1, where ξ is independent of n or k. We then obtain the following relationships
where α is the coarse Holder exponent which quantifies the singularity of the distribution of '
and the subset of segments with singularity α is an intertwined set which is a fractal with fractal dimension /(α). The number of segments in each of the intertwined fractals can be expressed as
where /(α) is the fractal dimension spectral function, which can be expressed as
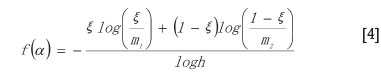
It can be seen from Equations [1] to [4] that both the measure 'κ and Nk follow power-law relationships at scale en. Since the value of ξ falls within the range [0, 1], the value of the singularity index takes any value between amin and amax following the linear relationship between α (ξ) and ξ:
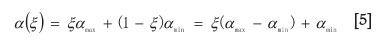
where the maximum and minimum values of singularity α are
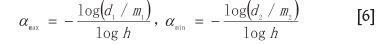
assuming d1/m1 > d2/m2; otherwise, the two extremes will be reversed. Accordingly, the corresponding fractal dimensions with special singularities are shown to be
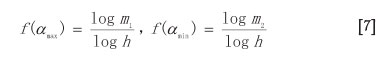
The multifractality and symmetry of the multifractal distribution can be characterized by the asymmetry and multifractality indices
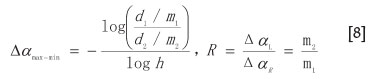
The asymmetry index corresponds to the ratio of the values m2 and m1; whereas the multifractality is proportional to the ratio of average measures, (d1/m1)/(d2/m2).
Singularities and nonstationarity
The singularity in the multifractal model introduced in the previous section characterizes how the statistical behaviour varies as the measuring scale changes. For example, at some locations the mean value calculated from the neighbourhood values might be independent of the size of the vicinity within which the values are averaged. In other cases, the mean value might proportionally depend on the size of the vicinity. The former case represents nonsingular location but the latter is for singular location. Singularity property has been commonly observed in geochemical and geophysical quantities (Cheng et al., 1994). Generally speaking, as the size of segment sn ―> O (n ―> ∞ ), then the measure defined for each segment (Equation [1]) tends to zero and the number of segments tends to infinity. In order to explain the singularity of geochemical and geophysical quantities according to the notation of the multifractal model shown in Equations [1]-[7], the 'fractal density' of measure with singularity (α) is defined by the author as the ratio of mass '(en) over scale εα which can be calculated as follows:

the new fractal density pa has a unit of Μ over the unit of La, for example, g/mo.3.

where 'α = 1- α represents an index quantifying the local singularity of the measure at locations with singularity α. The ordinary density ρ can be decomposed into two components: fractal density ρα and ε-'α, the former is independent of scale ε whereas the latter dependent on the scale. The former component is a non-singular component and the latter is singular component if the singularity index 'α≠ 0. The inconvenience property of the measure with following singularity properties implies nonstationarity of the measure or the density (Cheng, 1999a):
(1) α = 1 or 'α = 0, if ρ (ε) = constant, independent of scale size ε
(2) α < 1, 'α > 0, if ρ (ε) is a decreasing function of ε, which normally implies the 'convex' property of '(ε) at the location with α
(3) α > 1, 'α < 0, if ρ (ε) is an increasing function of ε, which normally implies the 'concave' property of '(ε) at the location with α.
Therefore, the α-values as the fractal dimension of the fractal density (Δα - value as the co-dimension) can be used to characterize the nonlinear structural property of the measure '(ε). This approach has already been used for texture analysis of remote sensing Landsat TM images (Cheng, 1997b, 1999c), in multifractal interpolation of geochemical concentration values for mineral exploration (Cheng, 1999a, 2000a, 2000b), in well log curve reconstruction (Li and Cheng, 2001), flood event modelling (Cheng et al., 2009), in hyperspectral image analysis (Neta et al., 2010), faults and geochemistry (Wang et al., 2013), and in geochemical element concentration mapping (Chen et al., 2007; Zuo et al., 2009).
In order to introduce how singularities can be included in data interpolation, we here introduce the following scale-invariant property of the measure, '(ε) and density, ρ (ε). Due to the properties of power-law type functions we can associate the densities at two different scales and as follows
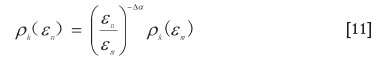
The MIM to be introduced in the next section is developed according to the scale invariance property (Equation [11]).
MIM incorporating spatial association and singularity
Statistical properties derived at one scale may be used to estimate properties at another scale on the basis of the scaling property (Cheng, 1999a, 2000). The main purpose of data interpolation, including kriging, is to estimate values at unknown locations based on the neighbourhood values and their spatial association with the value being estimated. Spatial association represents a type of statistical dependency of values at separate locations. If the value at a location (x) is considered as the realization of a regionalized random variable Z(x), the spatial association or variability can be measured by means of the variogram

where the semivariogram y(x, h) is a function of vector distance h separating locations x and x + h, measuring the symmetrical variability between Z(x) and Z(x + h). Under an assumption of second-order stationary, the semivariogram (Equation [12]) becomes a function of h that is independent of location x. This strong assumption on the nature of the regionalized random variable is generally required in kriging. Equation [12] has been commonly used for structural analysis and interpolation in geostatistics (Journel and Huijbregts, 1978). It has also been applied for texture analysis in image processing (Atkinson and Lewis, 2000; Herzfeld and Higginson, 1996).
To incorporate both spatial association and singularity in supporting the interpolation model based on Equation [11], the following average density within a small vicinity | (x0, ε) around location x0 with linear size ε was defined by Cheng (2006)

Assume that Equation [11] holds true within a range of window sizes, ε<ε<ε<εmax. Then the average density ρ (ε, x0) within the window | (x0, ε), where it may not contain samples with observed values, can be associated with the average density within the larger window | (x0 εmax, where it contains samples with observed values and can be estimated by kriging as follows:
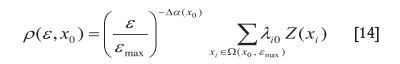
Equation [14] is a general weighted average model that can be used to estimate the value at the centre of ρ(ε, x0) from the neighbourhood values within | (x0, (Cheng, 1999a, b, 2006). Since the above discussions are valid for all dimensions and here we will use E to present the dimension of problem, E=1, 2, 3 stand for 1D, 2D and 3D problems. It has the following properties :
(1) If it does not show singularity, α = E or 'α = 0, then Equation [14] reduces to the ordinary moving average function that has been used commonly in kriging and other data interpolation methods
(2) If all locations show the same singularity strength with α = constant or 'α = constant, then Equation [14] becomes the same as the ordinary moving average function used in kriging and other methods
(3) If the singularity varies from location to location, α* constant or 'α* constant, then Equation [14] is equivalent to the ordinary moving average function multiplied by a scale ratio factor, (ε / εmax)-Δα, with three possible situations given ε < εmax :
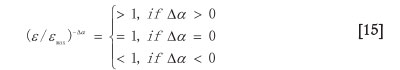
These properties indicate that if the data used for interpolation satisfies a multifractal distribution, then Equation [14] must be used as an extended form of the ordinary weighted averaging model. In this case, the scale ratio factor modifies the ordinary average in such a way that if there is positive singularity with 'α > 0, then the new result is to be increased by a factor (Equation [15]), whereas if 'α < 0, then the new result is reduced by a factor (Equation [15]). This modification is reasonable because 'α > 0 and 'α < 0 correspond to convex and concave properties of the surface ρ (ε, x0) around the location x0, respectively.
The new model (Equation [14]) not only describes the spatial association reflected in the calculation of the weight λ, but also incorporates the singularity characterized by the singularity index α. The new model therefore has two obvious advantages: it not only improves the accuracy of the interpolated results but also retains the local structure of the interpolation map. The latter property is essential for geochemical and geophysical data processing and for pattern recognition. This will be demonstrated using the assay values from the Pulacayo sphalerite-quartz vein in Bolivia studied by De Wijs (1951).
Analysis of de Wijs's Bolivia sphalerite data
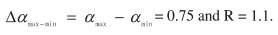
De Wijs (1951) studied assay values from the Pulacayo sphalerite-bearing quartz vein in Bolivia. Along a drift 118 channel samples had been collected at 2.00 m intervals (Figure 1A). These values have been analysed by multifractal modeling and spatial analysis (Cheng and Agterberg, 1996; Cheng, 1997b) and they can be approximated by five-parameter binomial multiplicative cascade models (Cheng, 1999c, 2014). The fractal dimension spectra of the distribution of de Wijs's zinc values are estimated by the gliding window method with order of moment ranging from -20 to 20 and cell size ε ranging from 2 m to 30 m (Cheng, 1999c) (Figure 2) and fitted by the five-parameter binominal multiplicative cascade model (Cheng, 2014) (seen in Figure 2). The estimated values of ƒ (α) are as follows
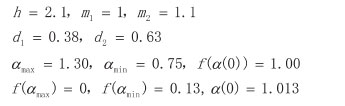
Therefore,
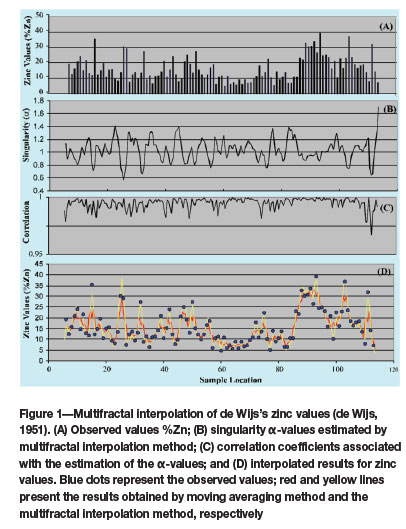
The results indicate that the distribution follows a multifractal model that is nearly symmetrical (Aamax - min > 0).
In order to show the distribution of singularity and the data interpolation results, Figure 1B shows the resulting distribution of singularity values calculated for the data and the correlation coefficients associated with the linear model fitted after double log-transformation of measure and scale. It shows that the estimated values of α are within a range from 0.6 to 1.4 with correlation coefficients greater than 0.975 (Figure 1C). Figure 2D illustrates the interpolated and reconstructed results obtained by means of MIM and moving averaging. The yellow line represents the results obtained using MIM with window size 20 m (10 point values) and the thicker red line represents the results obtained using the averaging technique with window size 6 m (two to three point values). The blue dots represent the observed data. Comparing the results obtained using MIM and moving averaging shows that MIM provides better results not only with smaller fitting errors for the observed data, but also that localized multifractality of the data is preserved.
Discussion and conclusions
It has been demonstrated that the multifractal distribution generated by binomial multiplicative cascade processes has multiple singularities that can be quantified by singularity index and fractal dimension spectrum. According to MIM, the singularity of multifractally distributed data can be used in data interpolation for mapping purposes with the localized structural properties (multifractality) preserved. The model used in MIM can be considered as an extended form of the ordinary moving average or weighted average used in various data interpolation methods, including inverse distance weighting and kriging. For most quantities in exploration geochemistry showing singularities, in order to retain the localized structural property, the multifractal interpolation method can be used to extend the ordinary moving average techniques, including ordinary kriging.
Since the singularity can be estimated using various methods, for example, integration of multiple patterns by weights of evidence method (Cheng, 2012) and other anisotropic cascade processes (Cheng, 2004), more general structural property and generalized self-similarity characterized by the singularity can be incorporated in the data interpolation. The multifractal interpolation based on prior knowledge and training images should be further explored
Acknowledgements
The author wishes to thank Professor Richard Minnitt for accepting this paper for the Danie Krige Commemorative Volume. Thanks are due to Dr Frits Agterberg and Dr Zhijun Chen for their critical review of the paper and constructive comments. This research has been jointly supported by a research project on 'Quantitative models for prediction of strategic mineral resources in China' (201211022) by China Geological Survey, and by NSERC Discovery Research 'Research and development of multifractal methods and GIS technology for mineral exploration and environmental assessments' (ERC-OGP0183993).
References
Agterberg, F.P. 1995. Multifractal modeling of the sizes and grades of giant and supergiant deposits. International Geology Review, vol. 37. pp. 1-8. [ Links ]
Agterberg, F.P. 2001. Multifractal simulation of geochemical map patterns. Geologic Modeling and Simulation: Sedimentary Systems. Merriam, D.F. and Davis J.C. (eds.). Kluwer, New York. pp. 327-346. [ Links ]
Agterberg, F.P. 2005. Application of a three-parameter version of the model of de Wijs in regional geochemistry. GIS and Spatial Analysis. Proceedings of IAMG2005, Toronto. Cheng, Q. and Bonham-Carter, G.F. (eds.). International Association for Mathematical Geosciences., Kingston, ON, Canada. pp. 291-296. [ Links ]
Agterberg, F.P. 2007a. New applications of the model of de Wijs in regional geochemistry. Mathematical Geology, vol. 39. pp. 1-26. [ Links ]
Agterberg, F.P. 2007b, Mixtures of multiplicative cascade models in geochemistry. Nonlinear Processes in Geophysics, vol. 14. pp. 201-209. [ Links ]
Atkinson, P.M. and Lewis, P. 2000. Geostatistical classification for remote sensing: an introduction. Computers and Geosciences, vol. 26. pp. 361-371. [ Links ]
Chen, Z., Cheng, Q., Chen, J., and Xie, S. 2007. A novel iterative approach for mapping local singularities from geochemical data, Nonlinear Processes in Geophysics, vol. 14, no. 3. pp. 317-324. [ Links ]
Cheng, Q. 1997a. Discrete multifractals. Mathematical Geology, vol. 29. pp. 245-266. [ Links ]
Cheng, Q. 1997b. Multifractal modelling and lacunarity analysis. Mathematical Geology, vol. 29. pp. 919-932. [ Links ]
Cheng, Q. 1999a. Multifractal interpolation. Proceedings of the Fifth Annual Conference of the International Associationfor Mathematical Geology, Trondheim, Norway. vol. 1. Lippard, S.J., Naess, Α., and Sinding-Larsen, R. (eds.). pp. 245-250. [ Links ]
Cheng, Q. 1999b. Multifractality and spatial statistics. Computers and Geosciences, vol. 25, no. 9. pp. 949-961. [ Links ]
Cheng, Q. 1999c. The gliding box method for multifractal modeling. Computers and Geosciences, vol. 25. pp. 1073-1079. [ Links ]
Cheng, Q. 2000. Interpolation by means of multiftractal, kriging and moving average techniques. GeoCanada 2000. Proceedings of the GAC/MAC Meeting, Calgary, AB, Canada 29 May-2 June 2000. [ Links ] [CD-ROM]. Geological Association of Canada, St. John's, NF, Canada.
Cheng, Q. 2001. Α multifractal and geostatistical method for modeling geochemical map patterns and geochemical anomalies. (In Chinese with English abstract.) Journal of Earth Science, vol. 26. pp. 61-166. [ Links ]
Cheng, Q. 2004. Α new model for quantifying anisotropic scale invariance and for decomposition of mixing patterns. Mathematical Geology, vol. 36. pp. 345-360. [ Links ]
Cheng, Q. 2005. Multifractal distribution of eigenvalues and eigenvectors from 2D multiplicative cascade multifractal fields. Mathematical Geology, vol. 37. pp. 915-927. [ Links ]
Cheng, Q. 2006a. A new model for incorporating spatial association and singularity in interpolation of exploratory data. Geostatistics Banff2004. Quantitative Geology and Geostatistics 14. Leuangthong, D. and Deutsch, C.V. (eds.). Springer, New York. pp. 1017-1026. [ Links ]
Cheng, Q. 2007a. Mapping singularities with stream sediment geochemical data for prediction of undiscovered mineral deposits in Gejiu, Yunnan Province, China. Ore Geology Reviews, vol. 32.3. pp. 14-324. [ Links ]
Cheng, Q. 2006b. GIS based fractal/multifractal anomaly analysis for modeling and prediction of mineralization and mineral deposits, in GIS for Geosciences', Jeff Harris and Denny Wright (eds.), Geological Association of Canada. pp. 285-296. [ Links ]
Cheng, Q. 2007b. Multifractal imaging filtering and decomposition methods in space, Fourier frequency, and eigen domains. Nonlinear Processes in Geophysics, vol. 14. pp. 293-303. [ Links ]
Cheng, Q. 2008. Non-linear theory and power-law models for information integration and mineral resources quantitative assessments. Mathematical Geosciences, vol. 40. pp. 503-532. [ Links ]
Cheng, Q. 2012. Multiplicative cascade processes and information integration for predictive mapping. Nonlinear Processes in Geophysics, vol. 19. pp. 57-68. [ Links ]
Cheng, Q. 2014. Generalized binomial multiplicative cascade processes and asymmetrical multifractal distribution. Nonlinear Processes in Geophysics 21. pp. 477-487. [ Links ]
Cheng, Q. and Agterberg, F.P. 1996. Multifractal modeling and spatial statistics. Mathematical Geology, vol. 28. pp. 1-16. [ Links ]
Cheng, Q. and Agterberg, F.P. 2009. Singularity analysis of ore-mineral and toxic trace elements in stream sediments. Computers and Geosciences, vol. 35. pp. 234-244. [ Links ]
Cheng, Q., Li, L., and Wang, L. 2009. Characterization of peak flow events with local singularity method. Nonlinear Processes in Geophysics, vol. 16. pp. 503-513. [ Links ]
Cheng, Q., Agterberg, F.P., and Ballantyne, S.B. 1994. The separation of geochemical anomalies from background by fractal methods. Journal of Exploration Geochemistry, vol. 51. pp. 109-130. [ Links ]
Chiles, J.P. and Delfiner, P. 1999. Geostatistics, Modeling Spatial Uncertainty. Wiley, New York. [ Links ]
De Wijs, H.J. 1951. Statistics of ore distribution, part I. Geologie en Mijnbouw, vol. 13. pp. 365-375. [ Links ]
Deutsch, C.V. and Journel, A.G. 2008. GSLIB: Geostatistical Software Library and User's Guide. Oxford University Press, New York, NY. 2nd edn. [ Links ]
Evertsz, C.J.G. and Mandelbrot, B.B. 1992. Multifractal measures. Chaos and Fractals. Peitgen, H-O., Jürgens, H., and Saupe, D. (eds.). Springer, New York. pp. 922-953. [ Links ]
Feder, J. 1988. Fractals. Plenum Press, New York. 283 pp. [ Links ]
Guardiano, F. and Srivastava, R.M. 1993. Multivariate Geostatistics: Beyond Bivariate Moments. In Soares, A., (ed.) Geostatistics-Troia. Kluwer Academic Publications. 1. pp. 133-144. [ Links ]
Goovaerts, P. 1997. Geostatistics for Natural Resources Evaluation, Oxford University Press, New York, NY. [ Links ]
Gupta, V.K. and Waymire, E.C. 1993. A statistical analysis of mesoscale rainfall as a random cascade. Journal of Applied Meteorology, vol. 32. pp. 251-267. [ Links ]
Halsey, T.C., Jensen, M.H., Kadanoff, L.P., Procaccia, I., and Shraiman, B.I. 1986. Fractal measures and their singularities: the characterization of strange sets. Physical Review A, vol. 33, no. 1. pp. 141-151. [ Links ]
Hansen, T.M., Mosegaard, K., and Schi0tt, C.R. 2010. Kriging interpolation in seismic attribute space applied to the South Arne Field, North Sea. Geophysics, vol. 75. pp. 31-41. [ Links ]
Herzfeld, U.C. and Higginson, C.A. 1996. Automated geostatistical seafloor classification: principles, parameters, feature vectors, and discrimination criteria. Computers and Geosciences, vol. 22, no. 3. pp. 5-52. [ Links ]
Journel, A.G. and Huijbregts, Ch.J. 1978. Mining Geostatistics. Academic Press, New York. [ Links ]
Li, Q. and Cheng, Q. 2001. Fractal correction of well logging curves. Journal of China University of Geosciences, vol. 12. pp. 272-275. [ Links ]
Koscielny-Bunde, E., Kantelhardt, J.W., Braund, P., Bunde, A., and Havlin, S. 2006. Long-term persistence and multifractality of river runoff records: detrended function studies. Journal of Hydrology, vol. 322. pp. 120-137. [ Links ]
Lovejoy, S. and Schertzer, D. 2007. Scaling and multifractal fields in the solid Earth and topography. Nonlinear Processes in Geophysics, vol. 14. pp. 465-502. [ Links ]
Macek, W.M. 2007 Multifractality and intermittency in the solar wind. Nonlinear Processes in Geophysics, vol. 14. pp. 695-700. [ Links ]
Malamud, B.D., Turcotte, D.L., and Barton, C.C. 1996. The 1993 Mississippi River flood: a one hundred or a one thousand year event? Environmental and Engineering Geoscience, vol. 2. pp. 479-486. [ Links ]
Malamud, B.D., Turcotte, D.L., Guzzetti, F., and Reichenbach, P. 2004. Landslide inventories and their statistical properties. Earth Surface Processes Landforms, vol. 29. pp. 687-711. [ Links ]
Mandelbrot, B.B. 1989. Multifractal measures, especially for the geophysicist. Pure and Applied Geophysics, vol. 131. pp. 5-42. [ Links ]
Menabde, M. and Sivapalan, M. 2000, Modeling of rainfall time series and extremes using bounded random cascades and Levy-stable distributions. Water Resources Research, vol. 36, no. 11. pp. 3293-3300. [ Links ]
Mariethoz, G. and Caers, J. 2014. Multiple-point Geostatistics: Stochastic Modeling with Training Images. Wiley-Blackwell. [ Links ]
Neta, T., Cheng, Q., Bello, R., and Hu, B. 2010. Upscaling reflectance information of lichens and mosses using a singularity index: a case study of the Hudson Bay Lowlands, Canada. Biogeosciences, vol. 7. pp. 2557-2565. [ Links ]
Park, N.W. and Jang, D.H. 2014, Comparison of geostatistical kriging algorithms for intertidal surface sediment facies mapping with grain size data. The Scientific World Journal, vol. 2014, Article ID 145824. 11 pp. [ Links ]
Pawlowsky-Glahn, V. and Olea, R.A. 2004. Geostatistical Analysis of Compositional Data. Oxford University Press, New York, NY. [ Links ]
Plotnick, R.E., Gardner, R.H., and O'Neill, R.V. 1993. Lacunarity indices as measures of landscape texture. Landscape Ecology, vol. 8, no. 3. pp. 201-211. [ Links ]
Over, T.M. and Gupta, V.K. 1996. A space-time theory of mesoscale rainfall using random cascades. Journal of Geophysical Research, vol. 101 (d21). pp. 26319-26331. [ Links ]
Rosas, A., Nogueira, Ε. Jr., and Fontanari, J.F. 2002. Multifractal analysis of DNA walks and trails. Physical Review E, vol. 66. pp. 061906-1 061906-6. [ Links ]
Schertzer, D. and Lovejoy, S. 1985. The dimension and intermittency of atmospheric dynamics - multifractal cascade dynamics and turbulent intermittency. Turbulent Shear Flow. Launder, B. (ed.). Springer-Verlag, New York. pp. 7-33. [ Links ]
Schertzer, D. and Lovejoy, S. 1987. Physical modeling and analysis of rain and clouds by anisotropic scaling of multiplicative processes. Journal of Geophysical Research, vol. 92. pp. 9693-9714. [ Links ]
Schertzer, D., Lovejoy, S., Schmitt, F., Chigirinskaya, Y., and Marsan, D. 1997. Multifractal cascade dynamics and turbulent intermittency. Fractals, vol. 5. pp. 427-471. [ Links ]
Serinaldi, F. 2010. Multifractality, imperfect scaling and hydrological properties of rainfall time series simulated by continuous universal multifractal and discrete random cascade models. Nonlinear Processes in Geophysics, vol. 17. pp. 697-714. [ Links ]
Sornette, D. 2004. Critical Phenomena in Natural Sciences: Chaos, Fractals, Selforganization and Disorder. 2nd edn. Springer, New York. [ Links ]
Strebelle, S. 2002. Conditional Simulation of Complex Geological Structures Using Multiple-Point Statistics. Mathematical Geology, vol. 34. pp. 1-21. [ Links ]
Turcotte, D.L. 1997. Fractals and chaos in geology and geophysics. 2nd edn. Cambridge Univsity Press, Cambridge, UK. [ Links ]
Veneziano, D. 2002. Multifractality of rainfall and scaling of Bintensity-duration-frequency curves. Water Resources Research, vol. 38. pp. 1-12. [ Links ]
Wang, W., Zhao, J., and Cheng, Q. 2013. Fault trace-oriented singularity mapping technique to characterize anisotropic geochemical signatures in Gejiu mineral district, China. Journal of Geochemical Exploration, vol. 134. pp. 27-37. [ Links ]
Xie, S. and Bao, Z. 2004. Fractal and multifractal properties of geochemical fields. Mathematical Geology, vol. 36. pp. 847-864. [ Links ]
Zuo, R., Cheng, Q., Agterberg, F.P., and Xia, Q. 2009. Application of singularity mapping technique to identify local anomalies using stream sediment geochemical data, a case study from Gangdese, Tibet, western China. Journal of Geochemical Exploration, vol. 101. pp. 225-235. [ Links ]

