


Serviços Personalizados
Artigo
 Inglês (pdf)
 Artigo em XML
 Referências do artigo
Indicadores

Links relacionados
-
 Citado por Google
 -
 Similares em Google
Compartilhar

 Permalink
Journal of the Southern African Institute of Mining and Metallurgy
versão On-line ISSN 2411-9717
versão impressa ISSN 2225-6253
J. S. Afr. Inst. Min. Metall. vol.115 no.3 Johannesburg Mar. 2015
GENERAL PAPERS
A comparison of models for the recovery of minerals in a UG2 platinum ore by batch flotation
N.V. RamlallI; B.K. LovedayII
ISGS South Africa
IISchool of Chemical Engineering, University of KwaZulu Natal
SYNOPSIS
A study was carried out to evaluate various batch flotation models for the recovery of minerals in a UG2 platinum ore. The major minerals in a UG2 ore can be grouped as platinum group minerals, chromite, and siliceous gangue. This study also examined the entrainment of minerals during flotation. The models were ranked using statistical methods and an analysis of model-fit residuals. Entrainment parameters obtained from model fitting were evaluated for logic using a simple mineral-to-water ratio versus time plot. The foremost conclusion from the study was the importance of entrainment modelling. The measurement of water recovery increased the size of the data-set, and the inclusion of a simple entrainment model was statistically significant. The overall fit to the data was improved, and the entrainment model provided logical information on the recovery of gangue minerals that were not considered to be floatable.
Keywords: Batch flotation modelling, entrainment modelling, PGM flotation.
Introduction
The batch flotation test is used extensively in mineral processing for assessing the effect of flotation reagents on mineral floatability and depression, and for the characterization of an ore with respect to mineral recovery and upgrading. It has also been used, in combination with plant data, for examining potential improvements in plant performance through simulation. In most cases, periodic hand-scraping is the preferred method of removing froth, allowing separation to occur in the froth between scrapes.
More recently, the batch flotation test has been used to assess the variability in mineral recovery for a range of samples taken across an orebody. Samples of UG2 ore, for expansion of current mining activities or new projects, are usually obtained using diamond drill core sampling. The sample mass obtained from this type of sampling is generally 2-3 kg. Therefore, the batch flotation test must be developed for a limited sample mass, and provide quantitative information on the changes in flotation response.
The fitting of a batch flotation model to mineral recovery data is necessary for obtaining a better understanding of the floatability of the main mineral types. A suitable model is required for providing a reasonable description of the mineral recovery, and the model parameters should be meaningful. The model parameters, together with appropriate scale-up parameters, are used to evaluate various flotation circuit configurations.
Fichera and Chudacek (1992) reviewed different batch flotation models, but these were applied to the desirable floatable minerals (i.e. the valuables) -their study did not examine entrainment and the modelling of gangue minerals, which are usually 'less floatable' than the valuable minerals. These minerals can be recovered due to association (interlocking) with floatable minerals, flotation, and entrainment.
The objective of this study was to evaluate the application of batch flotation models (including entrainment) for the recovery of the valuable minerals and the gangue minerals in a UG2 ore. It was decided that using data on mineral recovery by size fraction was not practical, in view of the cost and quantity of sample required for platinum group element (PGE) assaying. Only models with a limited number of parameters could be considered.
Methods
Sample
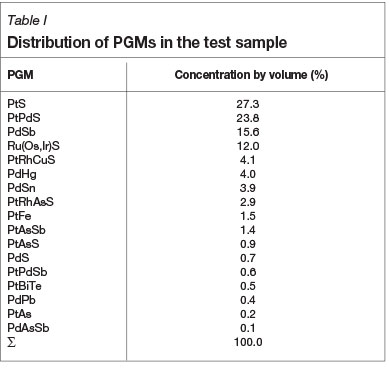
A UG2 ore from the eastern limb of the Bushveld Complex was used in this study. The sample had a Pt, Pd, plus Au (2PGE+Au) feed grade of 2.64 g/t. The chromite (FeO-Cr2O3) feed grade was 28.09%. The valuable minerals are the platinum group minerals (PGMs) and associated base metal sulphides. The gangue minerals are chromite and siliceous gangue. Siliceous gangue, which is referred to as 'gangue' in the text that follows, includes talc, which was depressed.
The PGEs consisted of a distribution of elements (Pt, Pd, Ru, Os, Rh, and Ir), which were present in various mineral types (PGMs).
Table I shows the distribution of 17 PGMs in the sample. The floatabilities of these minerals can vary, but a detailed mineralogical examination was not possible (or affordable) on the small test samples, particularly the flotation tail, which had a low PGE grade.
The recovery of 2PGE+Au was determined by a conventional fire assay method, which consisted of a fusion technique, using NiS as the collector, followed by acid digestion and determination by inductively coupled plasma mass spectrometry (ICP-OES). The recovery of Cr2O3 was determined using a digestion technique on the sample, followed by ICP-OES measurement.
Experimental
The sample was crushed in stages to -1.7 mm using a laboratory jaw and cone crusher. Intermediate screening was used to limit the generation of fines. The crushed material was homogenized and split into 1 kg lots for replicate grinding and flotation tests.
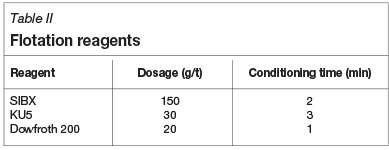
A laboratory rod mill, with stainless steel media, was used for wet grinding of the 1 kg lots to a target grind size of 80% passing 75 pm. The solids concentration during grinding was 50% (in tap water); additional water was added to transfer the pulp into a 2.5 l flotation cell. A Denver D-12 flotation mechanism was used for the flotation test, at a feed solids concentration of about 35%. Tap water was added to maintain the pulp level. Table II shows the chemical reagents, dosages, and conditioning times used. The pulp was conditioned first with collector SIBX; this was followed by a guar-based talc depressant, KU5; and then a frother, Dowfroth 200.
After conditioning, the flotation test was conducted using an air flow of 6.3 l/min. The froth built up naturally, allowing mineral separation to occur in the froth. The froth was removed every 15 seconds by hand scraping. The bottom edges of the scrapers were kept at a constant level of 0.5 cm above the froth/pulp interface. This is typical of most batch flotation test procedures that use hand scraping of the froth.
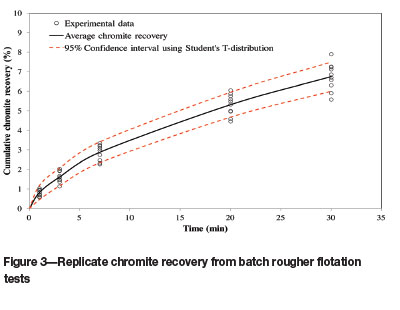
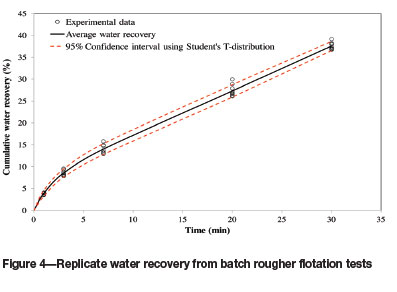
A total of five concentrates were collected, ending at the cumulative flotation times of 1, 3, 7, 20, and 30 minutes. The concentrates and flotation tail were weighed before filtration and again after drying. This made it possible to calculate the cumulative recovery of water in addition to the recovery of the minerals. The flotation tail and concentrates were assayed for 2PGE+Au and Cr2O3. The chromite content was calculated from the Cr2O3 assay, using a typical ratio of Cr2O3/FeO-Cr2O3 of 0.679. The gangue content was determined by difference.
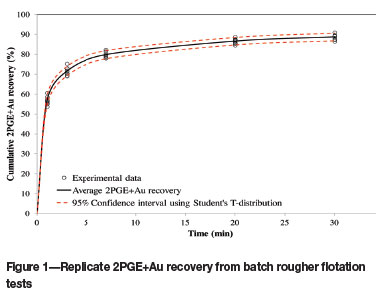
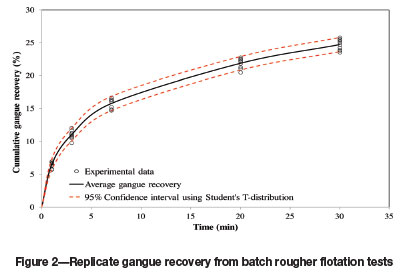
A total of ten replicate batch flotation rougher tests were done. Figures 1-4 show the cumulative recovery of 2PGE+Au, gangue, chromite, and water respectively. The 95% confidence interval was determined at each time point, and this envelope is shown as dotted lines. Most of the experimental data occurs within the 95% confidence interval, which demonstrates that total variance due to sub-sampling of the ore and experimental error was acceptable. Hence, the average of each data point provides an unbiased data-set that is suitable for evaluating flotation models.
It should be noted that it may not be practical to do replicate tests, and a single flotation test would often be used for each ore sample. This would provide a total of five data points per mineral and five water recovery points. The number of parameters used in a model should be less than the number of data points to have statistical significance. Therefore, for modelling mineral recovery without entrainment, the number of model parameters should not exceed four.
Batch flotation models
Table III presents the batch flotation models that were selected for this study. The basic assumption of all these models is that minerals are recovered by the mechanism of bubble-particle attachment. The second-order flotation models have not been used extensively, but were included for completeness.
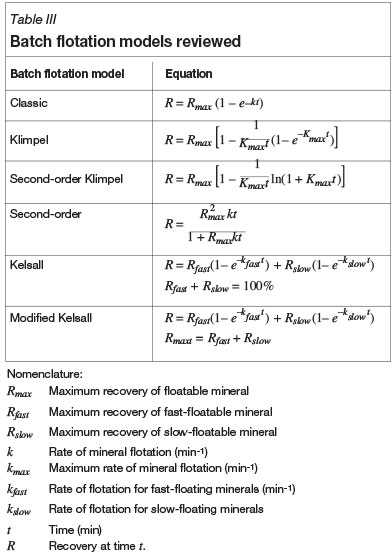
Entrainment is the unselective recovery of mineral particles associated with the water in the froth. Equation [1] has been applied when entrainment is included in modelling (Runge et al, 1998; George et al, 2004). The overall mineral recovery (R) is the sum of the recovery by flotation (Rfloat) and the recovery by entrainment (Rent). Water and suspended solids enter the froth in the wake of the air bubbles. Coarse particles are usually not present just below the froth due to sedimentation, and hence recovery by entrainment decreases as particle size increases. A simplified model is required for the complete range of particle size, to link entrainment to water recovery. The recovery by flotation can be modelled using any of the models listed in Table III.

Various models have been used to calculate the entrainment term. They are all based on the quantity of water recovered into the flotation concentrate samples. A simple empirical model, which has been used extensively, assumes that cumulative recovery of a mineral by entrainment is directly proportional to cumulative recovery of water. However, this model neglects the fact that the composition of the pulp changes during the test, particularly the amount of floatable mineral.
Runge (2010) has described a more accurate method to estimate entrainment, and this method was used to compare models. It takes into account the changing amounts of minerals in the cell as time progresses. In this paper, the authors used an average amount of a mineral remaining in the flotation cell for each time interval, this being the amount potentially available for entrainment during that time interval. Hence, knowing the average mineral-to-water ratio, the entrainment efficiency can be calculated, based on the water in the concentrate. This efficiency is called the classification factor for entrainment (Cf)twhich varies between zero and one. An average classification factor (for all time intervals) was calculated when fitting models that combine flotation and entrainment. The additional parameter (Cf) per mineral was required, but it should be noted that the number of data points was increased from 5 to 10.
Methods used for evaluating models
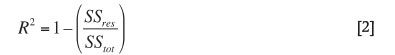
Statistical analysis was used to examine the goodness-of-fit. Two statistics were used: namely, the coefficient of determination (R2) and the model selection criterion (MSC). R2 is defined by Equation [2], and was used to measure the quality of a model fit. This statistic varies between zero and unity. A value of unity indicates a perfect model fit, and a value of zero indicates that the model does not offer a statistically meaningful interpretation of the data.
where p d
SSres =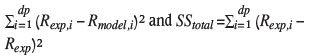
Rexpi is the experimental recovery of a mineral at time i Rmodel i is the mineral recovery obtained from the model at time i
Rexp is the average of the experimental mineral recovery
dp is the number of experimental data points.
There are a number of statistical tests that can be used for determining the best model from a list of candidate models. Some of the common statistics are the Akaike information criteria (AIC), Bayesian information criteria (BIC), Mallow's Cp, Spcriterion, and MSC (Kadane and Lazar, 2004; and Tu and Xu, 2012). These statistics are a function of SSres, and different penalties are assigned for the number of model parameters used. The MSC statistic (Equation [3]) was selected, since it penalizes models that have a large number of parameters relative to the number of data points available. This is important when there is a limited amount of data available. A large value for MSC is desirable.,
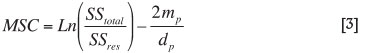
where
mp is the number of model parameters.
The above two statistics provide a numerical measure of the goodness-of-fit for a model, but this is not sufficient for evaluation of a model. The residuals must be examined to determine if the model describes the batch recovery of a mineral adequately. The residual is defined as the different between Rexp,iand Rmodelfi. A model that provides a good description of mineral recovery will have small and randomly distributed residuals. This indicates an impartial fit to all data points. Conversely, a model is not suitable if it has large residuals or the residuals follow a trend. This indicates a bias in the fit.
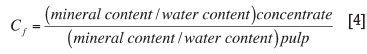
The test procedure outline by Warren (1985) for the determination of minerals recovered by flotation and entrainment requires several tests to be carried out under varying froth conditions. This procedure is difficult to implement when there is limited sample mass. Runge (2010) presented a simple method for estimating the value of Cf from batch flotation test data. The value of Cf defined in Equation [4] is determined for each time interval and plotted against cumulative time. It should be noted that mineral
recovery occurs by both flotation and entrainment, therefore the apparent value of Cfwill be too high initially, but it should approach the true value as the floatable material is depleted. The values obtained for the last time interval were compared to the 'best' regressed values.
Results and discussions
Modelling of PGM recovery data
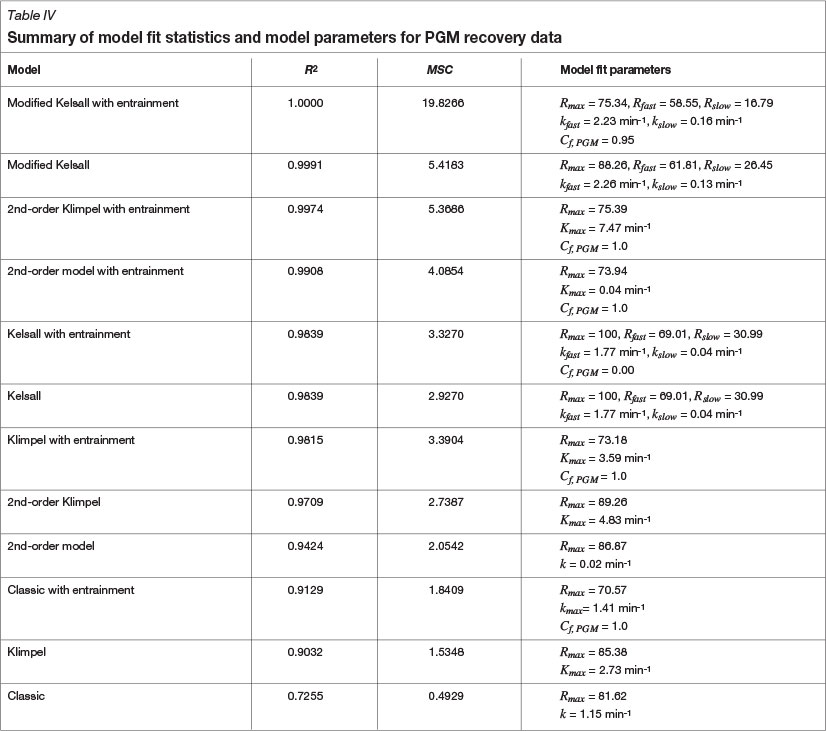
Table IV presents the statistical results and parameters obtained from model fitting to PGM recovery data. The results are arranged in descending order with the best model, according to R2, at the top and the worst at the bottom. It is apparent that the best model for the PGM recovery data is one that considers entrainment. According to the goodness-of-fit statistics (R2 and MSC), the modified Kelsall model with entrainment is the 'best' model. This model indicates that the floatable PGMs can be modelled as a fast- and slow-floating fraction together with entrainment.
The Kelsall model, which assumes that all minerals are floatable, reveals an interesting feature of model fitting, with and without entrainment. The entrainment model has a classification parameter of zero, which indicates that no PGMs are recovered by entrainment. Strictly speaking this is not true. Some PGMs are encapsulated in gangue minerals (unfloatable) and have been found in tailings samples, indicating that there should be an unfloatable fraction. It appears that the Kelsall model (without entrainment) provides a good fit to batch data, but logic says that it may not be adequate when extrapolated to steady-state plant data.
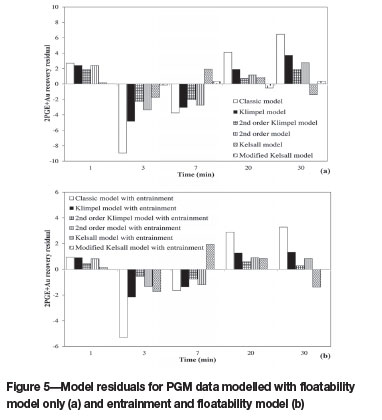
Figure 5 shows the residual plot for the models fitted to PGM recovery data. The residuals are smaller for models that took entrainment into account - note the change in scale for models with entrainment. The Classic, Klimpel, second-order Klimpel, and second-order models all show systematic structure in their residuals. This was observed for modelling with and without entrainment. The systematic structure is less noticeable when entrainment modelling is considered and the residuals are small. The residuals start positive and oscillate in a distinct pattern, particularly with the models that do not fit well. The modified Kelsall model and the Kelsall model both have small and randomly distributed residuals with and without entrainment modelling. These models give an impartial fit.
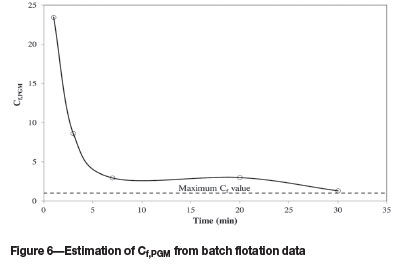
The goodness-of-fit statistics and the model residual plots indicate that the modified Kelsall model with entrainment is the 'best' model for modelling PGM recovery data. Figure 6 shows the application of Runge's method for estimation of Cf for the PGMs. The values are greater than unity, indicating that flotation was dominating throughout. This interpretation is confirmed by the fact that the grade of the final concentrate sample was 2.28 g/t (similar to the feed grade) and the tailings grade was 0.4 g/t. Clearly, the test would have to be continued for a much longer time to provide a realistic estimate of Cf. Hence, there is no evidence to reject the model regression value of Cf of 0.95 (refer to Table IV) for the modified Kelsall model.
Modelling of gangue recovery data
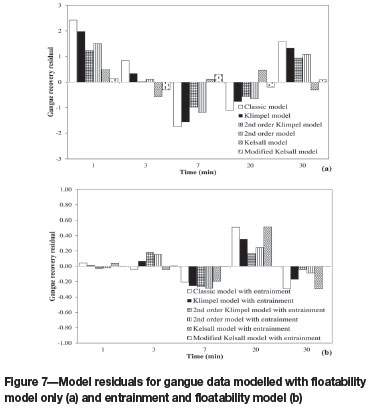
Table V shows the goodness-of-fit statistics for the different models fitted to the gangue recovery data. In general, all models provide a good fit to the experimental data as indicated by the large R2 values. The models with entrainment have a marginally better fit statistic in comparison to the models that do not have entrainment modelled. This is also evident from the residual plots for the models shown in Figure 7. The Classic, Klimpel, second-order Klimpel, and second-order models show structures in their residuals - this indicates bias.
The modified Kelsall model with entrainment gives the best fit to the experimental data, and is the best model from the candidate models evaluated, according to the MSC statistic. Furthermore, this model provides an impartial fit. Some of the gangue is present as floatable minerals, such as talc, chlorite, and other altered silicates. The rate of flotation of these minerals was depressed by the addition of KU5, but the model fit suggests the presence of fast- and slow-floating species, together with entrainment.
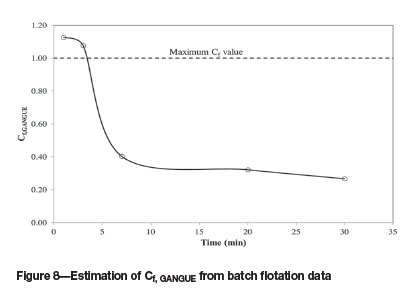
Figure 8 shows the estimation of Cf for gangue. According to the plot, Cf approaches a value of 0.22 towards the end of the flotation test. The modified Kelsall model has a Cf value of 0.19 from model fitting (refer to Table V). The lower value for the classification parameter (Cf, gangue = 0.19) is more typical of values reported by Runge (2010) for non-sulphide gangue.
Modelling of chromite recovery data
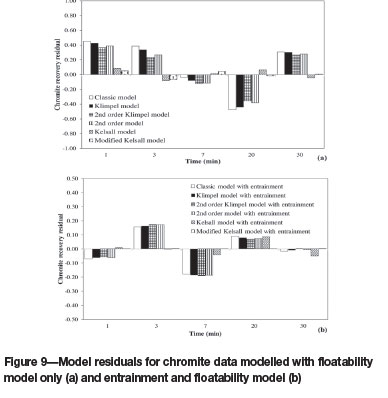
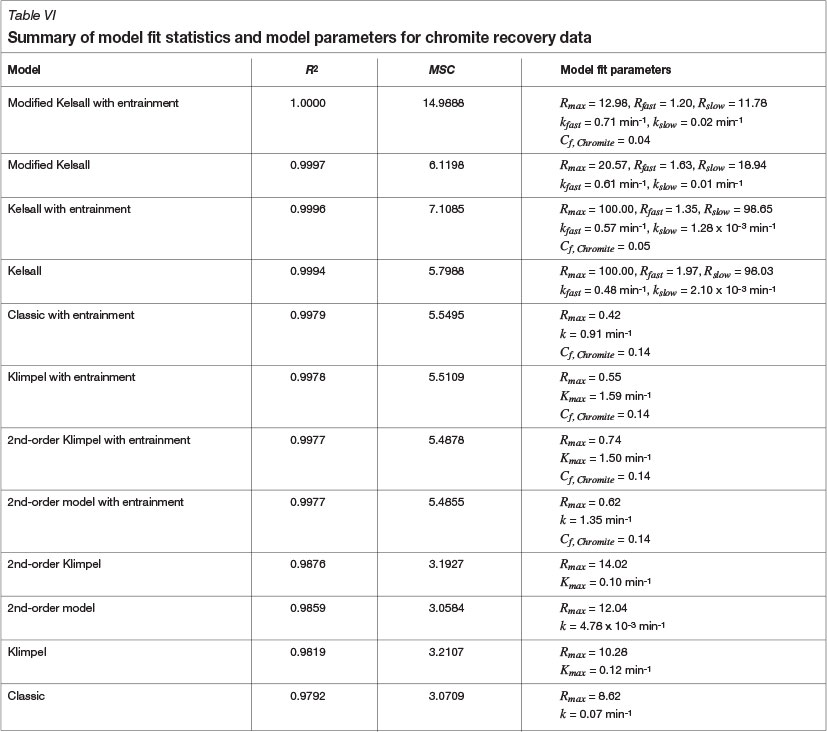
Table VI shows the goodness-of-fit statistics and model parameters for models fitted to the chromite data. All the models gave a good fit to the experimental data, but the models with entrainment modelling gave a better fit than those without entrainment modelling. The MSC statistic indicates that the modified Kelsall model with entrainment is the best model. Figure 9 shows the residual plots for the models. The models that did not consider entrainment have larger residuals with a systematic structure compared to models that considered entrainment. This was expected, as chromite is hydrophilic and recovered primarily by entrainment.
According to the goodness-of-fit statistics and the residual plot, the modified Kelsall model is the best model. However, this model has an estimated floatable chromite fraction of almost 13%. Chromite is a non-floatable mineral, and there is insufficient floatable material available to float this amount of chromite in the form of composite particles. The combination of the Classic flotation model and entrainment provides a much more realistic value for the proportion of floatable material = 0.42%).
Figure 10 shows the estimation of Cf using the Runge method. The value was still declining at the end of the test, yielding a final Cf value of 0.13. This compares well with the value obtained by regression, using the Classic model (Cf = 0.14).
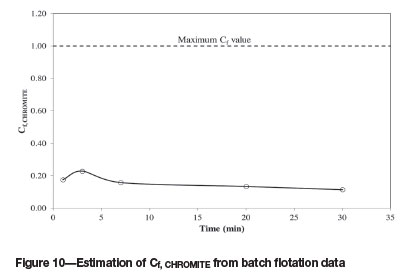
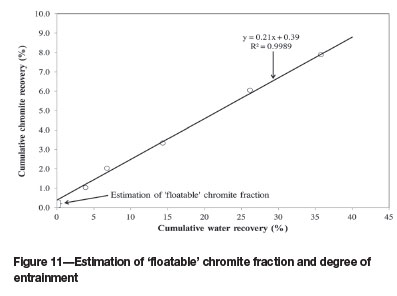
Figure 11 shows another way of analysing entrainment, namely a plot of chromite recovery versus water recovery. The linear relationship demonstrates that recovery is primarily by entrainment. However, it should be noted that the line does not pass through the origin, and therefore a small amount (0.39%) of 'floatable chromite' is present. The model parameters (Rmaxand Cf), in Table VI for the Classic model are comparable to the estimates obtained from Figure 10 and Figure 11.
Conclusions
> PGM recovery data is best modelled using the modified Kelsall model with entrainment. This model delineates the floatable recovery as the sum of a fast- and a slow-floating component. Entrainment modelling provides a better fit, and it differentiates between recovery of slow-floating PGMs and entrainment of PGMs contained in fine particles
> Gangue is best modelled using the modified Kelsall model with entrainment. Other models such as the second-order Klimpel model with entrainment, the second-order model with entrainment, and the Klimpel model with entrainment, offer good fits to experimental data, but the model-fitted parameters are not logical
> Chromite is recovered predominantly by entrainment, but model fitting suggests that a small fraction is recovered by flotation. This may be due to composite particles in which chromite is associated with floatable minerals. A single rate constant was adequate for characterizing the rapid recovery of a relatively small amount of chromite (0.39%) into the first concentrate. This could be due to composite particles, or entrapment in the initial mineral-rich froth
> The importance of entrainment, in combination with flotation, has been demonstrated. Consideration should be given to extending the time of the batch flotation test to provide better information on the recovery of non-floatable minerals, (including minerals trapped within non-floating minerals).
Acknowledgements
The first author would like to acknowledge the financial assistance provided by the Department of Minerals and Energy in South Africa, and the resources provided by Mintek for this study.
References
Fichera, M.A. and Chudacek, M.W. 1992. Batch cell flotation models-a review. Minerals Engineering, vol. 5. pp. 41-55. [ Links ]
George, P., Nguyen, A.V., and Jameson, G.J. 2004. Assessment of true flotation and entrainment in the flotation of submicron particles by fine bubbles. Minerals Engineering, vol. 17. pp. 847-853. [ Links ]
Kadane, J.B. and Lazar, N.A. 2004. Methods and criteria for model selection. Journal of the American statistical Association, vol. 99. pp. 279-290. [ Links ]
Runge, K.C., Alexander, D.J., Franzidis, J.P., Morrison, R.D., and Manlapig, E.V. 1998. JKSimFloat - a tool for flotation modelling. Proceedings of the AusIMM Annual Conference, Mt Isa, 19-23 April 1998. Australasian Institute of Mining and Metallurgy, Melbourne. pp. 361-370. [ Links ]
Runge, K. 2010. Laboratory flotation testing - n Essential Tool for Ore Characterisation. Flotation Plant Optimisation - A Metallurgical Guide to Identifying and Solving Problems in Flotation Plants. Greet, C.J. (ed.). AUSIMM Spectrum Series.16. Australasian Institute of Mining and Metallurgy, Melbourne. pp. 155-173. [ Links ]
Tu, S. and Xu, L. 2012. A theoretical investigation of several model selection criteria for dimensionality reduction. Pattern Recognition Letters, vol. 33. pp. 1117-1126. [ Links ]
Warren, L.J. 1985. Determination of the contributions of the true flotation and entrainment in batch flotation tests. International Journal of Mineral Processing, vol. 14. pp. 33-44. [ Links ]
Paper received Dec. 2013
Revised paper received Sep. 2014

