


Serviços Personalizados
Artigo
 Inglês (pdf)
 Artigo em XML
 Referências do artigo
Indicadores

Links relacionados
-
 Citado por Google
 -
 Similares em Google
Compartilhar

 Permalink
Journal of the Southern African Institute of Mining and Metallurgy
versão On-line ISSN 2411-9717
versão impressa ISSN 2225-6253
J. S. Afr. Inst. Min. Metall. vol.115 no.3 Johannesburg Mar. 2015
GENERAL PAPERS
Utilization of the Brazilian test for estimating the uniaxial compressive strength and shear strength parameters
K. KaramanI; F. CihangirI; B. ErcikdiI; A. KesimalI; S. DemirelII
IDepartment of Mining Engineering, Karadeniz Technical University, Turkey
IINVS Construction Industry and Trade Limited Company
SYNOPSIS
Uniaxial compressive strength (UCS) and shear strength parameters (cohesion and angle of internal friction, C and ϕ) of rocks are important parameters needed for various engineering projects such as tunnelling and slope stability. However, direct determination of these parameters is difficult and requires high-quality core samples for tests. Therefore, this study aimed to explore the applicability of the Brazilian test (BT) - a simple, less sophisticated and inexpensive method for both specimen preparation and testing - to estimate the UCS and shear strength parameters of rocks. Thirty-seven rock types were sampled and tested, 24 of which were volcanic, 8 were metamorphic, and 5 were sedimentary. Statistical equations were derived to estimate the UCS and shear strength parameters of rocks using the BT. The validity of the statistically derived equations was confirmed using predictive analytics software (PASW Statistics 18). A strong linear relation was found between BT and UCS values. BT and UCS values exhibited prominent linear correlations with the cohesion values of rocks. The Mohr envelope was also used to determine the cohesion and friction angle of rocks using BT and UCS values. It is deduced from the current study that the BT values can be used to estimate the UCS and cohesion. However, no relation was observed between the angle of internal friction values and the UCS and BT for all rock types. Therefore, different approaches are suggested for the estimation of the internal angle of friction for application in the preliminary design of projects.
Keywords: Brazilian test, shear strength parameters, triaxial compressive strength, uniaxial compressive strength, Mohr-Coulomb criterion
Introduction
The mechanical and shear strength parameters (UCS, C, ϕ, etc.) of rocks are considered to be among the most significant properties in mining, civil, and engineering geology projects (Singh et al., 2011). The UCS is most commonly determined in accordance with the suggested methods of the International Society for Rock Mechanics (ISRM, 2007). UCS is also considered for a variety of issues encountered during blasting, excavation, and support systems in engineering applications (Hoek, 1977). Shear strength parameters (C and ϕ) are used to express the strength of rock materials and the resistance to deformation under shear stress. These parameters are affected by many factors such as lithological character, anisotropy, and environment of the rock materials (Yang et al., 2011). Shear strength parameters of rock materials can be quantified by means of direct shear tests and triaxial compression tests as prescribed the American Society for Testing and Materials (ASTM, 2004) and ISRM (2007), respectively. The latter test is widely used and accepted in most mining practices.
However, UCS and triaxial compression tests are expensive and time-consuming. In addition, the preparation of rock core samples for testing, placing the samples in a confining pressure cell (Hoek cell), and operating the confining pressure for triaxial testing requires considerable time and attention (Kahraman and Alber, 2008; Kilic and Teymen, 2008). Furthermore, weak, thinly bedded, or densely fractured rocks are not suitable for specimen preparation and the determination of UCS. Triaxial testing is also difficult for such rock types. Therefore, some alternative test methods such as point load index, Schmidt hammer, and ultrasonic pulse velocity tests are commonly used to estimate the UCS, C, and ϕ of rocks owing to their rapidity, simplicity, low cost, and ease of both specimen preparation and testing (Kahraman, 2001; Karaman and Kesimal, 2015).
Although the aforementioned tests are known to be extensively used for estimation of rock strength (Kahraman, 2001; Kilic and Teymen, 2008; Bruno et al., 2012), there are few studies on the utilization of the Brazilian test (BT) for the estimation of UCS, C, and ϕ of intact rocks (Beyhan, 2008; Farah, 2011). The BT is one of the most popular and common tests to obtain the tensile strength of brittle materials such as concrete, rock, and rock-like materials (Li et al., 2013). It owes its popularity to the ease of specimen preparation, which does not require particular care and expensive techniques, compared to the direct tension test (Mellor and Hawkes, 1971; Hudson et al., 1972; Bieniawski and Hawkes, 1978; Coviello et al., 2005). The BT has also been suggested by many researchers for investigating the effect of anisotropy on the strength of coal (Evans, 1961), siltstone, sandstone, and mudstone (Hobbs, 1964), and gneiss and schist (Barla, 1974). Farah (2011) correlated the UCS of 145 weathered Ocala limestone samples with their point load strength and BT values. He stated that the BT is a useful method for prediction of UCS compared to the point load test. Kahraman et al., (2012) found a reasonable linear correlation between UCS and BT results. Many researchers have correlated BT results with indirect tests (P-wave velocity, block punch test, point load index, Schmidt hammer test etc) to estimate indirect tensile strength of rocks (Kilic and Teymen, 2008; Mishra and Basu, 2012). Yang et al. (2011) conducted an experimental investigation on the mechanical behaviour of coarse marble, under different loading conditions, using the linear Mohr-Coulomb criterion to confirm the strength parameters (cohesion, C and internal friction angle, ϕ). However, as mentioned above, limited studies were performed to estimate C and ϕ using the BT and its confirmation with the Mohr-Coulomb criterion, which is widely accepted and used in the literature.
The purpose of the present study is to correlate C, ϕ, and UCS of rock samples with BT values; to develop empirical equations for UCS, C and ϕ using the BT; and to confirm the predicted UCS and C with measured UCS and C values obtained from direct methods i.e. the Mohr-Coulomb criterion or triaxial compressive test.
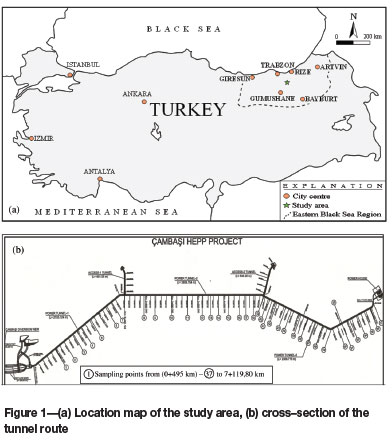
Site description and geology
The study area is located in eastern Black Sea Region (Figure 1), which has an abundance of sites suitable for small hydroelectric power plants. A total of 213 hydroelectric power plant (HEPP) projects incorporating tunnels have been planned or constructed in the region (Karaman et al., 2014). The study area is in the northeast part of the Eastern Pontides Tectonic Belt (Ketin, 1966). The geological formations along the tunnel route consist of volcanic, metamorphic, and sedimentary rocks. The lithology of the tunnel route consists mainly of basalt, metabasalt, limestone, dacite, and volcanic breccia. The lowest and the uppermost lithologies belong to the Jurassic (Hamurkesen Formation) and Quaternary (alluvium), respectively. The Hamurkesen Formation is composed mainly of basalt, metabasalt, and rarely seen maroon limestone with a thickness of 3 to 5 m. This formation comprises about 70% of the tunnel length (7132 m). The Hamurkesen Formation is overlain primarily by the Berdiga Formation, which is Upper Jurassic to Lower Cretaceous in age and consists mainly of grey to white medium to thickly bedded clayish or sandy limestone.
Experimental procedure
The rock samples used in the study were collected from various locations throughout the Qambasi tunnel, 24 of which were volcanic, 8 were metamorphic, and 5 were sedimentary. UCS, triaxial compressive strength tests, and BTs were conducted on core samples (NX size, 54.7 mm) according to ISRM (2007) suggested methods. Each block sample was inspected for macroscopic defects to provide test specimens free from fractures, cracks, partings, or alteration zones. One of the important parameters affecting the strength of rocks is anisotropy. However, the volcanic rocks show no prismatic, pillow lava, and/ or flow structures. Additionally, the metamorphic rocks (metabasalts) contain no features such as schistosity or foliation that could lead to anisotropy.
In order to obtain accurate results for best comparison, the experiments were carried out under the same (natural and unweathered) rock conditions. Laboratory core drill and sawing machines were used to prepare cylindrical specimens. The cut end faces of the cores were smoothened to maintain precision within 0.02 mm and made perpendicular to within 0.05 mm to the core axis using a comparator.
Uniaxial compressive strength
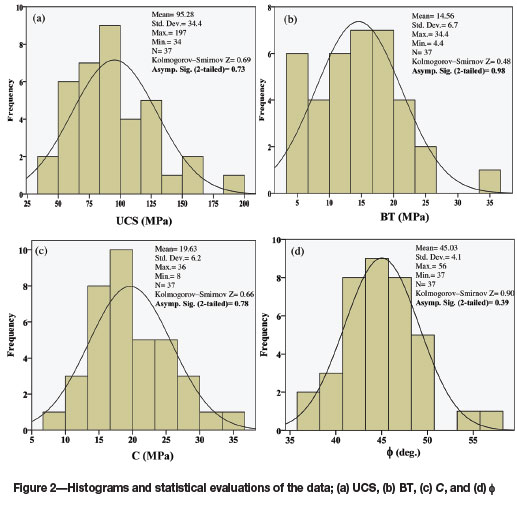
The UCS tests were carried out on fresh rock samples with a length-to-diameter ratio of 2.5. The tests were performed using a servo-controlled testing machine with a load capacity of 300 t, using a stress rate of 0.75 MPa/s. Mean UCS values (Table I) were obtained by averaging the strength values of five core samples for each rock type.
Brazilian test
A total of 370 core samples with a diameter of 54.7 mm and height of 27 mm were prepared using the sawing machine. In the test, a circular disk was placed between two platens and compression was applied to produce a nearly uniform tensile stress distribution normal to the loaded diametric plane, leading to the failure of the disk by splitting (Rocco et al., 1999). A loading rate of 200 N/s was applied until sample failure. A servo-controlled testing system connected to a 30 t capacity press was used for the BT tests in order to obtain accurate measurements.
Triaxial compressive strength
After the preparation of the cores, the triaxial compression tests for each rock sample were carried out using a servo-controlled testing machine with a servo-lateral pressure unit having a load capacity of 30 MPa. The confining fluid pressure around the cylindrical specimen was kept constant while the axial compressive load was raised until failure occurred. A Hoek cell unit with a diameter of 54 mm and height of 108 mm was used to apply the required confining fluid pressure. Six samples were used for triaxial compressive strength under three different lateral confining pressures; 5-15 MPa for each rock type. Shear envelopes of the rock samples were then drawn to obtain shear strength parameters (C and ϕ) by plotting the Mohr circles. A total of 222 core samples were subjected to triaxial compression testing.
Data analysis
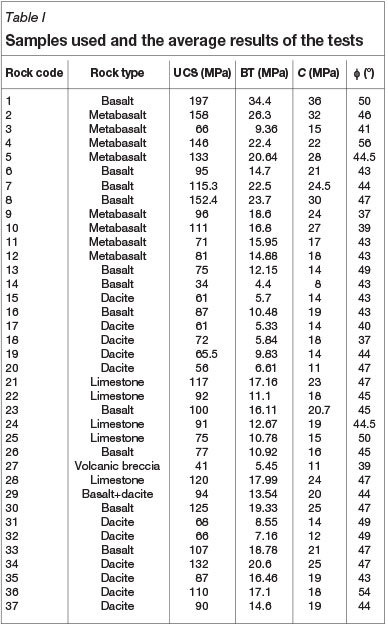
The BT (σt), UCS (σc), C, and ϕ values of the rocks showed normal distributions (Figure 2), and were subjected to parametric statistical tests. The data-sets were used for linear and nonlinear regression analysis. Exponential and logarithmic relationships were examined between the variables in order to derive the most reliable equations. Correlation analysis was performed to investigate the reliability of the predicted C values from regression analyses. One-way analysis of variance (ANOVA) was also performed to investigate the relationships and the mean differences between measured and predicted C values. Zero-intercept equations were not used for the estimation of C, since the best relationship between the cohesion and the UCS, and the BT, was linear.
Results and discussion
Strength properties of intact rocks
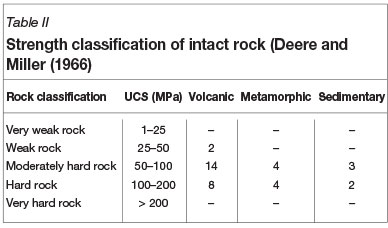
From the average results for the samples, which are summarized in Table I, the UCS values of the tested rocks were classified according to the strength classification of intact rock by Deere and Miller (1966) (Table II). Volcanic, metamorphic, and sedimentary rocks were individually evaluated according to the UCS classification. As shown in Table II, 56.8% of the rocks were classified as 'moderately hard rock' and 37.8% as 'hard rock'. A 'weak rock' classification was obtained only for volcanic rocks at two points along the tunnel route.
Evaluation of strength ratio
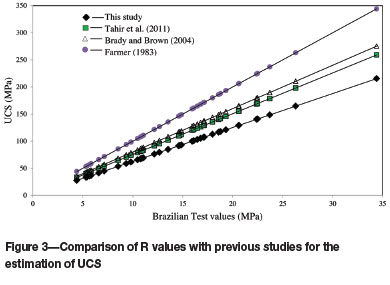
The literature contains some practical approaches for correlation between the UCS and tensile strength/BT (Farmer, 1983; Sheorey, 1997; Ramamurthy, 2001). Cai (2010) pointed out that when tensile strength data is not available, the general approach for predicting the tensile strength of rocks is to use correlation between UCS and tensile strength values (strength ratio, R). In addition, most rocks have a compressive strength value that is approximately 10 times greater than the tensile strength/BT (σc≈ 10σt)(Kahraman et al., 2012; Farmer, 1983; Sheorey, 1997). Values given in the literature for strength ratios (R = σc/ σt)show a large variation - from 2.7 to 39 with an average of 14.7 (Sheorey, 1997); from 10 to 50 for most rocks (Vutukuri et al. 1974); and from 4 to 25 for intact rocks and between 8 and 12 for more homogeneous and isotropic rocks (Ramamurthy, 2001). This variation in R depends on the type and origin of rocks (Brook, 1993; Cai, 2010). In the present study, R was determined as 6.26 for all rock type by means of the zero-intercept equation, with a determination coefficient of 0.81. As regards the geological classification of the rock types, R values were 6.27, 5.97, and 7.02 for volcanic, metamorphic and sedimentary rocks respectively, within a determination coefficient of 81-84. The R values were distributed in a narrower range than those found in the literature. This could be attributed to the freshness of the rock samples collected along the tunnel route. R values obtained from the zero-intercept equation were consistent with those of Brady and Brown (2004) (σc =8σt) and Tahir et al. (2011) (σc = 7.53σt) for the prediction of UCS (Figure 3).
Relationship between BT and UCS
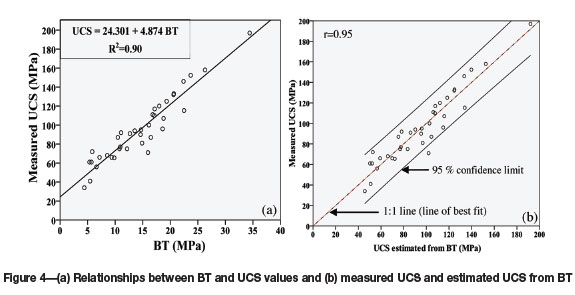
The BT values of the rocks were subjected to regression analysis with UCS data (Figure 4a). A strong positive linear relationship was obtained between the measured BT and UCS values, with a high determination coefficient of R2= 0.90 (Table III), which agrees well with Nazir et al. (2013). The correlation between the measured and estimated UCS for the studied rocks is significant (significance level=0.000) at the confidence interval of 95% (r = 0. 95) (Figure 4b). Considering these results, the BT can substitute for the UCS when problematic ground conditions (thinly bedded, block-in-matrix, pyroclastic rocks, and highly fractured rocks) are encountered.
Relationships between Brazilian test and shear strength parameters
Regression analysis was performed for the estimation of C values from UCS and the BT (Figures 5a, 5b and Table III). The strongest relationship was obtained between C and UCS values from laboratory tests with a determination coefficient value of R2= 0.90 (Figure 5a). A very strong linear relationship between C and the BT was also found (R2 = 0.85) (Figure 5b). It can be inferred from the results that UCS and the BT can be used to obtain reliable C values.
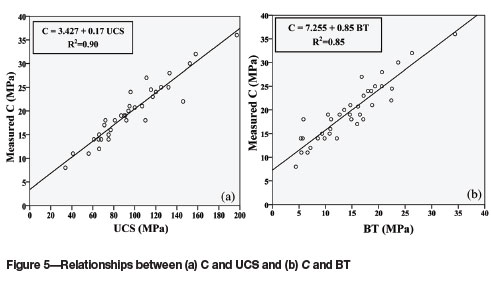
Zoback (2007) stated that all rocks have relatively high values of internal friction, whereas hard rocks (high compressive strength) have high C values and weak rocks low C values. Kahraman and Alber (2008) reported that C decreases while ϕ increases with an increase in specimen diameter size (height-to-diameter ratio of 2-2.5:1) for fault breccias in weak rocks. In the current study, C values were seen to increase with an increase in UCS, which is consistent with the literature.
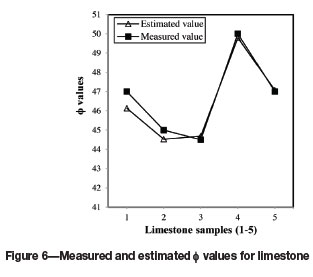
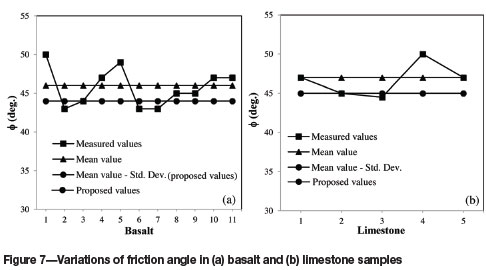
In the current study, the relationships obtained between ϕ-BT and ϕ-UCS data pairs were very weak, with coefficients of determination of R2=0.14 and R2=0.18, respectively. Beyhan (2008) correlated ϕ values with the BT and UCS for marl rocks from the Tuncbilek and Soma regions in Turkey. The determination coefficients were 0.09 and 0.06 for ϕ-BT for the rocks from the Tuncbilek and Soma regions, respectively. On the other hand, Beyhan (2008) found R2values of 0.03 and 0.18 for rocks from the Tuncbilek and Soma regions respectively for ϕ-UCS data pairs. Considering the R2 values obtained from the present study (for all rock types) and the literature, these correlations are not reliable enough for the estimation of ϕ from BT and UCS values. Therefore, regression analyses were performed for each rock type (i.e. basalt, metabasalt, dacite, limestone) instead of all types of rocks (Table IV). As shown in Table IV, there is a very strong polynomial relationship between ϕ and UCS (R2=0.96) for limestone samples. Measured and estimated ϕ values of limestone are given in Figure 6. Moderate relationships (R2=0.40-0.41) were also found between ϕ-BT data pairs for basalt and limestone, and between ϕ-UCS (R2=0.47) for metabasalt. In addition to the regression analyses, ϕ values were evaluated according to variations of data for each rock type (Figures 7a, 7b, and Table IV). Minimum and maximum ϕ, and mean values with standard deviations, are given in Table IV. As can be seen from Figures 7a, 7b, and Table IV, suggested ϕ values (mean value-std. dev.) may be used with care for the initial stage of projects since they should result in a conservative design.
Comparison of measured and estimated C values
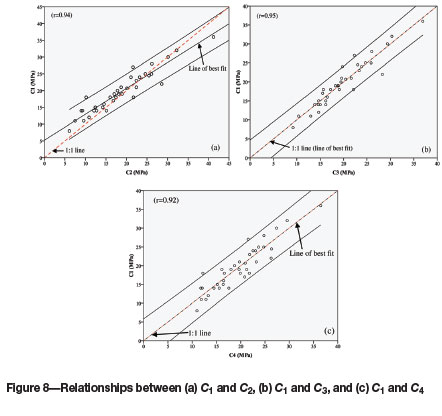
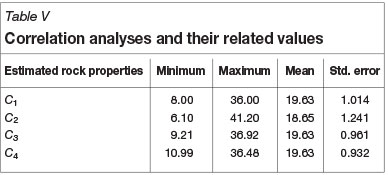
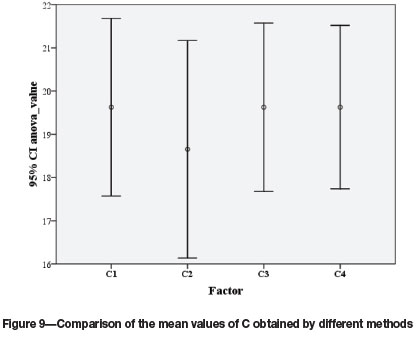
In the current study, C values of rocks were obtained by triaxial tests (measured C (C1)). Another C value was found by means of the linear Mohr envelope of UCS and BT data together (C2). Additionally, C3 and C4 values were obtained by the regression analyses shown in Figure 5, the equations for which are given in Table III. The correlation plots of C2, C3, and C4values against C1values are depicted in Figures 8a-c. As can be seen, very high correlations were obtained between the C1-C2, C1-C3, and C1-C4 data pairs for the tested rocks within 95% confidence level (r > 0.90). The variations of these couples were also tested using ANOVA. The variances of C1, C2, C3, and C4 were homogeneous (Levene Statistic=0.879 and significance level=0.454). According to the ANOVA test results, no difference was obtained among the mean values of the groups (F=0.213 and significance level=0.884). The Dunnett two-sided T-test was used for comparison of multiple tests to investigate the relationships between C1, C2, C3, and C4, where C1 was considered as the control group. The mean values of C3and C4were very close to the C1 values with lowest variation (Table V and Figure 9). The minimum mean difference was obtained between C1and C4according to the multiple tests comparison by ANOVA.
Therefore, one can infer from these findings that cohesion of rock materials can be reliably estimated from the BT, taking into account the correlation and ANOVA analyses.
Conclusion
Determination of the UCS and shear strength parameters of rocks (C and ϕ) requires high-quality core samples. It is sometimes troublesome to determine these parameters using direct test methods on core samples obtained from problematic ground conditions such as thinly bedded, block-in-matrix, and highly fractured or pyroclastic rocks. The aim of this study was to overcome these problems and to propose useful equations for the estimation of UCS and shear strength parameters based on the BT method.
The regression, correlation, and one-way variance analyses of the data showed that the estimation of UCS and C by the BT is robust and reliable. Determination coefficients (R2) of 0.90 and 0.85 were obtained from the regression analyses between UCS-BT and C-BT, respectively. High correlation coefficients (r>0.90) were also achieved between measured and estimated data (UCS and C). Low determination coefficients of 0.14 and 0.18 for BT-ϕ and UCS-ϕ data pairs suggested that the BT and UCS were not reliable for the prediction of ϕ when all rock types were evaluated together. However, a relatively higher determination coefficient for a particular set of data e.g. data collected from the same rock type (basalt, metabasalt, dacite, limestone) was obtained for the estimation of ϕ. ANOVA indicated that there is no difference in C values acquired by different test methods (F=0.213 and significance level=0.884). These findings suggest that the BT, as a low-cost, less time-consuming, and practical method, can be reliably used to determine the UCS and C of rocks in problematic ground conditions.
Acknowledgements
The authors would like to express their sincere thanks and appreciation to Energy-SA Company for providing help during the study, and to Karadeniz Technical University (KTU) for funding this work through research project no. 9706.
References
American Society for Testing and Materials (ASTM). 2004. Standard test method for triaxial compressive strength of undrained rock core specimens without pore pressure measurements. D2664. [ Links ]
Barla, G. 1974. Rock anisotropy: theory and laboratory testing, Rock Mechanics. Muller, L. (ed.). Springer-Verlag, New York. pp. 132-169. [ Links ]
Beyhan, S. 2008. The determination of G.L.I and E.L.I marl rock material properties depending on triaxial compressive strength. PhD thesis, Osman Gazi University. p. 224. [ Links ]
Bieniawski, Z.T. and Hawkes, I. 1978. Suggested methods for determining tensile strength of rock materials. International Journal of Rock Mechanics and Mining Sciences and Geomechanical Abstracts, vol. 15. pp. 99-103. [ Links ]
Brady, B.H.G. and Brown, E.T. 2004. Rock Mechanics for Underground Mining. Kluwer Academic Publishers, New York. p. 645. [ Links ]
Brook, N. 1993. The measurement and estimation of basic rock strength. Comprehensive Rock Engineering. Hudson, J. (ed.). Pergamon Press, Oxford. vol. 3. pp 41-66. [ Links ]
Bruno, G., Vessia, G., and Bobbo, L. 2012. Statistical method for assessing the uniaxial compressive strength of carbonate rock by Schmidt hammer tests performed on core samples. Rock Mechanics and Rock Engineering. DOI 10.1007/s00603-012-0230-5 [ Links ]
Cai, M. 2010. Practical estimates of tensile strength and Hoek-Brown strength parameter mi of brittle rocks. Rock Mechanics and Rock Engineering, vol. 43. pp. 167-184. [ Links ]
Coviello, A., Lagioia, R., and Nova, R. 2005. On the measurement of the tensile strength of soft rocks. Rock Mechanics and Rock Engineering, vol. 38, no. 4. pp. 251-273. [ Links ]
Deere, D.U. and Miller, R.P. 1966. Engineering classifications and index properties for intact rock. Technical Report no. AFWL-TR 65-116, Air Force Weapons Laboratory, Kirtland Air Force Base, New Mexico. [ Links ]
Evans, I. 1961. The tensile strength of coal. Colliery Engineering, vol. 38. pp. 428-34. [ Links ]
FARAH, R. 2011. Correlations between index properties and unconfined compressive strength of weathered Ocala Limestone. MSc thesis, University of North Florida School of Engineering. p. 83. [ Links ]
Farmer, I.W. 1983. Engineering Behavior of Rocks. Chapman and Hall, London. [ Links ]
Hobbs, D.W. 1964. The strength and the stress-strain characteristics of coal in triaxial compression. Journal of Geology, vol. 72. pp. 214-231. [ Links ]
Hoek, E. 1977. Rock mechanics laboratory testing in the context of a consulting engineering organization. International Journal of Rock Mechanics and Mining Sciences and Geomechanical Abstracts, vol. 14. pp. 93-101. [ Links ]
Hudson, J.A., Rummel, F., and Brown, E.T. 1972. The controlled failure of rock disks and rings loaded in diametral compression: International Journal of Rock Mechanics and Mining Sciences and Geomechanical Abstracts, vol. 9. pp. 241-248. [ Links ]
International Society Of Rock Mechanics (ISRM). 2007. The complete ISRM suggested methods for rock characterization, testing and monitoring: 1974-2006. Suggested Methods prepared by the Commission on Testing Methods, International Society for Rock Mechanics. Ulusay, R. and Hudson, J.A. (eds.) ISRM Turkish National Group, Ankara, Turkey. 628 pp. [ Links ]
Kahraman, S. 2001. Evaluation of simple methods for assessing the uniaxial compressive strength of rock. International Journal of Rock Mechanics and Mining Sciences and Geomechanical Abstracts, vol. 38, pp. 991-994. [ Links ]
Kahraman, S. and Alber, M. 2008. Triaxial strength of a fault breccia of weak rocks in a strong matrix. Bulletin of Engineering Geology and the Environment, vol. 67. pp. 435-441. [ Links ]
Kahraman, S., Fener, M., and Kozman, E. 2012. Predicting the compressive and tensile strength of rocks from indentation hardness index. Journal of the Southern African Institute of Mining and Metallurgy, vol. 112. pp. 331-339. [ Links ]
Karaman, K. and Kesimal, A. 2015. Evaluation of the influence of porosity on the engineering properties of rocks from the Eastern Black Sea Region: NE Turkey. Arabian Journal of Geosciences, vol 8. pp. 557-564. [ Links ]
Karaman, K., Kesimal, A., and Ersoy, H. 2014. A comparative assessment of indirect methods for estimating the uniaxial compressive and tensile strength of rocks. Arabian Journal of Geosciences. DOI 10.1007/s12517-014-1384-0 [ Links ]
Ketin, L.1966. Tectonic units of Anatolia. Bulletin of the Mineral Research and Exploration Institute of Turkey, vol. 66. pp. 22-34. [ Links ]
Kilic, A. and Teymen, A. 2008. Determination of mechanical properties of rocks using simple methods. Bulletin of Engineering Geology and the Environment, vol. 67. pp 237-244. [ Links ]
Li, D., Ngai, L., and Wong, Y. 2013. The Brazilian Disc test for rock mechanics applications: review and new insights. Rock Mechanics and Rock Engineering, vol. 46. pp. 269-287. [ Links ]
Mellor, M. and Hawkes, I. 1971. Measurement of tensile strength by diametral compression of discs and annuli. Engineering Geology, vol. 5. pp. 173-225. [ Links ]
Mishra, D.A. and Basu, A. 2012. Use of the block punch test to predict the compressive and tensile strengths of rocks. International Journal of Rock Mechanics and Mining Sciences and Geomechanical Abstracts, vol, 51. pp. 119-127. [ Links ]
Nazir, R., Momeni, E., Armaghani, D.J., and Mohdamin, M.F. 2013. Correlation between unconfined compressive strength and indirect tensile strength of limestone rock samples. Electronic Journal of Geotechnical Engineering, vol. 18, no. 1. pp. 1737-1746. [ Links ]
Ramamurthy, T. 2001.Shear strength response of some geological materials in triaxial compression. International Journal of Rock Mechanics and Mining Sciences and Geomechanical Abstracts, vol. 38. pp. 683-697. [ Links ]
Rocco, C., Guinea, G.V., Planas, J., and Elices, M. 1999. Mechanism of rupture in splitting tests. ACI Materials Journal, vol. 96. pp. 52-60. [ Links ]
Sheorey, P.R. 1997. Empirical Rock Failure Criteria. A.A. Balkema, Rotterdam. p 176. [ Links ]
Singh, M., Raj, A., and Singh, B. 2011. Modified Mohr-Coulomb criterion for non-linear triaxial and polyaxial strength of intact rocks. International Journal of Rock Mechanics and Mining Sciences and Geomechanical Abstracts, vol. 48. pp. 546-555. [ Links ]
Tahir, M., Mohammad, N., and Din, F. 2011. Strength parameters and their inter-relationship for limestone of Cherat and Kohat areas of Khyber Pakhtunkhwa. Journal of Himalayan Earth Sciences, vol. 44, no. 2. pp. 45-51. [ Links ]
Vutukuri, V.S., Lama, R.D., and Saluja, S.S. 1974. Handbook on Mechanical Properties of Rocks. Vol. I-Testing Techniques and Results. Trans Tech Publications. p. 280. [ Links ]
Yang, S.Q., Jing, H.W., Li, Y.S., and Han, L.J. 2011. Experimental investigation on mechanical behavior of coarse marble under six different loading paths. Experimental Mechanics, vol. 51. pp. 315-334. [ Links ]
Zoback, M.D. 2007. Reservoir Geomechanics: Earth Stress and Rock Mechanics applied to Exploration, Production and Wellbore Stability. Cambridge Press. p. 449. [ Links ]
Paper received Apr. 2014
Revised paper received Jul. 2014.

