


Services on Demand
Article
 English (pdf)
 Article in xml format
 Article references
Indicators

Related links
-
 Cited by Google
 -
 Similars in Google
Share

 Permalink
Journal of the Southern African Institute of Mining and Metallurgy
On-line version ISSN 2411-9717
Print version ISSN 2225-6253
J. S. Afr. Inst. Min. Metall. vol.115 n.3 Johannesburg Mar. 2015
INAUGURAL AFRICAN CORRISION CONGRESS
Comparison of linear polarization resistance corrosion monitoring probe readings and immersion test results for typical cooling water conditions
J.W. van der MerweI, II; A. PalazzoI, II, III
ISchool of Chemical and Metallurgical Engineering, University of the Witwatersrand, Johannesburg, South Africa
IIDST/NRF Centre of Excellence for Strong Materials, University of the Witwatersrand, Johannesburg, South Africa
IIIBuckman Africa (Pty) Ltd, Hammarsdale, South Africa
SYNOPSIS
Owing to the corrosiveness of the untreated brackish cooling water typically used for steel mills (and other environments), it is important to treat the water and monitor corrosion in such systems. Generally, corrosion rates are monitored with corrosion probes inserted into a pipeline or vessel. This has been standard practice for many years, and is widely accepted in industry. Typically, two kinds of probes are used - electrical resistance and linear polarization resistance (LPR) probes.
In this study, the effectiveness and accuracy of the LPR technique was evaluated by comparing the electrochemical measurements with the results of mass loss tests using corrosion coupons. The corrosivity of the environment, a synthetic brackish water, was varied by varying the calcium hardness and alkalinity, and to simulate actual plant conditions temperatures of 35°C and 45°C were used. In addition to the corrosion rate measurements, the iron concentration was measured, as well as the imbalance from the probe.
The corrosion rates obtained by LPR were from 57% lower to 385% higher than those from the immersion tests. Most probe measurements were higher than the immersion results, and 50% of the probe results were 50% or more higher than the immersion results. The best correspondence between the two methods was obtained at low calcium levels, except for one measurement that was 93% higher than the coupon results. There was no clear correlation between parameters such as temperature and total alkalinity and the difference between the results. It would therefore appear that LPR measurements can differ significantly from immersion results, and LPR results should therefore be used with caution in industrial applications.
Keywords: linear polarization resistance, probe, corrosion rate, corrosion monitoring, cooling water.
Introduction
The corrosion rates in the cooling water systems of steel mills can be significant, and should be carefully monitored and controlled by appropriate water treatment. Corrosion monitoring is a crucial tool in the water treatment programme. Industrial plants pursue zero effluent discharge (ZED) policies and reduce fresh water intake as well as limit the volume of water returned to the environment. The water quality in the plant therefore deteriorates, and such brackish cooling water can lead to increased corrosion and fouling of the carbon steel equipment. Since these brackish cooling waters are sufficiently conductive, corrosion rates can be monitored on a realtime basis with linear polarization resistance (LPR) probes, which provide almost instantaneous results. The ease of making these measurements is very convenient and this corrosion monitoring technique is still widely used in a number of industries (Jaske et al., 2002). However, a number of studies have indicated that the LPR technique does not give very reliable results (Stern et al., 1957; Mansfeld, 1973; Walter, 1977; Jarragh et al., 2014; Wu et al., 2015), but since monitoring is generally not performed by corrosion experts the results are often incorrectly assumed to reflect the actual corrosion rates. In this study, the accuracy and variability of LPR corrosion probe measurements is investigated with the aim of making it possible to predict the actual corrosion rates within a certain margin of error, as well as to establish the (in)accuracy of LPR measurements. This has been the focus of a number of investigations over many years, but still remains a concern (Wu et al., 2015).
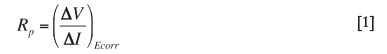
Corrosion monitoring has been used for many years in a variety of industrial environments (Albaya, Cobo, and Bessone, 1973; Clement et al., 2012). Two trusted techniques of corrosion monitoring that are used extensively are electrical resistance (ER) and linear polarization resistance (LPR). Recently, other corrosion monitoring techniques have been developed but the principles have remained consistent. Corrosion can be monitored through the physical loss of metal from the probe or the vessel itself, or by an electrochemical measurement technique. This study will focus on the LPR technique, which stems from the work of Stern and Geary (1957) who found that the slope of current-potential plot around the corrosion potential is essentially linear. The slope, which is called the linear polarization resistance (Rp), Rpdefined mathematically as:
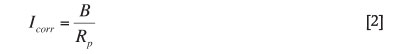
Rpis related to corrosion current (Icorr) by Equation [2]:
The constant B is defined in Equation [3]:
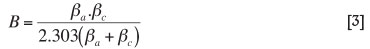
where βaand βcare anodic and cathodic Tafel constants. Typical values for these constants have been presented by Rosen and Harris (1983).
The current study originated from a more comprehensive investigation of the influence of carbonate and alkalinity on the corrosion rate of plain carbon steel. Two methods were employed to determine the progression of the corrosion rate over time, as opposed to the average corrosion rate over a certain exposure period. Firstly, the corrosion rate was determined by the exposure of corrosion coupons to the particular environment, and secondly, the rate was determined with a corrosion probe on a daily basis. The actual corrosion conditions were chosen to simulate the effect that certain critical brackish cooling water parameters would have on the corrosion of steel. Initially (although not reported here), the corrosion of steel exposed to actual brackish cooling water from a steel mill was investigated with regard to typical parameters, which were subsequently systematically studied by making up a synthetic solution to approximate the most suitable composition.
Experimental procedure
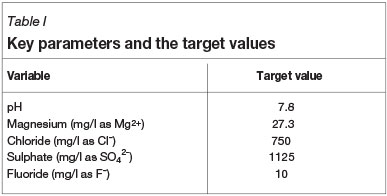
This investigation formed part of a study to determine the relationship between the calcium hardness and alkalinity and the corrosion rate of mild steel in brackish cooling water at temperatures of 35°C and 45°C. These temperatures were chosen in order to simulate the cooling water conditions on a plant. These tests are part of numerous other laboratory tests that were conducted for this programme using synthetic solutions that were prepared to simulate a typical steel-mill brackish cooling water. The calcium hardness and total alkalinity were varied by adding analytical grade calcium chloride and sodium hydrogen carbonate respectively. The balancing ions, e.g. chlorides and sodium, were adjusted by adding analytical reagent grade magnesium chloride, sodium chloride, sodium sulphate, and sodium fluoride. The pH was not adjusted, but the pH values were recorded. The calcium concentrations evaluated were 50, 62.6, 75, 87.5, and 100 mg/l Ca2+; and the total alkalinity levels 55, 82.5, 110, 165, and 220 mg/l CaCO3. Table I shows the target values of various parameters.
C1010 (mild steel) corrosion coupons (12.7 x 76.2 x 1.59 mm with a 4.76 mm hole) were exposed to synthetic test solutions (4000 ml) for 36 hours. The coupons were then removed, cleaned with a water wash to finger-touch, followed by an ethanol wipe, and then oven-dried, weighed, and the corrosion rates calculated based on the weight loss. The method followed was in accordance with ASTM G31-72 and G1-90 methods (ASTM G31-72, 2004; ASTM G1-03, 2011.
A commercial corrosion probe was used to measure the general corrosion rate. Only one type of commercial probe was used, and probes from different manufacturers were not compared. The test solutions were also analysed for total iron concentration and the results compared with the coupon method and probe readings. Each set of tests was performed in a batch of six tests over a period of three days. Two coupons were exposed to each solution, and four separate corrosion probe measurements were made over the exposure period. These measurements were averaged and compared to the average weight loss of the two coupons exposed to the same environment. New probe electrodes were used for each test, and these were of the same material as the steel used for the coupons.
The corrosion testing set-up used a dedicated 5-litre beaker with an overhead paddle stirrer, temperature control, and two coupons plus the corrosion probe.
Results
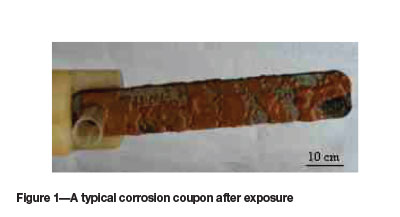
The mode of corrosion was slightly localized, not in the form of pitting corrosion or uniform corrosion across the entire surface, but rather in the form of a pattern where more severe corrosion occurred in certain regions (Figure 1).
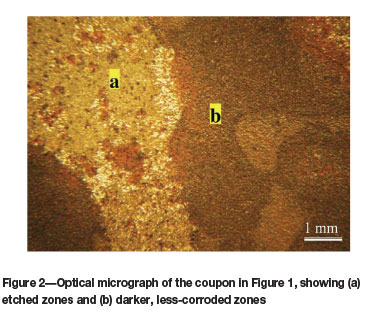
An optical micrograph of the corroded surface after cleaning is shown in Figure 2.
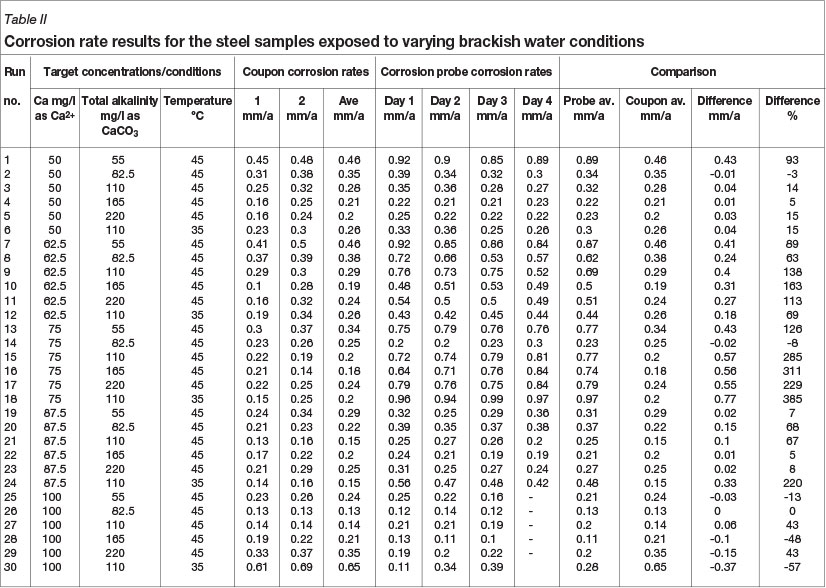
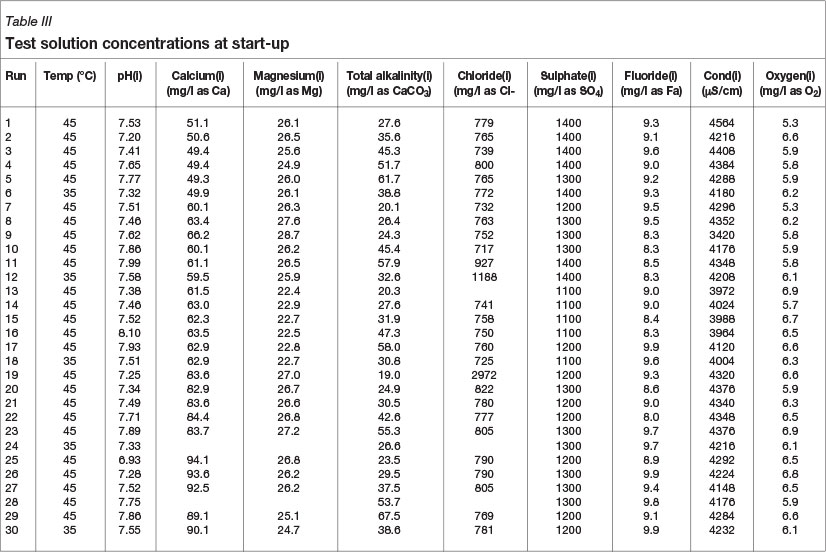
The corrosion results obtained under different conditions are shown in Table II. Table III shows the concentrations of the test solutions at the beginning of each run.
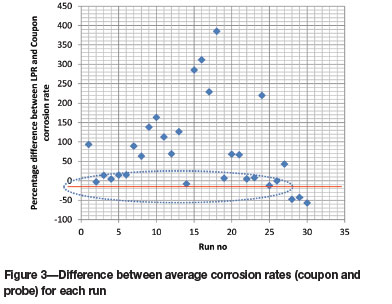
The percentage differences between the LPR corrosion rate (probe average) and the weight loss (coupon average) for each run are shown in Figure 3. Only 11 out of 30 runs resulted in a percentage difference of less than 40%, therefore 37% of the probe measurements were acceptably close to the corrosion coupon measurements. The standard deviation of this difference between the probe measurements and the coupon measurements was 110%. The coupon results showed a general consistency, and the standard deviation on the percentage difference between the two coupon results per run was 21%.
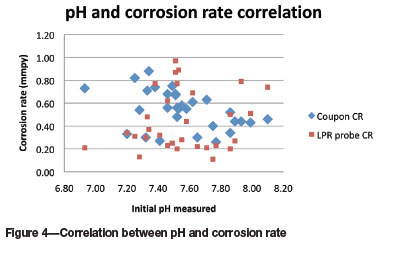
The effects of the individual parameters on the corrosion rates as measured by both methods, and comparisons of these two methods for each parameter - pH, initial conductivity, total alkalinity, calcium, magnesium, and fluoride - are shown in Figure 4-9. In most instances the initial parameter values did not change significantly throughout the test.


The conductivity data (Figure 3) shows that at initial conductivities between 4000 and 4500 μS/cm, the LPR measurements are lower than the coupon measurements.
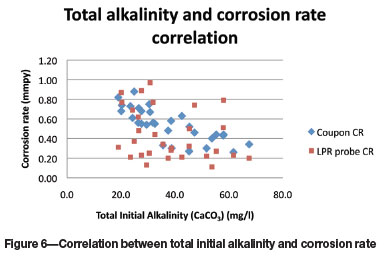
The data for the total alkalinity (Figure 5) is widely scattered; there is a significant grouping of LPR corrosion rates that are significantly below the coupon corrosion rates.
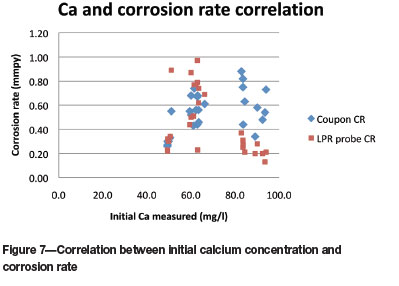
At the higher calcium concentrations (between 80 and 100 g/l), the corrosion rates measured with the LPR probe are significantly lower than the coupon corrosion rates (Figure 7).
The initial magnesium concentration did not seem to have any effect on corrosion rate, as shown in Figure 8.
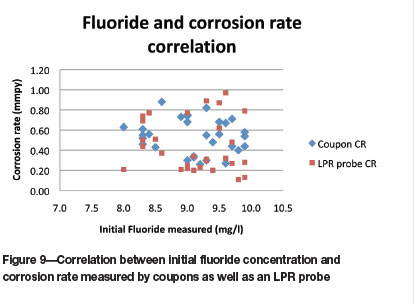
For the fluoride concentrations (Figure 9), the spread of the corrosion data from the LPR probe is wider than for the coupon corrosion rates, and no correlation is evident.
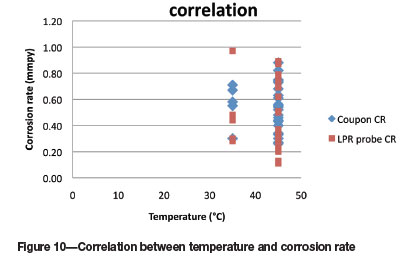
The influence of temperature on the corrosion rate measurements is shown in Figure 10. Unfortunately only five tests were performed at the lower temperature of 35°C, and a rigorous comparison is not possible. However, at the lower temperature it would appear that the LPR probe measurements were in general slightly lower than the coupon corrosion rates, except for one data point. At the higher temperature of 45°C, the spread of data was very similar. The correlation between the two corrosion rate measurement methods was compared and similar trends were found for calcium, fluoride, and chloride at the lower temperature.
It would appear that the only parameters that had any discernible effect on the difference between the two readings were calcium, alkalinity, and conductivity (over a limited region). For all of these parameters the probe corrosion rates over a certain region were less than the coupon corrosion rates.
Discussion
Only 37% of the probe measurements gave acceptable results (less than 40% difference between the probe result and the coupon corrosion rate), and almost the same percentage of the measurements differed from the coupon corrosion results by between 100% and 385%. In an industrial environment, erroneous measurement of high corrosion rates would lead to overdosing of the cooling water with corrosion inhibitor, increasing costs unnecessarily.
Variations in the solution parameters did not have a significant effect on the measured corrosion rate, although higher alkalinity, calcium content, and conductivity seemed to slightly reduce the corrosion rates measured by the probe.
The LPR probes have to be used in a conductive environment to ensure that they operate correctly according to the electrochemical basis of the measurement. However, with these probes the measurement time is very short and the results are available almost immediately; the results from an electrical resistance probe are only available after several days. The LRP probes have several other limitations (Walter, 1977; Jarragh et al., 2014; Scully, 2000; Glass and Kane, 2013). The type of corrosion probe that was used is not discussed in this study. Differences such as the scan rate used by the manufacturer would contribute to variation in the measurements (Zhang et al., 2009), but to eliminate further complexity this variable was excluded. The solution resistance is, naturally, important (Walter, 1977), but in this instance it would not have contributed to the error. The scan rate of the analysis plays an important role in ensuring accurate results, and due to the increase in capacitance with higher scan rates very low scan rates have to be used in order to obtain measurements that have a low error. Unfortunately this parameter could not be varied on the commercial instrumentation, but it has to be considered as introducing a consistent error, although it could have been the cause for the measurement errors. Electrode bridging is another factor that could cause an error, but this would occur at much longer exposure times and again does not apply to the current study. Turnbull and Robinson (2005) mention that the full charge transfer resistance is hardly ever measured, and therefore corrosion rates are easily overestimated. Jones (1996) mentions three other causes for errors: uncertain Tafel constants, nonlinearity of polarization curves (Mansfeld, 1973), and competing redox reactions. Of these, the uncertain Tafel constants and nonlinearity of the polarization curves would be the most likely factors that would have caused the measurement errors.
Wu et al. (2015) also found that LPR corrosion rates were generally much greater than the coupon corrosion rates. They suggested that a reduction reaction that involves the corrosion product FeO.OH occurs under electrochemical conditions and thereby the anodic dissolution is enhanced. In addition, the style of corrosion found on the corrosion coupons suggests a type of localized corrosion, in the sense that corrosion did not occur uniformly over the whole coupon, while on the corrosion probe elements, which were smaller than the coupons, the corrosion was more uniform and the effect not as noticeable.
Conclusions
1. The LPR probe results gave acceptable corrosion rate results for only 37% of all measurements made
2. The coupon corrosion rates were stable and relatively consistent, with a standard deviation of 21%
3. LPR results in the worst instance were almost four times the corrosion rate measured on the coupons. This could lead to overdosing with corrosion inhibitor, increasing the cost of water treatment unnecessarily.
Acknowledgements
The support of the DST/NRF Centre of Excellence in Strong Materials (CoE-SM) towards this research is hereby acknowledged. The Department of Science and Technology and the National Research Foundation, South Africa are thanked for financial support.
References
Albaya, H.C., Cobo, O.A., and Bessone, J.B. 1973. Some consideration in determining corrosion rates from linear polarization measurements. Corrosion Science, vol. 13, no. 4. pp. 287-293. [ Links ]
ASTM G31-72. 2004. Standard Practice for Laboratory Immersion Corrosion Testing of Metals. ASTM International, West Conshohocken, PA. [ Links ]
ASTM G1 - 03. 2011 Standard Practice for Preparing, Cleaning, and Evaluating Corrosion Test Specimens. ASTM International, West Conshohocken, PA. [ Links ]
Clément, A., Laurens, S., Arliguie, G., and Deby, F. 2012. Numerical study of the linear polarisation resistance technique applied to reinforced concrete for corrosion assessment. European Journal of Environmental and Civil Engineering, vol. 16, February. pp. 491-504. [ Links ]
Glass, J.P. and Kane, R. 2013. Oxygen and corrosion probes - performance and limitations in laboratory: an assessment for ethanol pipeline service. Corrosion 2013, Orlando, Florida,16-21 March 2013. NACE International, Houston, TX. [ Links ]
Jaske, C.E., Beavers, J.A., and Thompson, N.G. 2002. Improving plant reliability through corrosion monitoring. Corrosion Prevention and Control, vol. 49, no. 1. pp. 3-12. [ Links ]
Jarragh, A., Al-Shamari, A.R., Islam, M., Al-Sulaiman, S., Lenka, B., and Prakash, S. 2014. Evaluation of the effectiveness of online corrosion monitoring utilizing ER/LPR probes and coupon within hydrocarbon systems. Corrosion 2014, San Antonio, Texas, 9-14 March 2014. NACE International, Houston, TX. [ Links ]
Jones, D.A. 1996. Principles and Prevention of Corrosion. 2nd edn. Prentice Hall, Upper Saddle River, NJ, USA. pp. 157-159. [ Links ]
Mansfeld, F. 1973. Tafel slopes and corrosion rates from polarization resistance measurements. Corrosion, vol. 29, no. 10. pp. 397-402. [ Links ]
Rosen, M. and Harris, J.G. 1983. Tafel constants and changes in hydrogen coverage during corrosion of Fe18Cr. Journal of the Electrochemical Society, vol. 130, no. 12. pp. 2329-2334. [ Links ]
Scully, J.R. 2000. Polarization resistance method for determination of instantaneous corrosion rates. Corrosion, vol. 56, no. 2. pp. 199-218. [ Links ]
Stern, M. and Geary, A.L. 1957. Electrochemical polarization: I. A theoretical analysis of the shape of polarization curves. Journal of the Electrochemical Society, vol. 104, no. 1. January. pp. 56-63. [ Links ]
Turnbull, I.A. and Robinson, M.J. 2005. Investigation into boiler corrosion on the historic vessel SL Dolly. Corrosion Engineering, Science and Technology, vol. 40, no. 2. pp. 143-148. [ Links ]
Walter, G.W. 1977. Problems arising in the determination of accurate corrosion rates from polarization resistance measurements. Corrosion Science, vol. 17, no. 12. pp. 983-993. [ Links ]
Wu, J.-W., Bai, D., Baker, A.P., Li, Z.-H., and Liu, X.-B. 2015. Electrochemical techniques correlation study of on-line corrosion monitoring probes. Matererials and Corrosion, vol. 66, no. 2. pp. 143-151. [ Links ]
Zhang, X.L., Jiang, Z.H., Yao, Z.P., Song, Y., and Wu, Z.D. 2009. Effects of scan rate on the potentiodynamic polarization curve obtained to determine the Tafel slopes and corrosion current density. Corrosion Science, vol. 51, no. 3. pp. 581-587. [ Links ]
This paper was first presented at the, Africorr Inaugural African Corrosion Congress 2014, 27–30 July 2014, Farm Inn Country Hotel & Wildlife Sanctuary, Pretoria, South Africa.

