


Services on Demand
Article
 English (pdf)
 Article in xml format
 Article references
Indicators

Related links
-
 Cited by Google
 -
 Similars in Google
Share

 Permalink
Journal of the Southern African Institute of Mining and Metallurgy
On-line version ISSN 2411-9717
Print version ISSN 2225-6253
J. S. Afr. Inst. Min. Metall. vol.115 n.2 Johannesburg Feb. 2015
GENERAL PAPER
Estimating mine planning software utilization for decision-making strategies in the South African gold mining sector
B. GencI; C. MusingwiniI; T. CelikII
ISchool of Mining Engineering, University of Witwatersrand, Johannesburg, South Africa
IISchool of Computer Science, University of Witwatersrand, Johannesburg, South Africa
SYNOPSIS
This paper discusses a new methodology for defining and measuring mine planning software utilization in the South African gold mining sector within an evolving data-set framework. An initial data-set showing the mine planning software providers, their corresponding software solutions, as well as the software capabilities and information on the number of licences was collected and compiled in 2012 in an online database for software utilized in the South African mining industry. Details of the database development and implementation were published in the Journal of the Southern African Institute of Mining and Metallurgy in 2013. In 2014 the data-set was updated with additional and new information.
Using the 2012 and 2014 timestamps, a methodology for estimating the software utilization was developed. In this methodology, the three variables of commodity, functionality, and time factor were used to define and measure the software utilization in order to ultimately inform decision-making strategies for optimal software utilization. Using six different functionalities, namely Geological Data Management, Geological Modelling and Resource Estimation, Design and Layout, Scheduling, Financial Valuation, and Optimization, utilization in the gold sector was measured. This paper presents the methodology employed for measuring the mine planning software utilization. The methodology is useful for stakeholders reviewing existing software combinations or intending to purchase new software in the near future and who want to estimate the comparative attractiveness of a certain software package. These stakeholders include mining companies, consulting companies, educational institutions, and software providers. The work presented in this paper is part of a PhD research study in the School of Mining Engineering at the University of the Witwatersrand.
Keywords: gold sector, mine planning software, software utilization, database, South African mining industry.
Introduction
This paper outlines the development of a new methodology to define and measure mine planning software utilization in the South African gold mining sector. Although the calculations can be done for any commodity, in this paper calculations were done only for gold, as gold is not only used in a variety of different fields such as electronics, engineering, and health care, but also gold generated almost 13% of South Africa's mining income during 2013 (Statistics South Africa, 2014).
An initial data-set showing the mine planning software providers, their corresponding software solutions, as well as the software capabilities and information on the number of licences was collected and compiled in 2012 in an online database. Details of the database development and implementation were published in the Journal of the Southern African Institute of Mining and Metallurgy in 2013 (Katakwa, et al., 2013). In 2014 the data-set was updated with additional and new information. Using the updated data-set, a methodology was developed to measure mine planning software utilization in the gold sector in order to ultimately inform decision-making strategies for optimal utilization.
Utilization is a well-known concept within the mining industry because of its ties with the level of productivity. Higher utilization often leads to higher productivity, hence better profit margins. From this point of view, utilization is an important factor regardless of the size of any operation, including those in the gold sector. The root of the word of utilization comes from the word 'utilize' meaning 'make practical and effective use of (Oxford English Dictionaries, 2014). By using this definition, software utilization can be defined as the effective use of mine planning software in South Africa; but in general, utilization is associated with the overall equipment effectiveness, which is one of the key performance-based metrics. It is important to understand the fundamentals behind these metrics.
Overall equipment effectiveness
In the literature, utilization is associated with time in a way such that it can be defined as the measurement of the time used to perform effective work. In the mining industry, regardless of whether it is a surface or underground operation, better equipment utilization often leads to higher level of productivity, hence profitability.
Although there are a number of ways to measure performance against the various metrics, the most widely used measure to determine performance against capability of the equipment is Overall Equipment Effectiveness (OEE). OEE measurement is also commonly used as a key performance indicator (KPI) in Total Productive Maintenance (TPM) and Lean Manufacturing programmes for measuring production efficiency (Vorne Industries, 2008).
There are six factors, also known as the 'Six Big Losses', which are the main causes of production losses. TPM and OEE programmes aim to control these six factors. Nakajima (1998) listed these six factors affecting equipment utilization as:
➤ Breakdown loss
➤ Setup and adjustment loss
➤ Idling and minor stoppage
➤ Reduced speed loss
➤ Quality defects and re-work
➤ Startup loss.
In the TPM model, Nakajima (1998) furthermore formulated utilization using availability, performance rate, and quality rate as shown in the following formula:
Equipment effectiveness = Availability x Performance rate x Quality rate
In this formula, equipment effectiveness defines the meaning of equipment utilization and is calculated by multiplying equipment availability by performance rate and quality rate. Figure 1 shows time factors effecting equipment utilization. In Figure 1, operation time is associated with the total available time for a given period, as this can be anything from a single shift to a whole month. As shown in Figure 1, loading time can be calculated by deducting downtime from the operation time.
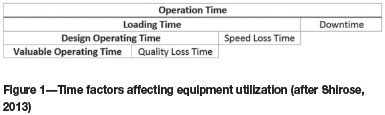
Availability can be calculated by dividing loading time by operation time. As the loading time calculation is already given, the availability formula is then (Shirose, 2013):

Furthermore, speed loss time is the lost time caused by operating below the planned speed, and can be calculated by using the actual time to make the production quantity minus the design time to make the same quantity, as formulated below (Shirose, 2013):
Speed loss time = Parts produced x (Design cycle time -Actual cycle time)
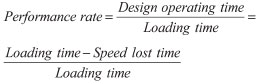
Cycle time is the time taken to produce one part. Design cycle time is used to calculate the equipment's designed production rate, and actual cycle time used to calculate the equipment's actual production rate. Design operating time is the time the equipment should have taken to produce the parts and is the difference between the loading time and the speed loss time. Performance rate is the ratio of the design operating time to loading time, as shown below (Shirose, 2013):
Quality loss time is the time lost making nonconforming material. Valuable operating time is the time the equipment spends making conforming material. Quality rate is the ratio of conforming parts produced to total parts produced, as shown below (Shirose, 2013):
Quality loss time = Nonconforming parts x Actual cycle time
Although OEE is a very powerful tool to measure efficiency, hence utilization; it is fundamentally designed for equipment utilization, which can be defined as hardware utilization. The aim of this study is to define strategic software utilization in the South African mining industry, which can be defined as software utilization. Although OEE gives some ideas regarding utilization, it is not designed to establish a framework that can bring a new approach towards strategic mine planning software utilization.
El-Ramly and Stroulia (2004) stated that there are a number of techniques available to understand how often software is being used, as well as to what extent it is being used. Many software systems collect, or can be set up to collect, data about how users employ them, i.e., system-user interaction data. Such data can be of great value for program understanding and re-engineering purposes. Sequential data mining methods can be applied to identify patterns of user activities from system-user interaction traces (El-Ramly and Stroulia (2004).
Despite the fact that user data may be available in some instances, using the data mining methods based on user behaviour to measure mine planning software utilization is inappropriate when considering the size of the South African gold sector and user privacy. By selecting the number of targeted mining sites, limited research output could be possible, but most probably would not be sufficient to satisfy the entire gold mining industry in South Africa.
To achieve a successful research initiative which covers the whole South African gold mining sector, a methodology was developed in such a way that optimal utilization of the various mine planning software packages that are used in gold mining sector could be measured. The next section defines this measurement framework.
Strategic software utilization
By using an analogy to the one given earlier, strategic software utilization can also be defined by associating many-to-many, one-to-many, and many-to-one relationships between entity types. In this association, the relationships between software vendors, commodity, functionality, and time factor were used to develop the following terminology:
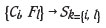
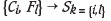
where 'Ci'denotes commodity (i) and 'Fl' denotes functionality (l).
Furthermore, Skis the software that performs tasks on commodity (i) and functionality (l). In the market, there is usually more than one software solution specifically designed for commodity (i) and functionality (l). In order to identify and evaluate each particular software solution, a new index ( m) is used so that Sk(m) is defined to represent a unique software solution, whereas k={i,l} is an index which is a specific combination of {i,l}, and
m=1, 2, 3...M
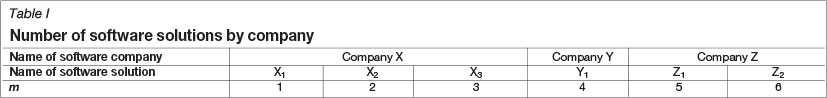
where M is the total number of software solutions. For example, assume there are three software companies, X, Y, and Z. Each of these three companies might have a number of software solutions, i.e. software company X has three types of software, namely X1, X2, and X3; company Y has only one type, namely Y1; and company Z has two types of software, namely Z1and Z2. Table I displays how to find M.
From Table I, the total number of available software solutions, M, is 6.
Using a similar approach, the utilization of the software can also be defined. Although there is no rigid definition of software utilization, it can be defined as a numeric value that falls in to the range between 0 and 1 inclusive, i.e.

where ui,l(m) is the utilization of the software that performs task on commodity (i) and functionality (l) by using software ( m). Thus, further analytic development on the software utilisation can be accomplished. Furthermore, the utilization formula can be extended by considering the time factor (t) as follows:
where fi,l(m,t) is a quantity factor that relates to the software that performs a specific task on commodity (i) and functionality (l) using software (m) at a specific time (t), and wi,l(m,t) is the weighing factor, which will handle the missing data-related issues and/or other factors such as market capitalization of the companies. For instance fi,l(m,t) can be defined as the total number of sites. For example, if the market capitalizations of the software companies X and Y are US$1 million and US$100 million respectively, but both companies have a software solution with the same functionality, then the weighing factor for the small company will be higher than that for the larger company. Furthermore, the price of the mine planning software as well as support availability plays an important role when considering the weighing factor.
Software utilization is already defined in a generic way. However, the software utilization can also be defined in a specific way, i.e. the relative utilization (r). Relative utilization can be considered as a weighted software utilization and can be formulated as:
where  is total utilisation of all software which is used for normalization.
Calculating relative utilization leads to weighted market impact of the software utilization. However, calculating relative utilization, three variables were used to generate the results, namely:
➤ Commodity (i)
➤ Functionality (l)
➤ Time factor (t).
For example, the following results were calculated for only one commodity (i), namely gold, using six different functionalities (l) (Katakwa et al., 2013):
1. Geological Data Management
2. Geological Modelling and Resource Estimation
3. Design and Layout
4. Scheduling
5. Financial Valuation
6. Optimization.
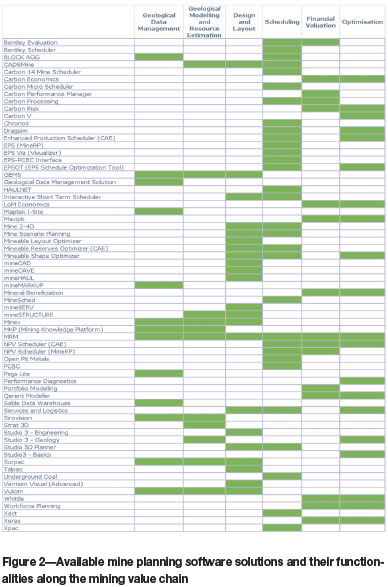
The six functionalities listed by Katakwa et al. originated from the Open Group's Business Reference Model, which categorizes not only the functionalities of mine planning software, but also mine value chain stages and mining methods (The Open Group, 2010). The Open Group's Business Reference Model illustrates how the various software solutions interact with each other, although this classification can be debateable. For example, Mine 2-4D software, which is used in mine scheduling, is often used in conjunction with Enhanced Production Scheduler (EPS) as it cannot produce a schedule without the use of EPS. Figure 2 shows the names of available mine planning software solutions and their functionalities along the mining value chain.
The time (t) factor has two timestamp indicators showing different data collection dates, namely:
➤ September 2012, t=1
➤ April 2014, t=2
By using all three variables, the weighted software utilization, hence the market impact of each participating mine planning software solution, was calculated. The data-set was extracted from the updated database and the programming language GNU Octave was used for the data analysis and the calculation of the software utilization per functionality for the selected commodity (gold) using two different timestamps as mentioned previously.
It is important to note that if fi,l(m,t) is 0, the subject software either does not support the specific functionality or does not support the specific commodity. Furthermore, when calculating ui,l(m,t) and wi,l(m,t), the value is set to 1 as at this stage of calculation it was decided that the weighted software utilization did not have any impact on the calculation of the relative software utilization. Unique identifiers of each particular software solution are not named in this research work, and the identifiers (ids) have been numbered randomly.
Results for the gold sector
In this section, strategic mine planning software utilization for commodity (i) gold is calculated. Six functionalities (l) with two timestamps (t) were used for the calculations and the results for each functionality with two timestamps are presented as tables and figures, respectively. Accordingly, a total number of {6(l) x 2(t) = 12} tables were created for each commodity. According to the functionality list provided earlier, the first functionality, 'Geological Data Management' was used with two different timestamps to produce the first sets of two tables. After generating the tables, pie charts were created for each table for easy interpretation of the results. Consequently, using the functionality list, the remaining tables and figures were created in a similar manner.
The following software providers participated in this study: Geovia, MineRP Solutions, Sable, RungePincockMinarco, Maptek, Cyest Technology, and CAE Mining. Note that the data on CAE Mining was only made available in the April 2014 data-set. The results presented here do not cater for either the mining methods or the type of mine (surface or an underground operation).
Geological data management software results for gold
Table II shows the market impact of the individual software solutions for gold using the functionality Geological Data Management as at September 2012 while Table III shows the same results using the second timestamp, i.e. April 2014. Figure 3 illustrates both tables graphically. Note that fi,l(m,t), wi,l(m,t), ui,l(m,t), ri,l(m,t)and column headings in Tables II to XII were defined previously.
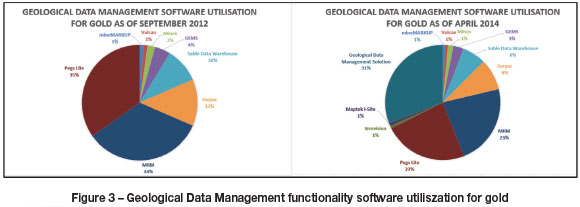
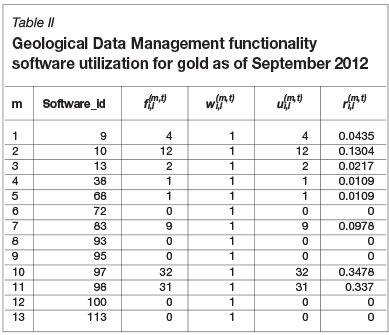
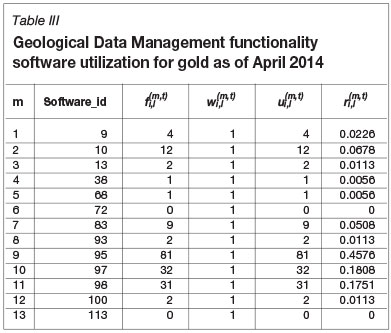
When comparing the diagrams in Figure 3, there is a significant difference between the two pie charts; CAE Mining's Geological Data Management Solution software with a 31% market impact in the April 2014 chart is clearly visible. Pegs Lite and MRM have each a 23% market impact in this field.
Geological modelling and resource estimation software results for gold
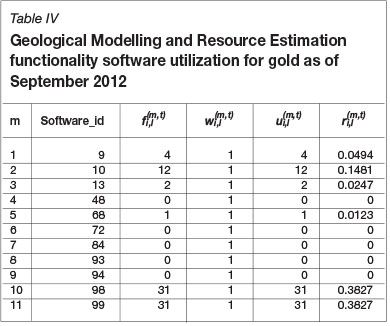
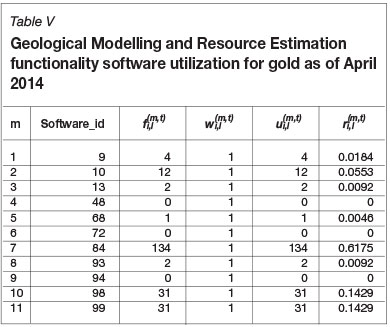
Table IV shows the market impact of the individual software for gold using the Geological Modelling and Resource Estimation functionality as at September, 2012, while Table V shows the same results using the second timestamp, April 2014. Figure 4 illustrates both tables graphically.
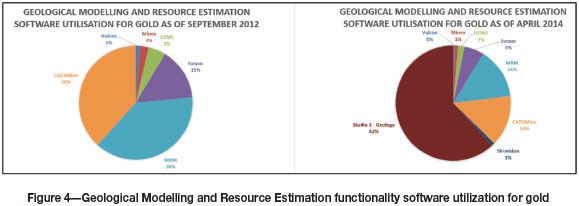
When comparing the diagrams in Figure 4, similar to the previous results, there is huge difference between the two pie charts; Studio 3 - Geology is the leading software with a 62% market impact in the April 2014 chart. Pegs Lite and MRM have each a 14% market impact in this field.
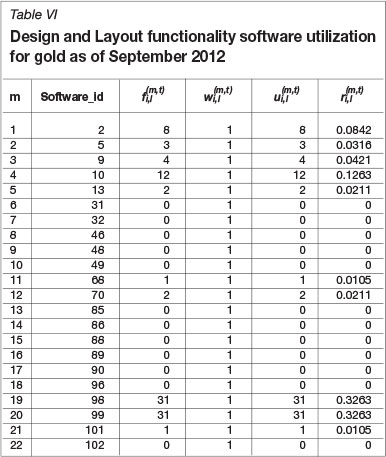
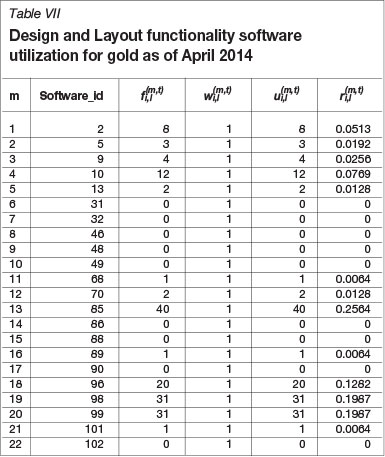
Design and layout software results for gold
Table VI shows the market impact of the individual software solutions for gold using the Design and Layout functionality as at September 2012, while Table VII shows the same results using the second timestamp, April 2014. Figure 5 illustrates both tables graphically.
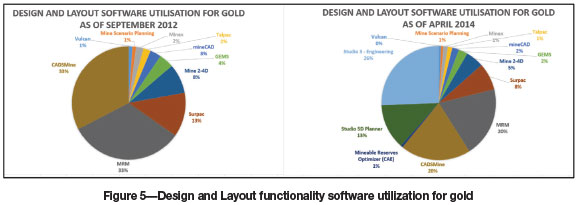
When comparing the diagrams in Figure 5, similar to the previous results, there is significant difference between the two pie charts; Studio 3 - Engineering is the leading software with a 26% market impact in the April 2014 chart. MRM and CADSMine have each a 20% market impact in this field.
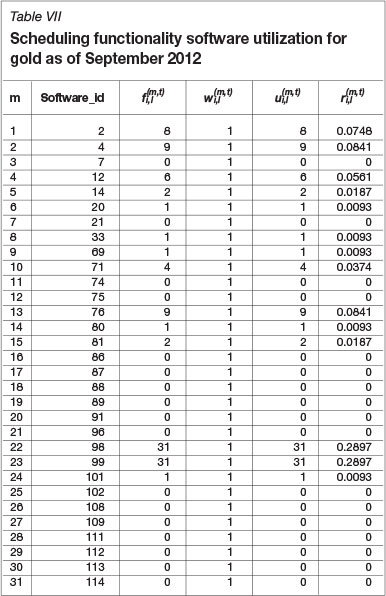
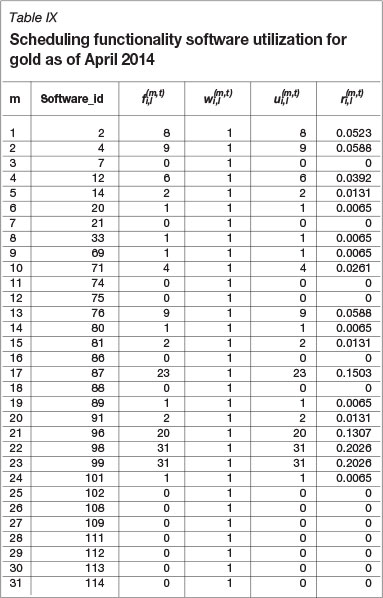
Scheduling software results for gold
Table VIII shows the market impact of the individual software solutions for gold using the Scheduling functionality as at September 2012, while Table IX shows the same results using the second timestamp, April 2014. Figure 6 is a graphical representation of Table VIII, while Figure 7 shows the graphical representation of Table IX.
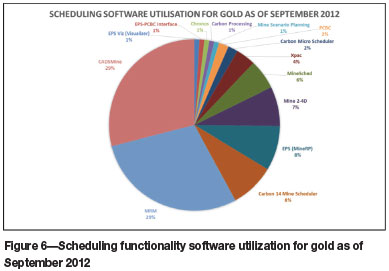
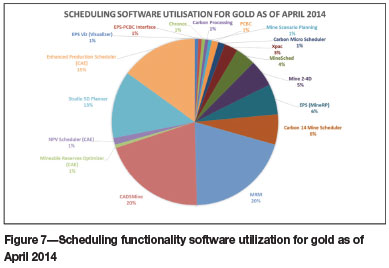
There is not much difference between Figure 6 and Figure 7; MRM and CADSMine software still have the biggest market impact, both with 20%, in the Scheduling software field. Enhanced Production Scheduler (CAE) has 15% market impact in this field.
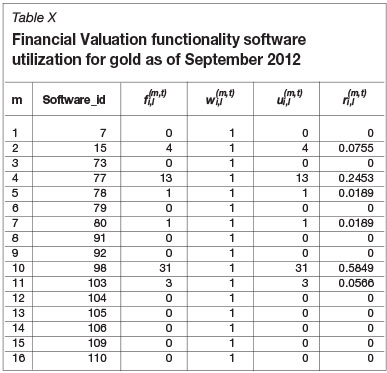
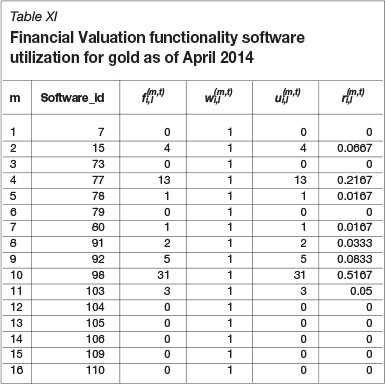
Financial valuation software results for gold
Table X shows the market impact of the individual software solutions for gold using the Financial Valuation software functionality as at September 2012, while Table XI shows the same results using the second timestamp, April 2014. Figure 8 illustrates both tables graphically.
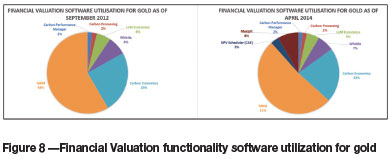
Figure 8 indicates that MRM is the leading software, with a 51% market impact in the gold sector when it comes to the Financial Valuation software. Carbon Economics is in second place with a 21% market impact in this field.
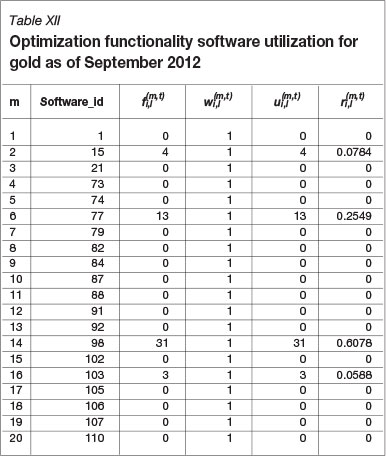
Optimization software results for gold
Table XII shows the market impact of the individual software solutions for the commodity gold using the Optimization functionality as at September, 2012, while Table XIII shows the same results using the second timestamp, April 2014. Figure 9 is a graphical representation of both tables.
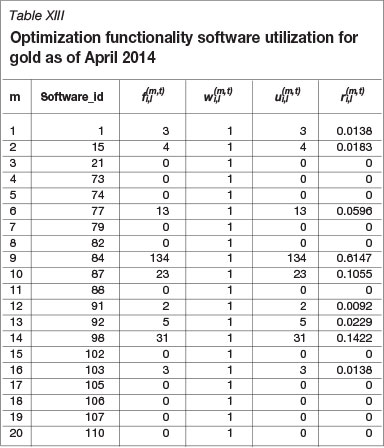
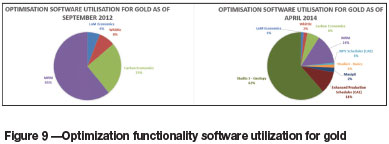
When comparing the diagrams in Figure 9, there is a noteworthy difference between the two pie charts; Studio 3 -Geology has emerged as a new leader with a 62% market impact in April 2014, followed by MRM with a 14% market impact in the Optimization software field.
Conclusion
In this paper, a methodology for the evaluation of mine planning software for measuring utilization in the South African gold mining sector was developed. Three variables, namely, commodity (i), functionality (l), and time factor (t) were used to calculate the results. Although the calculations can be done for any commodity in a similar manner, in this paper, calculations were done only for gold; six functionalities namely Geological Data Management, Geological Modelling and Resource Estimation, Design and Layout, Scheduling, Financial Valuation, and Optimization were applied using two different timestamps (September 2012 and April 2014). It is important to note that data on CAE Mining was only made available in the April 2014 data-set. When comparing the results, the CAE Mining market impact is clearly visible in the gold sector, especially in the fields of Geological Data Management, Geological Modelling and Resource Estimation, Design and Layout, and Optimization.
By using this newly developed framework, utilization of the various mine planning software solutions was measured. This methodology provides an opportunity for software users to review existing software combinations, or for those intending to purchase new software, a tool for estimating the comparative attractiveness of certain software packages. For example, mining companies can position themselves better by acquiring optimal combinations of mine planning software; consulting companies can advise their clients more effectively to make the right choices of software solutions; tertiary education institutions offering mining-related qualifications can strategically choose which software to expose their students to; and software providers can strategically position themselves within the mine planning software market.
References
El-Ramly, M. and Stroulia, E. (2004. Mining software usage data. International Workshop on Mining Software Repositories MSR 2004 W17S. Workshop, 26th International Conference on Software Engineering, 25 May 2004, Edinburgh, UK. Vol. 2004, no. 917. pp. 64-68. [ Links ]
Katakwa, T.P., Musingwini, C., and Genc, B. 2013. Online database of mine planning and peripheral software used in the South African mining industry. Journal of the Southern African Institute of Mining and Metallurgy, vol. 113, no. 6. pp. 497-504. [ Links ]
Nakajima, S. 1998. Introduction to Total Productive Maintenance. Productivity Press, Cambridge, MA. [ Links ]
Oxford Dictionaries. 2014. Utilize. http://www.oxforddictionaries.com/definition/english/utilize?q=utilize [Accessed 15 June 2014]. [ Links ]
Shirose, K. 2014. Equipment Utilization Metrics. http://www.ombuenterprises.com/LibraryPDFs/Equipment_Utilization_Metrics.pdf [Accessed 15 June 2014]. [ Links ]
Statistics South Africa. 2014. Publications. http://beta2.statssa.gov.za/publications/P2041/P2041January2014.pdf [Accessed 24 July 2014]. [ Links ]
The Open Group. 2010. The exploration and mining business reference model.https://collaboration.opengroup.org/emmmv/documents/22706/Getting_started_with_the_EM_Business_Model_v_01.00.pdf [Accessed 21 July 2014]. [ Links ]
Vorne Industries. 2008. The Fast Guide to OEE. http://www.vorne.com/pdf/fast-guide-to-oee.pdf [Accessed 15 June 2014]. [ Links ]

