


Servicios Personalizados
Articulo
 Inglés (pdf)
 Articulo en XML
 Referencias del artículo
Indicadores

Links relacionados
-
 Citado por Google
 -
 Similares en Google
Compartir

 Permalink
Journal of the Southern African Institute of Mining and Metallurgy
versión On-line ISSN 2411-9717
versión impresa ISSN 2225-6253
J. S. Afr. Inst. Min. Metall. vol.114 no.12 Johannesburg dic. 2014
A SOUTHERN AFRICAN SILVER ANNIVERSARY MEETING, 2014 SOMP
Modelling and determining the technical efficiency of a surface coal mine supply chain
M.D. Budeba; J.W. Joubert; R.C.W. Webber-Youngman
Department of Mining Engineering, University of Pretoria, Pretoria, South Africa
SYNOPSIS
Determining the efficiency of a surface coal mine operation is an essential activity, which can help in deciding on the optimal use of input resources, including effective capital allocation, in generating a desired quantity of coal of a specific quality.
Mines operate today in challenging conditions, with diminishing reserves of high-quality coal, remote location of new coal deposits, infrastructure problems, environmental legislation, and the effects of climate. All these have an impact on the performance of a mine. Given such challenges, a company has to be technically efficient compared to other existing coal producers in order to generate profits. It can use the measurement of its efficiency to evaluate its productivity, benchmarking this against the best-performing mines and determining optimal variables in order to minimize slack and achieve the desired outputs.
This paper discusses the use of Data Envelopment Analysis (DEA) in evaluating the efficiency of a surface coal mine supply chain for the coal export market. The supply chain is considered to be composed of sub-processes that are modelled as a multistage system. Numeric examples will be used to illustrate the application of DEA.
Keywords: DEA, technical efficiency, surface coal mine.
Introduction
Coal is a fossil fuel mineral that has a variety of uses, including the generation of electricity, metallurgical applications such as steelmaking, cement manufacture, and petroleum fuel production. It contributes 25% of the world's primary energy needs, after fuel oil which contributes 35%. Thermal coal contributes about 40% of electrical energy, and it is anticipated that this will increase to 46% by 2030. The world energy demand, estimated for the period from 1990 to 2030, is growing at a cumulative annual growth rate (CAGR) of 1.7% (Schernikau, 2010). This reaffirms the need for enhanced production from existing mines, and the opening of new mines to increase the supply of coal and to meet increasing demand.
However, the demand for coal in the short term, estimated for the period from 2010 to 2016, is projected to increase by 2.8% per annum. This demand is driven mainly by the countries outside the Organisation for Economic Cooperation and Development (OECD), largely dominated by China and India.The demand for coal by China in the same period, for example, is estimated to be escalating at 5.2% per annum (IEA, 2011).
Despite the increasing demand for coal, Hook et al. (2010) emphasize that while coal resources are vast in many countries, the supply is affected by geology. The depletion of the more easily accessed coal could have an effect similar to the end of abundant and cheap oil. Once the more attractive coal has been depleted, extraction will become more expensive and complicated. In addition, the authors argue that coal reserves in the world are unevenly distributed. A few countries control the majority of the world's supplies, among them the USA, China, Russia, India, Indonesia, Australia, South Africa, Germany, Poland, and Kazakhstan. Together, these countries account for 93% of the world's hard coal reserves.
Coal is extracted using either surface or underground mining methods. The mine is required to be efficient and cost-effective in order to be competitive and profitable. The efficient mine is the one that uses a minimum of resources to deliver maximum output, or at least uses the same resources to produce a maximum output. Effective cost in particular is the hallmark of efficient mines. Such mines form the envelope of best practice, and can be used as a benchmark for the improvement of inefficient mines.
New and currently producing coal mines are subject to challenges that can affect their efficiency and cause uncertainties. Some of these challenges are related to the specific features of a deposit, for example coal seam thickness, and others such as remoteness, climate, environmental legislation, and the exchange rate. Shafiee, Nehring and Topal (2009) and Shafiee and Topal (2012) highlight factors such as a high stripping ratio, seams with complex metallurgical characteristics, mines located in isolated regions, lack of access roads, inadequate electricity and water supplies, unfavourable climate, and the challenges of mountain topography, all of which may cause project uncertainties. Major factors upon which management has to decide include the stripping ratio, capital allocation, choice of production rate, and the washing rate or crushing rate. All these can be divided into controllable (discretionary) or non-controllable (non-discretionary) variables. Thus mines need to be efficient and cost-effective in order to remain competitive relative to other producing mines.
Previous research in measuring the efficiency and competitiveness of surface coal mines has not considered the challenges highlighted in this paper. The available models can be considered as 'black boxes' because they do not incorporate details of supply chain sub-processes of coal for the export market. There is a need for a model that uses multiple inputs to generate multiple outputs of the whole supply chain while considering these challenges that affect the efficiency of the mine. The model will provide an insight into the competitiveness of the mine relative to other producers of coal for export.
This paper applies Data Envelopment Analysis (DEA) methodology, which is a linear programming technique that is used to determine the envelope of the best practice decision-making units (DMUs). DEA was used to develop a model that can be utilized to determine the envelope of the best-practice surface coal mine, using discretionary variables and applying linear regression to determining the influence of non-discretionary variables on the efficiency score.
The numerical example of eight DMUs that were used for illustration indicated that one DMU is technically efficient, while the remaining seven are technically inefficient. These are surface mines that need improvement in order to be efficient. It was also found that distance from the port (Distport) and precipitation influence the efficiency score of surface coal mines.
The contribution of this work includes development and demonstration of the application of the DEA model for measuring the relative efficiency of surface coal mines supplying coal for the export market only. In addition, the paper develops an understanding of the influence of the non-discretionary variables on efficiency score for a surface coal mine, which can help the mine to determine the set of controllable variables that will increase its competitiveness relative to other producers. For example, coal mining projects can select optimum technical variables such as capital to increase their competitiveness.
A literature review on efficiency measurement is first discussed. This is followed by an explanation of the research methodology and model formulation, and the application of the models is illustrated. Finally, conclusions are drawn and suggestions offered for further research.
Literature review
The concept of efficiency has been defined by various authors. In general, it involves the relationship between the inputs and outputs of an organization or a firm. In the work of Markovits-Somogyi (2012), efficiency is defined as the capacity of a company to realize its stated objectives and to use its available resources cost-effectively. According to Joubert (2010), efficiency analysis offers guidelines and benchmarks for both public and private enterprises to achieve maximum outputs with minimum inputs.
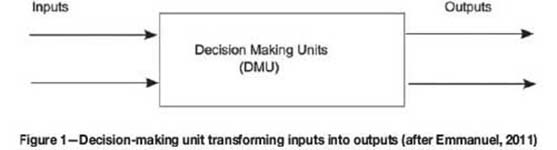
Figure 1 shows a diagram of a producing unit that could apply to both a profitable and a non-profitable organization. Referred to as a decision-making unit (DMU), it consumes inputs and transforms them into outputs.
Efficiency can be evaluated using parametric methods, those requiring the use of production functions such as regression and stochastic frontier; and non-parametric methods, which do not require a predefined function such as DEA. Most of these are used, but DEA in particular is a robust approach compared to the other methods, for the following reasons:
> It does not require a predefined function to be specified; hence it avoids error due to mis-specification of the function
> It can be used even when there is insufficient data
> It is used to measure efficiency of a unit involving multiple inputs and outputs.
The major shortcoming of DEA is that it is sensitive to outliers, which means that the data used needs to be free from measurement errors (Kumar and Gulati, 2008). In contrast, parametric methods need more data and also require a predefined function to be specified (Markovits-Somogyi, 2012). These factors make DEA preferable to other methods for measuring the efficiency of DMUs that use similar multiple inputs to generate similar outputs.
DEA was first introduced by Charnes and Cooper in 1978 (Cooper et al., 2007). It is a non-parametric method for measuring the efficiency of a DMU. DEA has been successfully applied since its introduction. For example, it has been used to evaluate the performance of various operations, including production planning, research and development, agricultural economics, airport performance, and other applications (Li et al., 2012). In particular, DEA has been used in evaluating the technical efficiency of coal mines, the growth in productivity in both opencast and underground mines, and in assessing the efficiency of coal mine safety measures (Kulshreshtha and Parikh, 2002; Shu-Ming, 2011; Tong and jia Ding, 2008). All these studies, however, consider DEA as a black box. They do not indicate those details of a mine operation that could decide either the efficiency or inefficiency of the mine.
The focus of the applications of DEA in coal mines has been on the general discretionary inputs and outputs; the influences of non-discretionary inputs have not been considered. Thus most of the applications consider the inputs and outputs of a mining company without detailing the components of the production system. It is difficult to assess the required technical levels of inputs in each sub-process of the coal supply chain; hence the evaluation views the coal mine as a black box.
Data envelopment analysis for efficiency measurement
DEA is based on a linear programming method that is used to determine a set of best practices regarded as being efficient (Li et al., 2012). The method is used to construct an envelope of the best-practice DMUs using similar inputs and outputs; the envelope is therefore determined by the pareto-efficient DMUs (Joubert, 2010).
The basic DEA models are those of Charnes-Cooper-Rhodes (CCR) and Banker-Charnes-Cooper (BCC) (Martic et al., 2009). CCR models assume a constant return to scale (CRS), and are based on the assumption that an increase in inputs results in a proportional increase in outputs. The CCR model is used to determine the overall efficiency of a DMU.
The BCC model assumes a variable return to scale (VRS), which means that the increase in inputs may result in either a lesser or greater proportional increase in outputs. The BCC model is therefore used for determining the pure technical efficiency of DMUs.
The pure technical efficiency approach measures the ability of management to utilize resources in producing outputs. CCR efficiency can be decomposed into scale efficiency and pure technical efficiency. Scale efficiency helps management to choose the optimal size of the DMU (Kumar and Gulati, 2008).
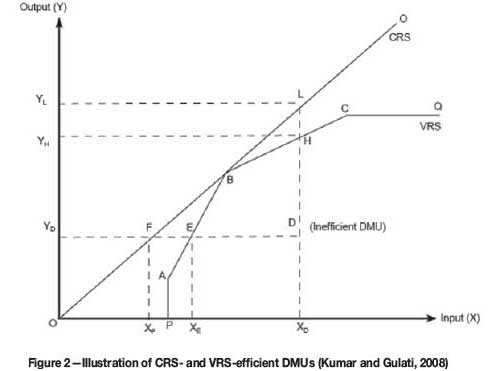
To illustrate the concept of DEA, consider a set of DMUs A, B, C, Q, and D, using a single input of resource to produce a single output (Figure 2). The DMUs A, B, C, and Q are efficient on VRS, thus forming an envelope of best-practice DMUs, while DMU D is inefficient. Based on CCR, only B is efficient, while the others are inefficient. A DMU is considered to be efficient if it has an efficiency score of 1.
Mathematical representation of basic DEA models
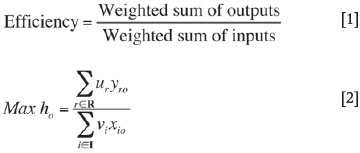
Consider a set J = (1...n), each member of which is considered to be a DMU using m inputs of for iE I and generating s outputs yrj for rE R. The weights assigned to inputs and outputs are viand urrespectively. The efficiency score can therefore be defined by Equation [1] (Talluri, 2000). The efficiency of each DMU expressed in a fractional program is then transformed and solved using the linear programming method (Cooper et al., 2007). The DMU under evaluation will be DMUj = o and its efficiency score is denoted by ho.
Subject to
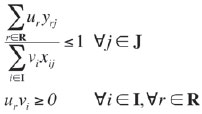
Equation [2] is a fractional program that can be transformed by Charnes-Cooper transformation into a linear program (LP):
subject to
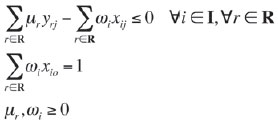
where
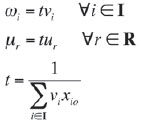
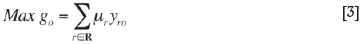
The dual of Equation [3] is given by the following linear program:

subject to
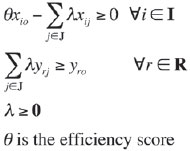
Equation [4] is solved n times, with n equal to the number of DMUs. If a variable return to scale is considered, the condition ∑λ = 1 is added in Equation [4]. Taking into account the presence of slack, the dual of Equation [3] is given in Equation [5].

subject to
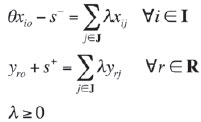
where s- and s+ are slacks for the input and output respectively.
Research methodology and model formulation
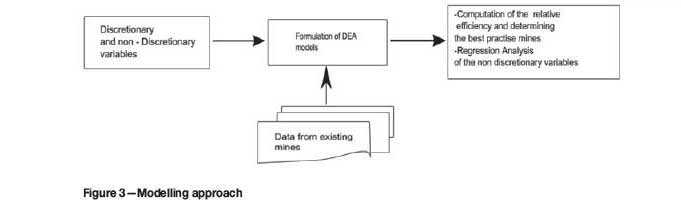
The model consists of two stages. The first stage is the formulation of the overall DEA model, comprising the mining operation, the washing operation, and transport to the port, using discretionary variables. The second stage is the regression of the non-discretionary variables on the efficiency score to assess the influence of non-discretionary variables. The resulting efficiency scores are dependent on one another, which violates the assumption of the regression models that the response and predictor variables should be independent. Xue et al. (1999) suggest that resampling by replacement (bootstrapping) of the efficiency scores to create other samples of the same size as the original sample will eliminate this dependency. The formulation approach is indicated in Figure 3.
> Discretionary and non-discretionary data were obtained through the Raw Material Group (IntierraRMG) database for coal. Other sources of data included technical articles, reports, and mining company annual reports
> Illustration was carried out through solving the models using General Algebra Modelling System (GAMS) software, a free demonstration system with limited application. Regression and bootstrap was carried out in R, which is free and open-source software.
Model formulation
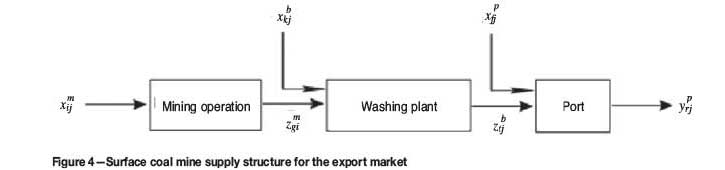
The formulation of the model involved examining the sub-process of surface coal mines that supply coal to the export market. The chain of the process includes mining, the washing process, and transportation to the port for export. The structure considered for this research is shown in Figure 4.
According to Cook et al. (2010), the overall efficiency of the multistage process is the convex linear combination of stage-level measures. This can be interpreted as the weighted efficiency of each subsystem of the whole multistage system. The weight assigned for the efficiency of each subsystem of the whole chain is the ratio of the input resources used by the subsystem under evaluation to the total input resource used by the whole system.
Chen et al. (2009) show that the weight assigned to the efficiency of each sub-process to obtain the overall efficiency should be greater than a parameter a which is chosen to avoid one or two of the weights being zero, and the rest being equal to 1 upon optimization. These concepts together were applied in the formulation of the DEA model for this research.
To formulate the model, we considered a set of surface coal mines J = {1...n}producing coal and supplying it to the export market. Each mine is considered as a DMU. Assuming that input to the mining operation denoted by m is i∈ {1,...,} inputs at the beginning of the washing operation denoted by b is k∈ {1,...,K} inputs at the beginning of port denoted byp is f ∈ {,...,F}, intermediate output from mining and as an input into the washing operation is g∈ {1,...,G}, and the output from the washing operation, which is also an input to the port, is t ∈ {1.....T}.
The following definitions for the symbols were used
 = the given amount of input i∈I to the mining operation m of DMU j∈J
 = the given amount of input k∈K to the washing plant b of DMU j∈J
 = the given amount of input f∈F to the port p of DMU j∈J
 = the amount of intermediate output from the mining operation and is an input to the washing plant of the DMU j∈J
 = the amount of intermediate output from the washing plant and is an input to the port of the DMU j∈J
 = the given amount of output r∈R from the port p of DMU j∈J
 = weight given to the outputs r∈R from the port p of DMU j∈J
 = weight given to the inputs f∈F in the port p of DMU j∈J
 = weight given to the outputs t∈T from the washing plant b of DMU j∈J
 = weight given to the inputs k∈K to the washing plant b of DMU j∈J
 = weight given to the inputs i∈I to the washing plant b of DMUj∈J
 = weight given to the outputs g∈G from mining and is an input to washing plant
 = weight for the inputs i∈I to the mining operation mafter transformation to linear program (LP)
 = weight for the inputs f∈F to the port p aftertransformation to LP
 = weight for the inputs k∈K to the washing plant b after transformation to LP
 = weight for the outputs g∈G from the mining operation m after transformation to LP
 = weight for the outputs t∈T from the washing operation b after transformation to LP
 = weight for the outputs r∈R from the port p after transformation to LP
 = an infinitesimal positive number that ensures the weights are positive.
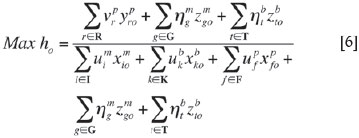
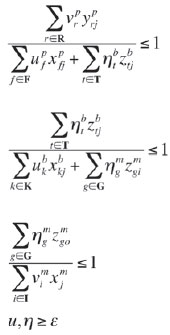
Convex linear combination of the efficiency of each sub-process was used to generate the overall efficiency of the supply chain. The resulting mathematical model of the surface coal mine supply chain for the export market represented by Figure 4 is presented in Equation [6].
subject to
The above linear programming was transformed by the Charnes-Cooper transformation approach in Equation[3] to yield:
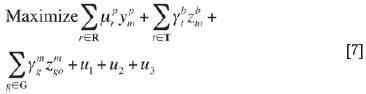
subject to
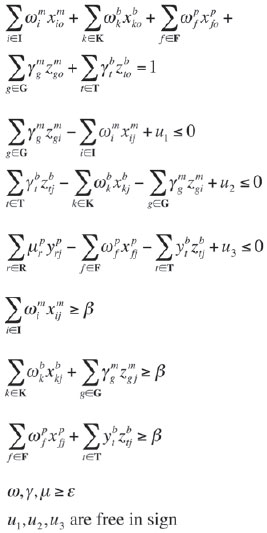
where:
u1, u2, u3 are added to account for variable return to scale for the mining operation, washing operation, and port respectively
ε is an infinitesimal number whose value is 10-6. It is used in ensuring that the optimal weights are positive
β is a parameter that is chosen to avoids the weights assigned to efficiency score in convex linear combination being zero upon optimization of efficiency, and also to ensure that there is a minimum weighted input for each DMU in each sub-process. In this research optimal value of β = 0.2
Considering the influence of non-discretionary variables on the resulting efficiency score, the linear regression was applied, using the efficiency score as a dependent variable and non-discretionary variables as independent variables (thickness, distance to the port, precipitation, life of mine (LOM), and calorific value (CV)). The regression model that was applied in this research is shown in Equation [8].
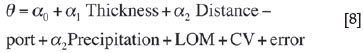
where θ is the efficiency score and a is the coefficient of regression.
Illustration of the application
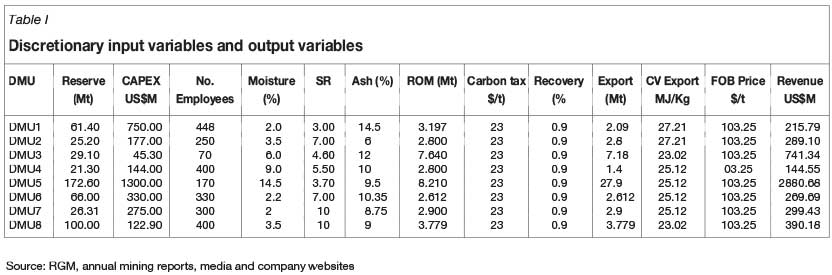
To illustrate the application of the model, data from eight surface coal mines producing coal for export were extracted from RMG database, while the supplementary information such as standards for export tons, number of employees and others were obtained from media reports, company websites, and mining company annual reports.
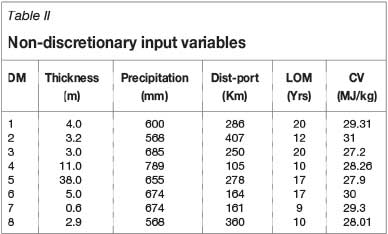
Data-sets for selected discretionary and non-discretionary variables are presented in Table I and Table II respectively. In Table I the revenue is secondary data that was calculated from the product of price and export tonnages. For illustration purposes, surface coal mines for this research were given DMU numbers.
The model in Equation [7] was solved using General Algebraic Modelling system software (GAMS), a free demonstration system considering discretionary variables only. In the second step, multiple regressions were applied on non-discretionary variables. The regression of the efficiency score on non-discretionary variables was done using the R open-source software.
The inputs for the sub-processes of the DEA model were:
> Mining operation: CAPEX (capital expenditure), stripping ratio (SR), number of employees, and moisture (%)
> Washing plant ROM, ash, and recovery
> Port: carbon tax.
The overall outputs of the model were revenue and CV-export.
Results
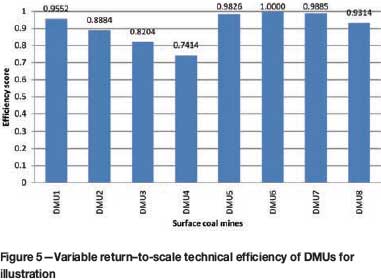
The results of the efficiency scores after solving the model (Equation [7]) using GAMS for each DMU using the data in Table I are presented in Figure 5. DMU 6 is technically efficient, with an efficiency score of 1; this DMU define the envelope of the best practice of all surface mines used in the illustration for the application. DMUs 1-5, 7, and 8) are inefficient surface coal mines with efficiency scores less than 1. This implies that in order to be efficient, DMU 1 has to improve by 4.5%, DMU 2 by 11.2%, DMU 3 by 18.0%, DMU 4 by 25.9%, DMU 5 by 1.7%, DMU 7 by 1.2%, and DMU 8 by 6.9% in relation to the best-practice mines through reduction of controllable inputs.
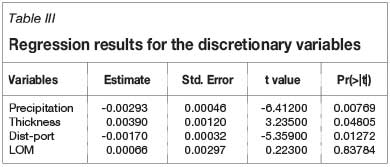
The influence of non-discretionary variables (Table II) on efficiency score for each DMU was determined using R software. The results are summarized in Table III. The summary statistics tests in Table III show that the probabilities (p-value) for t-value for coefficient of Dist-port, precipitation, and thickness variables are lower than the 0.05 significance level, while that of LOM is greater than 0.05. This suggests that the Dist-port, precipitation, and thickness variables have an influence on the efficiency scores, while LOM has no influence on the efficiency scores of the mines. The inclusion of the CV variable in the regression together with the other discretionary variables in Table II shows no relationship with the efficiency score. This is due to the relationship between the CV and the other predictor variables, which affects the regression results.
Bootstrap technique was applied to the efficiency scores obtained for each DMU to avoid dependence among them, so as to generate a random set of efficiency scores. For illustration purpose the data was resampled with replacement of 1000 samples, with each having eight DMUs, on the variables indicated in Table II, and then regression was applied to each sample. The results of the bootstrap regression are presented in Table IV.
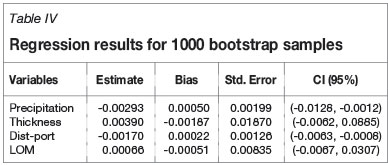
Through observation of the confidence interval 95% (CI) in Table IV, distance to the port (Dist-port) and precipitation affect the efficiency of a surface coal mine. This is because the confidence interval for coefficients of these variables does not include zero. This statistical test suggests that these variables have influence on the efficiency score. The CIs for the coefficient of the thickness and LOM include zero value, which indicates that thickness and LOM do not affect the efficiency score.
The major differences between the results presented in Table III and Table IV are in the values of the standard errors. The results in Table III have standard errors obtained from efficiency scores that are dependent on each other, and those in Table IV are obtained from resampling technique that eliminates dependence among the efficiency scores.
In addition, it is observed that the results from both ordinary regression and bootstrap regression are not sufficiently conclusive to confirm that the selected non-discretionary variables for illustration do affect the efficiency score of a surface coal mine. More data and more variables can help to draw conclusions and identify extra non-discretionary variables that influence the efficiency of surface coal mines. For example, the ordinary linear regression indicates that the thickness of the coal seam has an influence on the efficiency score, while the regression for the bootstrap (resampling) technique indicates that the thickness does not influence the efficiency score. This apparent contradiction can be clarified by including more observations in the study.
Conclusions
Determining the relative efficiency of a surface coal mine helps management to identify inefficient mines and select the optimal level of the variables that can be used in order to improve the company's efficiency and thus its competitiveness. It can help the mine to determine the effective cost of achieving the desired outputs.
At any given producer, the relative technical efficiency of the mine can be determined by comparing it with the best-practice mines. New mines can also determine their position or can choose the best discretionary variables to help them to increase their competitiveness in the market.
This study suggests that future research should be focused on creating models to predict the efficiency of new surface mines, taking into account both the discretionary and non-discretionary variables from the results of the efficiency score. This would help new mines to evaluate their operational variables before spending more capital, making them competitive in any given business environment.
References
Chen, Y., Cook, W. D., Li, N., and Zhu, J. 2009. Additive efficiency decomposition in two-stage DEA. European Journal of Operational Research, vol. 196, no. 3. pp. 1170-1176. [ Links ]
Cook, W.D., Zhu, J., Bi, G., and Yang, F. 2010. Network DEA: additive efficiency decomposition. European Journal of Operational Research, vol. 207, no. 2. pp. 1122-1129. [ Links ]
Cooper, W., Seiford, L., and Tone, K. 2007. Data Envelopment Analysis: A Comprehensive Text with Models, Applications, References and DEA- solver Software. 2nd edn. John Wiley & Sons. p. 2. [ Links ]
Emmanuel, T. 2011. Alternative methods for measuring efficiency and an application of DEA in education. Aston Business School. http://www.slideserve.com/lotus/alternative-methods-for-measuring-efficiency-and-an-application-of-dea-in-education [Accessed 15 August. [ Links ] 2013].
Fang, H., Wu, J., and Zeng, C. 2009. Comparative study on efficiency performance of listed coal mining companies in China and the US. Energy Policy, vol. 37, no. 12. pp. 5140-5148. [ Links ]
Höök, M., Zittel, W., Schindler, J., and Aleklett, K. 2010. Global coal production outlooks based on a logistic model. Fuel, vol. 89, no. 11. pp. 3546-3558. [ Links ]
IEA. 2011. Medium-Term Coal Market Report, 2011. http://www.iea.org/topics/coal/publications/ [Accessed 26 July 2013]. [ Links ] p. 52.
Joubert, J. 2010. Data envelopment analysis: an overview. Working paper 14. Optimisation Group, Industrial and Systems Engineering, University of Pretoria. [ Links ]
Kalvelagen, E. 2007. A linear regression solver for GAMS. Amsterdam Optimization Modeling Group, Washington, DC. http://amsterdamoptimization.com/pdf/regression.pdf [ Links ]
Kalvelagen, E. 2002. Efficiently solving DEA models with GAMS. GAMS Development Corporation, Washington DC. [ Links ]
Kulshreshtha, M. and Parikh, J.K. 2002. Study of efficiency and productivity-growth in opencast and underground coal mining in India: a DEA analysis. Energy Economics, vol. 24, no. 5. pp. 439-453. [ Links ]
Kumar, S. and Gulati, R. 2008. An examination of technical, pure technical, and scale efficiencies in Indian public sector banks using data envelopment analysis. Eurasian Journal of Business and Economics, vol. 1, no. 2. pp. 33-69. [ Links ]
Li, Y., Chen, Y., Liang, L., and Xie, J. 2012. DEA models for extended two-stage network structures. Omega, vol. 40, no. 5. pp. 611-618. [ Links ]
Markovits-Somogyi, R. 2012. Complex technological and economic efficiency assessment methods in freight transport and logistics with special emphasis on data envelopment analysis. PhD thesis, Budapest University of Technology and Economics. [ Links ]
MartiC, M., NovakoviC, M., and Baggia, A. 2009. Data envelopment analysis - basic models and their utilization. Organizacja, vol. 42, no. 2. pp. 37-43. [ Links ]
Shafiee, S., Nehring, M., and Topal, E. 2009. Estimating average total cost of open pit coal mines in Australia, 2009. Australian Mining Technology Conference, Brisbane, 27 October 2009. Australasian Institute of Mining and Metallurgy, Melbourne. [ Links ]
Shafiee, S. and Topal, E. 2012. New approach for estimating total mining costs in surface coal mines. Mining Technology, vol. 121, no. 3. pp. 109-116. [ Links ]
Schernikau, L. 2010. Economics of the International Coal Trade. Springer, London. [ Links ]
Shu-Ming, W. 2011. Evaluation of safety input-output efficiency of coal mine based on dea model. Procedia Engineering, vol. 26. pp. 2270-2277. [ Links ]
Talluri, S. 2000. Data envelopment analysis: models and extensions. Decision Line, vol. 31, no. 3. pp. 8-11. [ Links ]
Tong, L. and jia Ding, R. 2008. Efficiency assessment of coal mine safety input by data envelopment analysis. Journal of China University of Mining and Technology, vol. 18, no. 1. pp. 88-92. [ Links ]
Xue, M. and Harker, P.T. 1999. Overcoming the inherent dependency of DEA efficiency scores: a bootstrap approach. Unpublished working paper, Wharton Financial Institutions Center, University of Pennsylvania. [ Links ]

