


Servicios Personalizados
Articulo
 Inglés (pdf)
 Articulo en XML
 Referencias del artículo
Indicadores

Links relacionados
-
 Citado por Google
 -
 Similares en Google
Compartir

 Permalink
Journal of the Southern African Institute of Mining and Metallurgy
versión On-line ISSN 2411-9717
versión impresa ISSN 2225-6253
J. S. Afr. Inst. Min. Metall. vol.114 no.10 Johannesburg oct. 2014
GENERAL PAPERS
Design and positive financial impact of crush pillars on mechanized deep-level mining at South Deep Gold Mine
B.P. WatsonI; W. PretoriusI; P. MpunziII; M. du PlooyI; K. MatthysenI; J.S. KuijpersIII
IGold Fields Ltd
IISRK Consulting (South Africa) (Pty) Ltd
IIICentre for Mining Innovation CSIR
SYNOPSIS
Crush pillars have been incorporated into a mechanized, low-profile trackless system at South Deep Gold Mine. These pillars had to be designed to fail near the face and to ensure that pillar failure is contained within the pillar, to avoid bursting and the risk of high loads being generated during a seismic event, respectively. PoweRite backfill bags were recommended to maintain the integrity of the pillars; except in the main access drives, where the sidewalls were to be supported on 5.6 mm diameter weldmesh and yielding anchors. The results of a trial site investigation exceeded expectations, showing a residual pillar strength of about 37 MPa for a newly formed pillar and 8 MPa for a pillar subjected to seismicity and a closure of more than 300 mm. The introduction of these pillars has improved the rock mass conditions because of the active nature of the support, compared to the previous passive backfill method. Importantly, the pillars have increased mining efficiencies and improved face availability. A potential cost saving to the mine of R140.9 million could be realized over a period of 10 years.
Keywords: crush pillars, de-stress mining, backfill.
Introduction
Crush pillars were introduced to the destress stopes of South Deep Gold Mine (South Deep) to improve efficiencies and face availability. The behaviour of crush pillars has been studied previously on the platinum mines (Watson, 2010), and the findings were adapted to the different environment at South Deep. One of the most significant environmental differences was the larger closure rate with occasional rapid loading, typical of a deep mining environment. The quartzite rocks of the Witwatersrand gold mines are also more brittle than rocks of the platinum mines, which needed to be incorporated in the design philosophy. This paper describes the design methodology as well as measurements conducted to verify the design. Finally, the results from a trial site are described.
The old and new mining methods are compared to provide the reader with a sense of the positive financial impact that the pillars can have on the mine.
Description of the mine
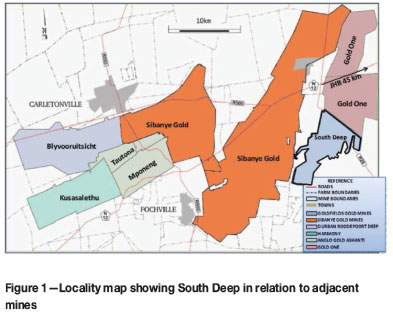
South Deep is a mechanized mine, extracting a wide reef at depth. Such deep-level, wide reefs have not been mined elsewhere in the world and the production layouts developed at the mine are therefore unique. South Deep is situated approximately 45 km west of Johannesburg and 20 km south of Randfontein in the West Witwatersrand mining region (Figure 1). The entire mining area covers 4 232 ha and extends for 9.5 km north-south and 4.5 km east-west at its widest points.
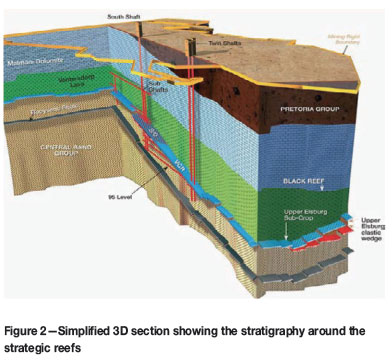
The South Deep orebody lies within the Central Rand Group of the Witwatersrand Supergroup and is overlain by the Ventersdorp lavas (Figure 2). The Ventersdorp Contact Reef (VCR) and Upper Elsburg reefs are of economic importance.
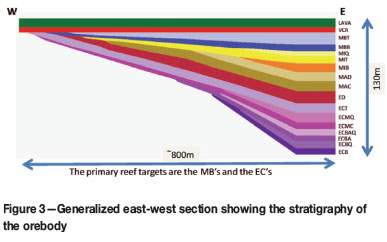
The Upper Elsburg reefs subcrop against the base of the VCR, which is a major stratigraphic unconformity (Figure 3). Towards the east the orebody diverges and thickens up to about 130 m at the eastern extremity of the mine boundary, with an increasing percentage of unpay quartzite middlings in the thicker regions. The dip and strike of the orebody vary across the mine, but it generally dips to the south at between 10° and 14°. This dip angle is too steep for normal mechanized equipment.
The orebody is currently being mined at depths of between 2500 m and 2700 m, and future mining is planned at 3400 m below surface. The virgin vertical stress is high and will become higher as the depth of the overburden increases.
Most of the conglomerate layers within the Upper Elsburgs are extremely strong, brittle rocks. In high-stress environments, these rocks store strain energy that can be released violently in the form of rockbursts. Experience has shown that the higher the walls of an excavation, the greater the tendency for buckling and violent failure.
Destressing philosophy
It was found that a narrow tabular cut could sufficiently destress the orebody to allow normal massive mining techniques to be conducted above and below the cut. This narrow cut was backfilled in the past to limit bedding separation in the hangingwall and to restrict rockburst damage, due to its stiffness, areal support, and energy absorption capacity. The new concept involves a combination of crush pillars and backfill to achieve the same objectives.
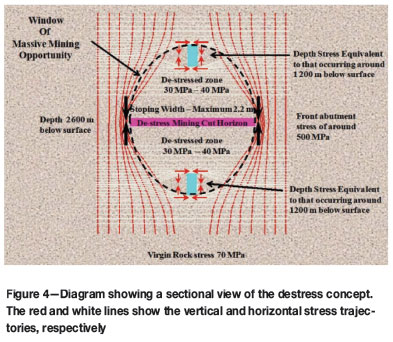
Early elastic numerical modelling work (Smallbone, James, and Isaac, 1993) indicated that an optimum conventional destressing cut could be achieved with backfill in a stoping width of 1.5 m to 2.0 m. The panels in the destress cut could generally be kept below the mining industry's accepted average energy release rate (ERR) criterion of 30 MJ/m2 (Jager and Ryder, 1999) if the span was limited to 250 m, by appropriately spaced stability pillars (Joughin and Pethö, 2007). It was shown that the destress mining could 'cheat' gravity by reducing the major stress component from around 70 MPa to about 30 MPa in the shadow area of the destress stope (Figure 4). The stress conditions in the area marked as the 'window of massive mining opportunity', in the figure is similar to what could be expected at a depth of 1 200 m. The major stress is horizontal in this scenario.
Simple elastic modelling showed that the vertical stress could be reduced to between 10 MPa and 20 MPa for a distance of 30 m above and below the stope. At a middling distance of 60 m, this stress increased to about 30 MPa. The horizontal stress in the north-south direction was shown to be the highest, increasing from 20 MPa near the destress stope to 50 MPa at 50 m above and below this horizon. The virgin stress tensor used in the modelling was determined from stress measurements using CSIR cells, carried out at a depth of 2 650 m below surface (Smallbone, James, and Isaac, 1993).
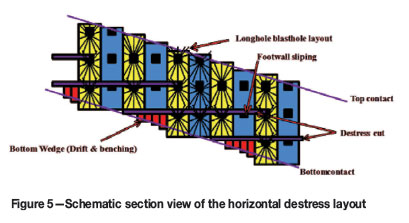
The horizontal mechanized method of mining that is employed at the mine was developed at South Deep. It involves layered horizontal destress cuts that overlap and destress the large orebody target horizons (Figure 5). Access to the destress cut is through a spiral decline, which is optimally sited beneath a previously mined destressed area. Access drives are developed horizontally from the spiral decline to each horizontal destress horizon. Each horizon is mined as a series of 5.0 m wide by 2.2 m high drives, which need to be sequenced optimally to mitigate rockburst and stress damage. This destress cut is subsequently integrated with the longhole stoping by utilizing the destress cut drives as longhole drives (Figure 5). To achieve this objective, the dimensions of the destress drives are increased to 5 m x 5 m behind the destress face by sliping the footwall. This layout allows for selective mining in the massives, where there may be sub-economic quartzite middlings.
The layout of the current destress mining cut is shown in Figure 6. Main access drives (MADs) are generally developed in the dip direction. Stope drives (SDs) are mined adjacent to the MADs in a staggered configuration to maintain industry-acceptable lead-lag distances (Jager and Ryder, 1999). Stope access drives (SADs) are created every 15 m by cutting 5 m holings through the crush pillars at appropriate locations. This ensures that cross-fracturing is avoided in the SAD hangingwall. Separate cuts are spaced about 17 m vertically, dictated by the average width of the target grade.
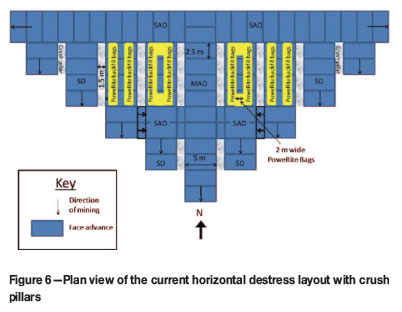
Backfill bags from Reatile TimRite (PoweRite bags) are installed along the edge of the crush pillars to provide confinement to the pillars and to stop pillar disintegration at large closures. The sidewalls of the MAD are supported on 5.6 mm diameter weldmesh and yielding tendons.
Original destress method
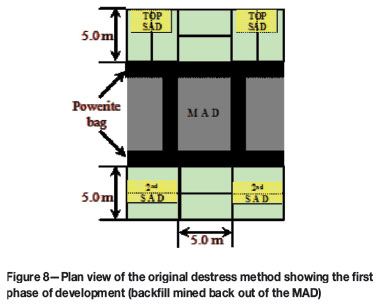
In the past, a typical mining sequence would start by advancing the MAD by 15 m and the first SAD (TOP SAD) by 5 m on either side of the MAD (Figure 7). The first 10 m of the MAD would subsequently be backfilled, before the SDs on either side of the MAD could be developed. The SDs would then be backfilled as indicated in Figure 8 and the backfill in the MAD mined out. The process described above would be repeated every time the MAD was advanced, and an SD could be mined only after the adjacent SD or MAD was backfilled (Figurs 9).
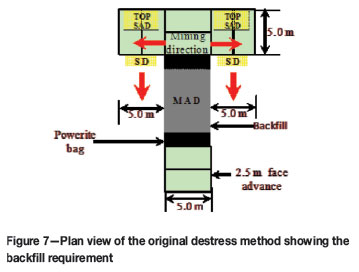
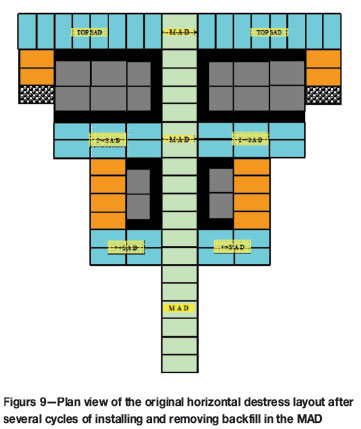
PoweRite bags were used as bulkheads and to ensure tight filling adjacent to the MAD. However, the backfill behind the bags was rarely tight-filled due to the horizontal inclination of the excavation.
The new layout involves the use of crush pillars with PoweRite bags, as shown in Figure 6.
Advantages of the crush pillar
The destress layout with crush pillars is depicted in Figure 6. The pillars allow mining to take place in the adjacent SDs without first having to backfill the previously mined excavation. The implications are:
► No backfill required in the MAD, improving mining efficiencies
► Face availability is improved because SDs can be mined at an earlier stage in the process
► Reduced backfill dilution during longhole stoping.
In addition, the crush pillars are an active support and inhibit hangingwall unravelling, which is often observed where the reef is replaced by backfill. If properly designed, these pillars do not create additional fractures in the hangingwall and overall stability is improved. Subsequent to the destressing process, the crush pillars will be mined out with the longhole stopes. Therefore, the extraction efficiency is not affected by leaving crush pillars.
Method comparison
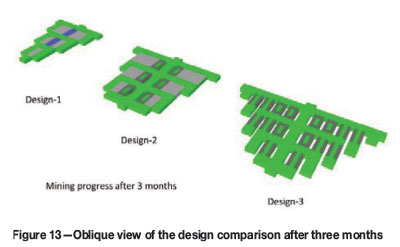
Three design options were compared to determine the financial impact of crush pillars at South Deep (Figure 10). These options are described as:
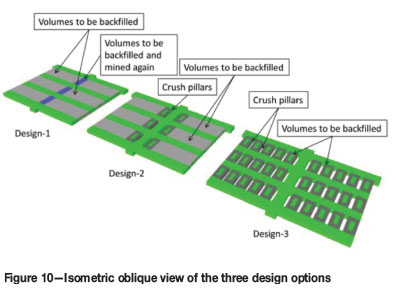
► The original design - MADs that are initially mined, backfilled, and mined out a second time (backfill mined out) once the neighbouring SDs are mined and backfilled (Design 1)
► Crush pillars on the MADs only - here, time is saved as the MADs do not require re-mining (Design 2)
► Total crush pillar design - all MADs and neighbouring SDs are separated by crush pillars (Design 3).
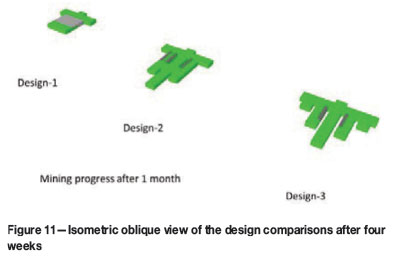
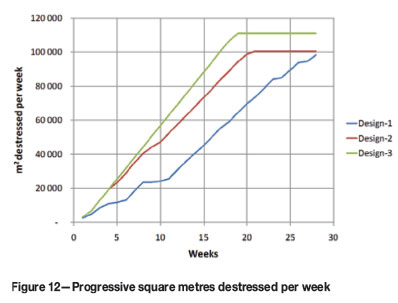
After four weeks, Design 3 achieves 44% more square metres than Design 1 (Figure 11). During this stage, Design 1 and Design 2 achieve similar square metres, as Design 2 is not constrained by backfill yet. The variance between Design 3 and Design 1 increases until week 19, when the difference is 59% (Figure 12). A comparison of the three designs after a period of three months is provided in Figure 13.
While destress mining alone controls how much of the reserves are prepared (destressed) for stoping, other components such as capital infrastructure to supply air and rock-handling capabilities all combine to form a plan. This plan dictates the steady-state volumes that can be handled.
In the above case study, Design 1, Design 2, and Design 3 reach steady states by weeks 29, 21, and 19, respectively (Figure 12). The effect of the 'free square metres' from the crush pillars in Design 3 can be seen in the difference between steady-state production outputs. The average effective square metres achieved in Design 3 is 18% greater at steady state than for the other two designs.
Financial impact of crush pillars
Savings associated with the crush pillar design can be separated into three components:
► Reduction in backfill requirement
► Reduced destress mining
► Productivity improvements.
The requirement for backfill is reduced in two areas:
a) In the establishment of a new destress cut, all MADs had to be filled and subsequently mined again due to a mining span constraint. With the advent of the crush pillar method this is no longer a requirement. The savings associated with this activity reduce the amount of backfill placed in the destress mining by 4.3% or 62 400 m3 in 10 years at a cost of R299 per square metre.* This saves R18.7 million over the next 10 years (Table I)
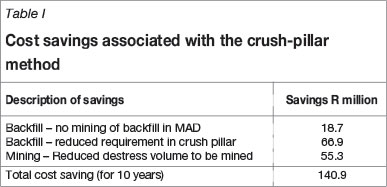
b) Less backfill is required as the crush pillar volume is no longer backfilled. This reduces the area to be filled by 15.4% at a saving of R66.9 million for the next 10 years (Table II).
There is a reduction in the planned low-profile mining of 15.4% (crush pillar area). This reduces the destress mining requirement by 90 100 t or R55.3 million at R614 per ton* over a 10-year period (Table I).
Productivity is improved through the increased speed at which a new destress cut is established through the reduced volume of mining required.
Backfill adds approximately 18% to the direct cost of mining the destress. The total cost savings in backfill of 23% in the destress reduces the total direct cost of mining the destress (including backfill) by 3.5% (from R725 per ton to R699 per ton).
Crush pillar design considerations
The main objective of crush pillar design was to ensure that the residual strength of the crush pillars is sufficient to maintain hangingwall stability, and limit the demand on the tendon support. Pillar size was therefore designed with the residual strength in mind. However, pillar bursts show that the peak strength and loading environment also need to be considered in the design. Larger pillars have a higher peak strength. Therefore, a pillar that is cut too large is likely to fail violently in the back areas where the loading environment is soft. In addition, dynamic loading during seismic events is an important consideration in the deep-level gold mining environment. Fracturing should therefore be contained within the pillar so that high load-generation and hangingwall deterioration is avoided during such an event. The investigations to determine a suitable pillar size included back-analyses, numerical modelling, and underground instrumentation.
Stable crush pillar loading environment
An opportunity to determine a limit on loading stiffness was provided when the width of a pillar/peninsular between two destress panels was inadvertently reduced. Violent failure occurred when a 2.2 m high face was advanced towards the north (Figure 14), reducing the pillar to a width of 5 m and length of 6 m. The incident was modelled using MAP3D (map3D.com, 2013) to determine the loading stiffness of the strata when the violent failure occurred. The results of the investigation are compared to a more comprehensive investigation performed on the platinum mines (Watson, Kuijpers, and Stacey, 2010) in Figure 15. In both instances (platinum mines and South Deep), the laboratory-determined elastic constants of the hangingwall and footwall rock types were used in the numerical analysis. In the case of the South Deep model, the Young's Modulus and Poisson's Ratio were 70 GPa and 0.25 respectively.
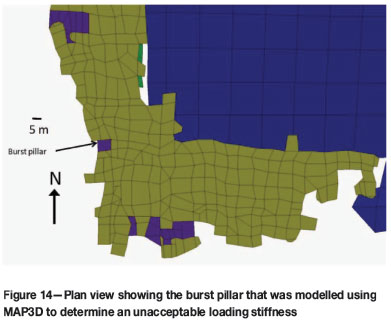
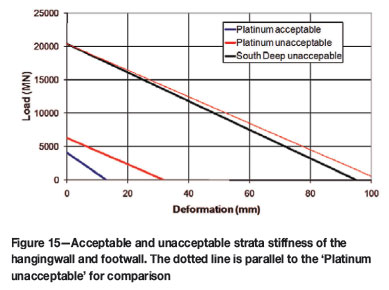
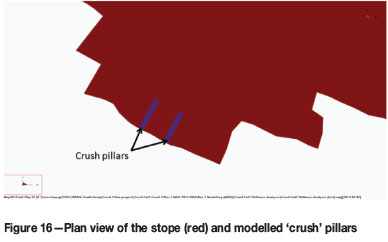
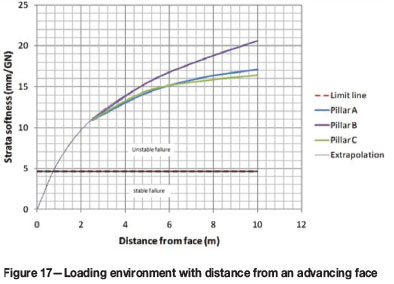
The unacceptable strata stiffness for the platinum mines was determined from extensive underground measurements, which are described by Watson (2010). The black loading line (Figure 15) describes the unacceptable stiffness for South Deep, which was determined from the single pillar burst shown in Figure 14; where the pillar dimensions and face positions were reliably determined. The softness of the loading strata at South Deep was calculated to be about 4.7 mm/GN. This unloading environment is slightly stiffer than the critical 5.0 mm/GN limit for the platinum mines. The investigation suggests that the more brittle conglomerate pillars at South Deep may require a slightly stiffer loading environment, for stable failure, than the platinum mines. A numerical sensitivity analysis on pillars cut in a typical stope configuration (Figure 16), using the same elastic constants as the South Deep line in Figure 15, suggests that stable pillar failure can occur only very near, or at, the face (Figure 17). The residual strengths of the surrounding crush pillars were assumed to be zero in the model.
Material strength
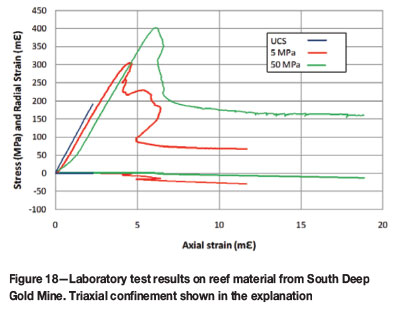
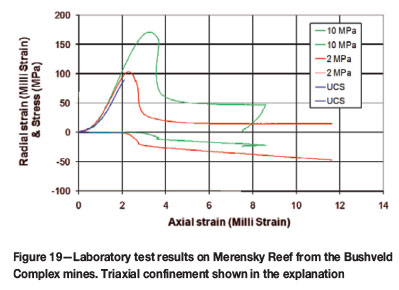
Uniaxial and triaxial compressive strength tests (UCS and TCS) were conducted on the reef material at the trial site. A representative example of the results is shown in Figure 18. The stress-strain curves are typical of Witwatersrand quartzites, with little nonlinear behaviour and sudden failure which is characteristic of brittle rocks. The triaxial post-failure results, in the same figure, confirm the brittle nature. A typical set of Merensky Reef test results is shown for comparison in Figure 19. In this figure the post-failure results of the triaxial tests indicate a comparatively more ductile material. The differences in behaviour and strength show that the work done previously on the Merensky crush pillars (Watson, 2010) cannot be directly applied to South Deep. Further research was necessary.
Pillar behaviour
The crush pillars at South Deep are 10 m long, 1.5 m wide, and 2.2 m high. Although these pillars are not truly 2D, the 'perimeter rule' (Equation [1]), described by Wagner (1974), may be used to compensate for pillars with finite length. The equation suggests that the pillars at South Deep have an effective width (we) that is only about 10% less than a full 2D model.

Equation [1] accounts for square and rectangular pillars by taking cognisance of pillar length (L). In essence, the equation compensates for the effects of the fracture zone around a pillar.
A series of 2D plane strain FLAC (Itasca Consulting Group, Inc., 1993) models were constructed to investigate pillar behaviour in the context of a realistic loading environment. This environment included the pillar foundations that could sustain damage. For the purposes of the model, the foundation material properties were assumed to be the same as the pillar, which was a reasonable approximation for all the instrumented pillars. The model included the pillar itself and the immediate hangingwall and footwall.
One important parameter that needed to be considered for pillar behaviour was material brittleness. In the models, brittleness is defined as the rate of stress decrease after failure. In these models, post-failure behaviour is controlled by cohesion loss. Therefore, a direct relation between cohesion softening (strain softening) and material brittleness can be quantified. The internal friction angle and the dilation angle were not varied so as to avoid additional complications.
Figure 20 shows the Mohr-Coulomb parameters that were used in the models. These parameters were calibrated from underground measurements of pillar stress and strain in the platinum mines (Watson, Kuijpers, and Stacey, 2010). Unfortunately, such measurements were not available for the South Deep pillars.

Boundary conditions play an important role in the failure mechanism, as they affect horizontal confinement. In the models (Figure 21), the vertical boundaries were not allowed to move in a horizontal direction (thus simulating a fully replicated set of pillars). The presence of discontinuities such as bedding planes, faults, and joints should also affect failure, but this was not investigated in the models.
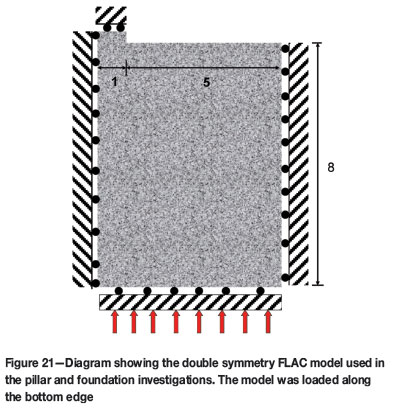
The models were used to evaluate the effect of pillar width on strength. Stope span was about five times the pillar width in the model (extraction ratio approx. 83%), and the model height was more than eight times the pillar width. The model results for the Merensky Reef material (Figure 22) (Watson, Kuijpers, and Stacey, 2010) compared favourably to the peak pillar strength formula determined for Merensky pillars (Watson et al., 2008).
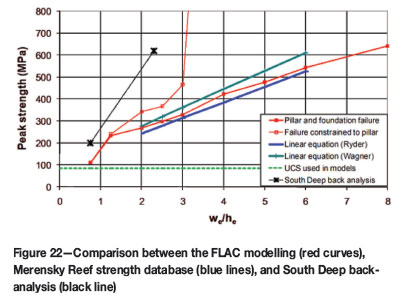
The numerical modelling showed that very little pillar strengthening occurs below a width to height (w/h) ratio of 0.75. In addition, pillar punching and foundation failure is likely to initiate only at a w/h ratio of about 1.25 for Merensky Reef pillars. Generally, the larger crush pillars on the platinum mines do not fail throughout, but the centres of these pillars punch into the surrounding strata. In essence, the system fails as shown in Figure 22.
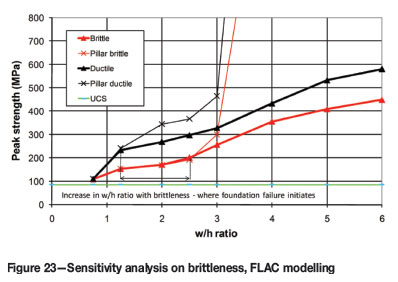
Pillars at South deep are more likely to follow a more brittle profile (as discussed previously). A subsequent sensitivity analysis on brittleness showed that the w/h ratio at which punching initiates increases with brittleness (Figure 23). Thus failure would be safely contained within a pillar if w/h ratios were kept below 1.25. To ensure that the pillars did not develop solid centres, a w/h ratio range between 0.68 and 0.91 was recommended for these pillars. Figure 22 suggests that pillars with w/h ratios in this range would have a strength in line with the material UCS, i.e. approximately 200 MPa. Numerical modelling showed that there would be sufficient stress to ensure failure/crushing at the face, even at relatively small spans, at the recommended w/h ratios.
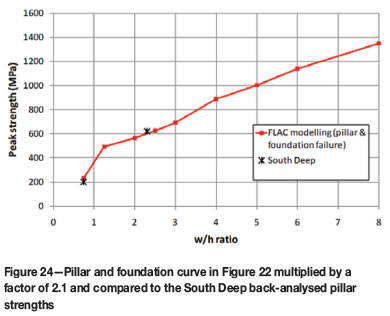
The pillar used in the South Deep strength back-analysis (Figure 14) had a w/h ratio of 2.3 and was 2.1 times the strength of a similar Merensky pillar (Figure 22). This ratio corresponds favourably to the UCS strength ratio between the two materials, suggesting a reasonable correlation between the model results and the South Deep pillars. Figure 24 shows the APS values in the pillar and foundation curve in Figure 22, multiplied by a factor of 2.1. The curve provides a probable relationship between peak pillar strength and w/h ratio for the pillars at South Deep.
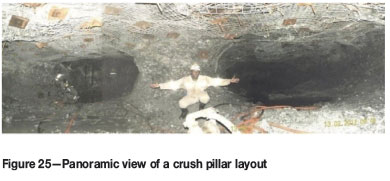
Underground investigations
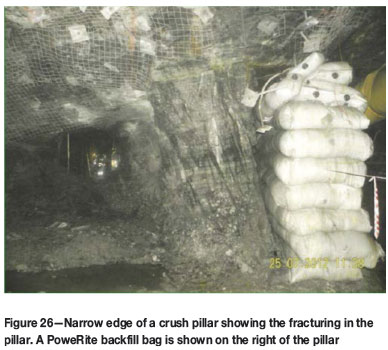
Having established the optimum pillar dimensions, a trial site was created to monitor the pillar behaviour underground (Figure 25). Visual observations formed an important part of the investigations. A section of a pillar was removed to expose the fracturing in the pillar (Figure 26). It was clear that the pillars had failed properly as the fracturing extended throughout. The hangingwalls were also no more severely fractured than where crush pillars were not used. These observations suggested that the foundations were not being damaged by the pillars. No violent pillar failures occurred when the pillars were cut to the stipulated w/h ratios, even though some dynamic closure occurred during seismic events. However, small strain bursts occurred when the pillars were cut at widths in excess of 3 m (w/h of 1.4) and a pillar burst occurred at a w/h ratio of 2.3 (Figure 14).
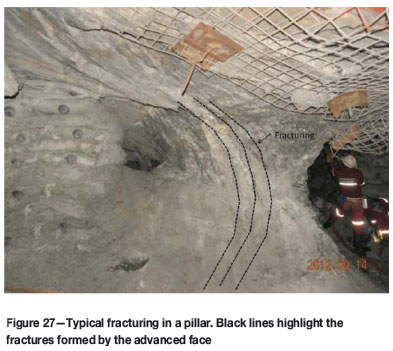
Close examination of fracturing within a properly crushed pillar showed curved fractures extending at least 1 m into the pillar sidewall (Figure 27) on the side of the advanced MAD or SD. These fractures tend to create an hourglass-shape sidewall on that side of the pillar, while the lagging face created a more square sidewall. The implication being that the pillars are failing right at the lagging face, as designed.
The effectiveness of the crush pillar lies in its ability to carry the load required to promote stability and break the span between two adjacent excavations. It was therefore necessary to establish the residual strength of the pillars immediately after formation and after large deformations had taken place. In addition, the effects of dynamic closure that occurs during a seismic event needed to be assessed. Three pillars were selected for stress and closure measurements. Two of these pillars are described in the paper: one newly formed, and one subjected to closure in excess of 300 mm (including dynamic deformation during a seismic event).
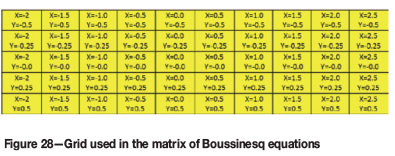
It was necessary to establish an optimum height above the pillars where a point measurement could provide a reasonable estimate of the average pillar stress (APS). In order to determine this optimum height, use has been made of Boussinesq equation ([2]). This equation quantifies the effect of a point load on a free surface (half space). The effect of a pillar, with its particular stress distribution, can be quantified by a number of Boussinesq equations, each representing a specific area of the pillar. Since the application of the Boussinesq equation is restricted to a free surface, care must be taken that neighbouring pillars do not affect the stress levels. This can be achieved by limiting the distance above or below the pillar where stresses are to be evaluated. Numerical modelling has shown that a distance of less than 3 m results in an error of less than 1% for the crush pillar spans that are used at South Deep. Boussinesq equations can thus be used to provide a unique relationship between the APS of a pillar and the stresses measured at a point above or below that pillar.
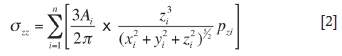
where:
σzz = stress at a point in space
At = area of the grid "i"
pzi = vertical stress carried by the grid "i"
A matrix of Boussinesq equations (Figure 28) was used to evaluate typical stress profiles of solid and failed pillars. The profiles used in the analysis are shown in Figure 29, and the results of the investigation are provided in Figure 30.
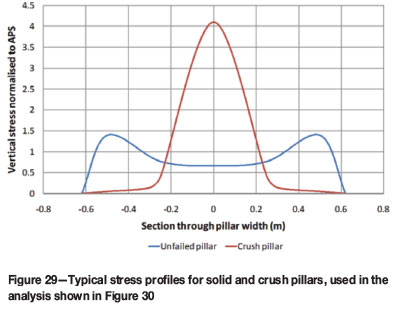
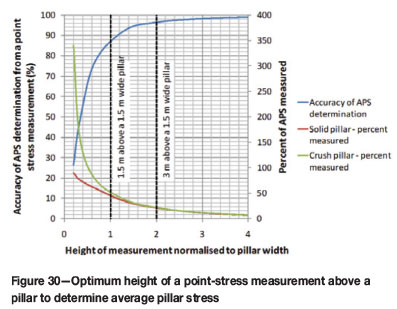
The blue curve in Figure 30 shows that for a 1 m wide pillar and a measurement height of 2 m, the difference in point-stresses between pillars with different 'realistic' stress profiles is negligible. However, the red and green curves suggest that at the same height only about 20% of the APS could be measured. It was also established that the optimum measurement height varies proportionately with the width of the pillar. A good compromise between a reasonably large measurement and an inordinate error resulting from an unknown stress profile for a 1.5 m wide pillar is probably between heights of 1.5 m (1.0 in Figure 30) and 3 m (2.0 in Figure 30).
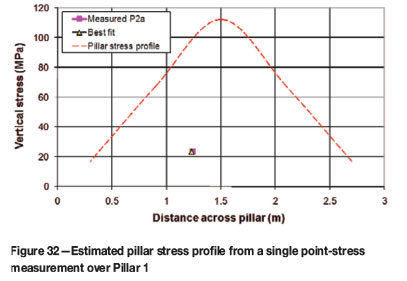
The first residual measurement was made at 2.71 m above a 2.5 m to 3.0 m wide and 5.7 m long pillar (Figure 31). This pillar had been newly formed with minimal closure at the time of the measurements; and the face position was about 10 m from the pillar. The analysis in Figure 30 suggested an 11% error in the residual strength evaluations, but the point stress would be about 50% of the APS if the cell was installed exactly over the centre of the pillar. However, the actual position was off-centre and required a dedicated matrix of Boussinesq equations to calculate the residual strength.

The stress profile of the pillar in Figure 31 was estimated from the single point-stress measurement, using a similar matrix to Figure 28 and Equation [2]. Since there was only one reliable measurement, a trial-and-error approach was applied to likely stress profiles, until the measured stress level was simulated. The residual strength of Pillar 1 was calculated from the stress profile in Figure 32 to be about 37 MPa.
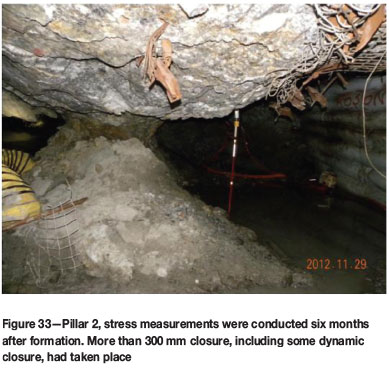
The second pillar was between 1.4 m and 2 m wide and 7.9 m long (Figure 33). Stress measurements were conducted more than six months after pillar formation and more than 300 mm closure had taken place. Some of the above closure was recorded during a nearby seismic event. The residual strength of the pillar was determined to be about 8 MPa, from a point measurement made at 2.5 m above the pillar.
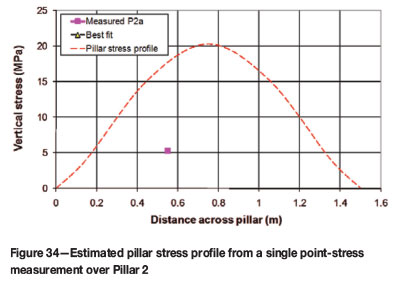
A stress profile was estimated for Pillar 2 using a similar approach to that used for Pillar 1. The profile is shown in Figure 34.
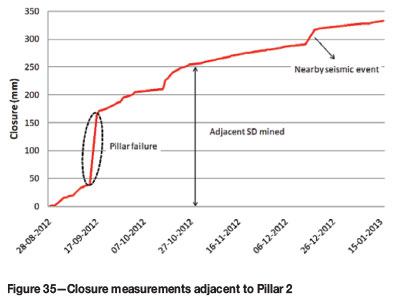
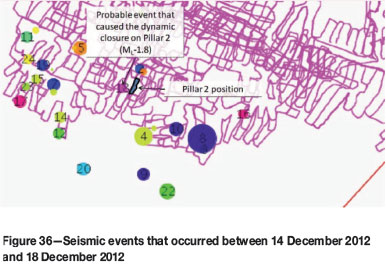
Closure measurements were made adjacent to Pillar 2 in the MAD and SD. Unfortunately, the MAD was required for production and only the first part of the closure curve shown in Figure 35 was monitored here. A cubby was created adjacent to the pillar, i.e. the backfill was mined out, to allow the remaining measurements. It should be noted that the measurements shown in the graph may be slightly overstated because the backfill, normally adjacent to the crush pillars, was not present to carry some of the load or to confine the pillar. The pillar failure/crushing period can clearly be seen in the data measured from the MAD. In addition, a nearby event caused about 26 mm 'dynamic' closure on the pillar. The location of the event that is most likely to have caused this dynamic closure is shown in Figure 36.
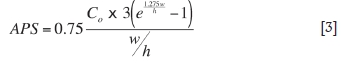
Analytical solution for residual strength
A relatively complicated analytical solution was derived by Salamon (Ryder and Jager, 2002) to describe the stress distribution in a plastic pillar, based on a simple limit equilibrium model. Equation [3] provides a relationship between APS and w/h ratio, assuming a friction angle of 30°. (The equation applies to the stress values across the centre of the pillar.) A reasonable correlation between the measured residual strength of Pillar 2 and the equation was obtained if a cohesion of 1.6 MPa was assumed for the failed pillar material (Figure 37). A similar high cohesion was suggested by the research conducted on Merensky crush pillars (Watson, Kuijpers, and Stacey, 2010). The high residual strength measured over Pillar 1 was probably because the small closure had not caused the pillar to reach its final residual strength at the time of the measurement.
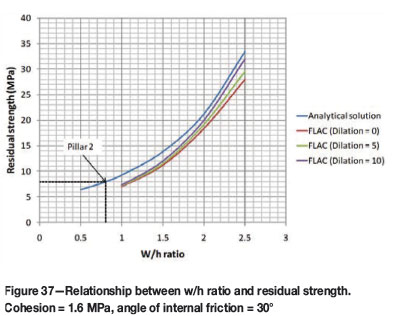
A series of FLAC models were run to substantiate the analytical solution results. Several curves with different dilation angles were modelled, and the results are provided in Figure 37 for comparison. The figure shows a reasonable correlation between the underground measurements (Pillar 2), analytical solution, and the FLAC models.
Previous investigations using FLAC models and underground measurements on the platinum mines (Watson, Kuijpers, and Stacey, 2010) showed little increase in residual strength above a w/h ratio of about 2.5. This is apparently due to the degree of foundation fracturing that occurs above this w/h ratio during pillar failure.
The residual strength estimate from Equation [3] and Figure 37 will need to be downrated slightly to account for its finite length.
Discussion
The use of crush pillars in a brittle quartzite environment requires disciplined mining. There is little tolerance for offline mining, and pillars cut too wide are risky, with a propensity for bursting. However, if cut properly, the pillars effectively break the span between individual SDs and between the MAD and SDs. This allows for more efficient mining since backfill does not need to be re-handled and faces become available quicker than with the previous mining method.
Conclusions
The measurements and visual observations show that the crush pillars at South Deep Gold Mine were properly designed. Their residual strength and behaviour has exceeded expectations, both under quasi-static and dynamic loading conditions. The concept has the potential to improve mining efficiencies in the destress stopes significantly. In addition, the establishment of a new stope is much faster than previously accomplished. Potentially the system could save the mine R140.9 million over a 10-year period, without considering the quicker build-up value.
Crush pillars have improved hangingwall conditions because full relaxation of the strata does not take place over the pillars, as in the backfill paddocks. In addition, distances between pillars are limited to the cut-span, without the larger spans that develop in backfilled areas due to poor filling practice.
The only disadvantage of the crush pillar system is that disciplined mining is essential. There is little tolerance for off-line mining, and pillar bursting is a threat if pillars are cut too large.
Subsequent to the investigations described in this paper, crush pillars have been rolled out across the mine.
Acknowledgements
Gold Fields is acknowledged for facilitating the success of the research work described in this paper. In particular, the management of South Deep are thanked for their assistance.
References
Itasca Consulting Group, Inc. 1993. Fast Lagrangian Analysis of Continua (FLAC), Vers. 3.2. Minneapolis Minnesota USA. [ Links ]
Jager, A.J. and Ryder, J.A. 1999. A Handbook on Rock Engineering Practice for Tabular Hard Rock Mines. Safety in Mines Research Advisory Committee (SIMRAC), Johannesburg, South Africa. [ Links ]
Joughin, W.C. and Pethö, S.Z. 2007. South Deep regional pillar modelling Part I - Design of regional pillars at South Deep Gold Mine. Challenges in Deep and High Stress Mining. Potvin, Y., Hadjigeorgiou, J., and Stacey, T.R (eds). Australian Centre for Geomechanics, Perth, Western Australia. [ Links ]
MAP3D. 2013. www.map3D.com. [ Links ]
Ryder, J.A. and Jager, A.J. 2002. A Textbook on Rock Mechanics for Tabular Hard Rock Mines, Safety in Mines Research Advisory Committee (SIMRAC), Johannesburg, South Africa. pp. 174-278. [ Links ]
Smallbone, P.R., James, J.V., and Isaac, A.K. 1993. In situ stress measurements and use in the design of a deep gold mine. Innovative Mine Design for the 21st century. Bawden, W.F. and Archibald, J.F. (eds.). AA Balkema, Rotterdam. [ Links ]
Wagner, H. 1974. Determination of the complete load-deformation characteristics of coal pillars. Proceedings of the 3rd International Congress on Rock Mechanics, ISRM, Denver. vol. 2B. pp 1076-1082. [ Links ]
Watson, B.P. 2010. Rock behaviour of the Bushveld Merensky Reef and the design of crush pillars. PhD thesis, School of Mining Engineering, University of Witwatersrand, Johannesburg, South Africa. [ Links ]
Watson, B.P., Kuijpers, J.S., and Stacey, T.R. 2010. Design of Merensky Reef crush pillars. Journal of the Southern African Institute of Mining and Metallurgy, vol. 110, no. 10. pp. 581-591. [ Links ]
Watson, B.P., Ryder, J.A., Kataka, M.O., Kuijpers, J.S., and Leteane, F.P. 2008. Merensky pillar strength formulae based on back-analysis of pillar failures at Impala Platinum. Journal of the Southern African Institute of Mining and Metallurgy, vol. 108. pp. 449-461. [ Links ]
* 2014 first Quarter actual costs used in the estimated savings

