


Servicios Personalizados
Articulo
 Inglés (pdf)
 Articulo en XML
 Referencias del artículo
Indicadores

Links relacionados
-
 Citado por Google
 -
 Similares en Google
Compartir

 Permalink
Journal of the Southern African Institute of Mining and Metallurgy
versión On-line ISSN 2411-9717
versión impresa ISSN 2225-6253
J. S. Afr. Inst. Min. Metall. vol.114 no.10 Johannesburg oct. 2014
GENERAL PAPERS
Focal depths of South African earthquakes and mine events
M.B.C. Brandt
Council for Geoscience, Seismology Unit, Pretoria, South Africa
SYNOPSIS
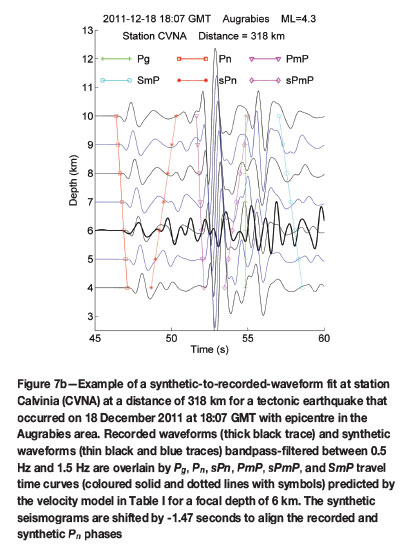
Focal depths of 15 tectonic earthquakes and 9 mine-related events were determined for South Africa using data recorded by the South African National Seismograph Network. These earthquakes and events were relocated by means of the Hypocenter program using direct P-waves (Pg) , critically refracted P-waves (Pn) , and first-arrival S-waves for the magnitude range 3.6 < ML< 4.4. Focal depths were first determined by means of the minimum root mean square (RMS) of the differences between the measured travel times and those predicted using the velocity model. The depths for tectonic earthquakes had a 2 km < D <10 km range and an average depth and standard deviation of 6.9 ± 2.3 km. Depths for mine-related events ranged over 0 km < D < 7 km, averaging 3 ± 2.3 km. Next, arrival times for the additional regional depth phases sPn, PmP, sPmP, and SmP were measured. Focal depths were re-determined for the relocated epicentres, with the minimum variance (i.e. spread) of the differences between the measured travel times and travel times predicted by means of the Wentzel, Kramer, Brillouin, and Jeffreys (WKBJ) method for synthetic waveform modelling. Depth ranges were 4 km < D < 7 km (average 5.9 ± 1.2 km) and 1 km < D < 4 km (average 2.4 ± 1.2 km) for tectonic and mine-related events, respectively. The derived depths were verified for one tectonic earthquake with synthetic-to-recorded-waveform fits using the WKBJ synthetic seismogram software for the abovementioned regional phases. The focal mechanism parameters for this earthquake source were obtained from the National Earthquake Information Centre. Focal depths were estimated for nine stations by visually comparing synthetic waveform phases with recorded waveforms, ranging from 5 km to 8 km.
Keywords: focal depth, earthquake location, regional depth phases, waveform modelling
Introduction
Almost all continental earthquakes are confined to a crustal layer that varies in thickness between 10 km and 40 km, measured from the surface. Hence, continental earthquakes do not occur in the mantle (Maggi et al., 2000). In many stable continental regions, focal depths occur as a bimodal distribution within the upper third (0 km to 10 km) and/or lower third of the crust (20 km to 35 km), while the middle crust (10 km to 20 km) tends to be aseismic (Klose and Seeber, 2007). The distribution can vary in terms of bimodal depth and strength, with some stable continental regions showing very well-developed bimodal distributions (e.g. the North Alpine foreland basin in Europe), while others show only weak or no bimodal distribution (e.g. New Madrid seismic zone in the central USA). Klose and Seeber's study (2007) found that many large earthquakes with magnitudes Mw from 4.5 to 8.0 have a focal depth of less than 5 km, with almost 80% of the seismic moment density of shallow stable continental region ruptures being released in the uppermost 7 km of the crust. It is noteworthy that accurate focal depths have important implications for seismic hazard estimations, specifically in respect of ground motion predictions.
In a previous case study in North America, Ma and Atkinson (2006) found only weak support for a bimodal distribution. For southern Ontario, Canada, and northern New York, USA, focal depths range from 2 km to 15 km. In parts of western Quebec and along the Ottawa River Valley in Ontario, focal depths range from 2 km to 25 km. These authors noted that more than half of the earthquakes, in a cluster of activity near Maniwaki in western Quebec, Canada, are deeper than 20 km. To the author's knowledge, only one such study has been performed for tectonic earthquakes in South Africa: Mangangolo et al. (2014) applied synthetic-to-recorded-waveform fits to data recorded by the stations of the temporary Kaapvaal Craton array. The 50 broadband stations of this array were installed on a 1° x 1° grid at 80 sites in central southern Africa (cf. Nguuri et al., 2001). The study found shallow hypocentres ranging between depths of 5.6 km and 18.6 km, with an error in depth of approximately 3 km.
Focal depth is the most difficult parameter to determine for regional earthquakes and mine-related events when recorded by means of a sparse national seismograph network, unless there are stations very close to the epicentre (e.g. Havskov and Ottemöller, 2010b). This difficulty is attributable to the large epicentral distances (approximately 100 km to 1 000 km) versus the small focal depths (approximately 2 km to 10 km), causing a near-zero change in the observed travel times of direct seismic waves for the different focal depths. The practice of the South African National Seismograph Network is to measure only the first-arrival seismic phases. When locating the events and earthquakes, focal depths are fixed as follows: explosions to 0 km, mine-related events to 2 km, and tectonic earthquakes to either 5 km or 10 km, depending on which of these depths gives the best fit to the travel time data (Saunders et al., 2008). However, by following this procedure it may be surmised that both mine-related events and tectonic earthquakes are shallow and that South African seismicity does not follow the bimodal depth distribution observed in other stable continental regions.
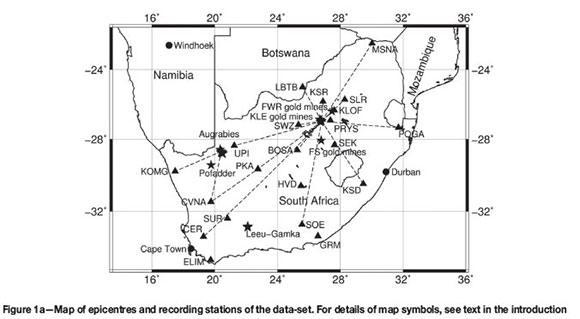
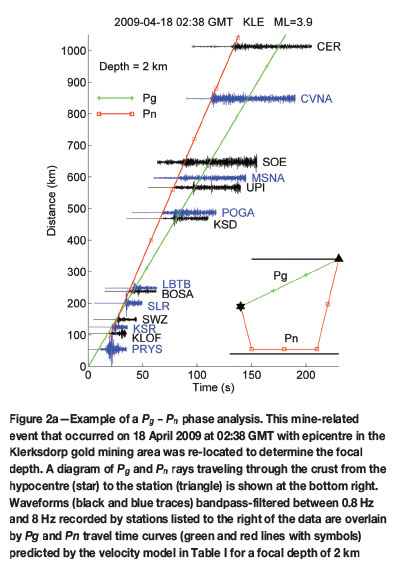
The purpose of this study was to evaluate South African hypocentre depths. Figure 1a summarizes the epicentres and recording stations of the data-set. Focal depths were estimated by stations (triangles with station codes) that recorded waves originating from 15 tectonic earthquakes and 9 mine-related events (stars) with a magnitude range 3.6 < ML< 4.4. Mine-related events were identified from their location within a gold mining area. The focal depth obtained by means of seismic phases that had travelled along ray paths (dashed lines) originating from the mine-related event in the Klerksdorp gold mining area, shown in Figures 2a and 2b, was determined by stations situated at Parys (PRYS), Kloof Mine (KLOOF), Koster (KSR), Schweizer-Reneke (SWZ), Silverton, Tshwane (SLR), Boshof (BOSA), Lobatse, Botswana (LBTB), Kokstad (KSD), Pongola (POGA), Upington (UPI), Mussina (MSNa), Somerset East (SOE), Calvinia (CVNA), and Ceres (CER). The focal depths obtained using waveform modelling for waves that had travelled along ray paths (dashed lines) originating from the tectonic earthquake near Augrabies, shown in Figures 7a and 7b, were determined using stations situated at Komaggas (KOMG) and Calvinia (CVNA). Tectonic epicentres located near Leeu-Gamka, Pofadder, and Augrabies; mine-related events located in the Free State (FS), Klerksdorp (KLE), and Far West Rand (FWR) gold mining areas. Details of the analyses performed in Figures 2a, 2b, 7a, and 7b follow.
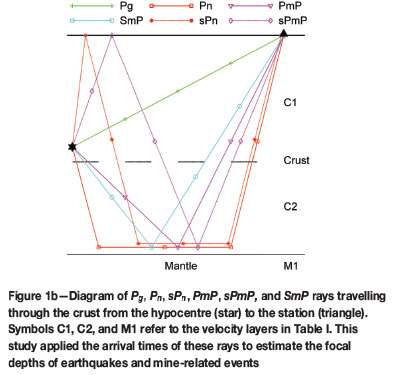
To estimate focal depths of earthquakes and mine-related events, this study applies arrival times for various waves. These include:
► Direct P-waves (Pg)
► Critically refracted P-waves (Pn)
► The ascending S-wave converted at the surface to a critically refracted P-wave (sPn)
► Reflected P-wave at the Moho discontinuity (PmP)
► Ascending S-wave converted at the surface to a reflected P-wave at the Moho discontinuity (sPmP)
► A descending S-wave converted to a P-wave when reflected at the Moho discontinuity (SmP).
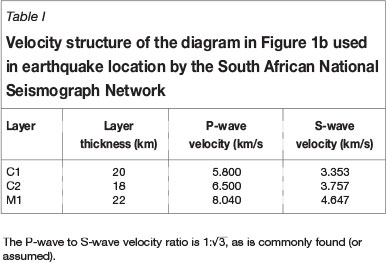
(Figure 1b, with velocity structure in Table I). The author used the SEISAN earthquake analysis software (Havskov and Ottemöller, 2010a) to first pick the arrival times of direct P-waves, critically refracted P-waves, and first-arrival S-waves. The events were re-located using the Hypocenter software (Lienert et al., 1986). Focal depths were determined by means of the root mean square (RMS) of the differences between the measured travel times and those predicted using the velocity model. Next, arrival times for additional regional depth phases sPn , PmP, sPmP, and SmP were measured. Focal depths were re-determined for the re-located epicentres, with the minimum variance (i.e. spread) of the differences between the measured travel times and travel times predicted by means of the synthetic seismogram software introduced by Chapman (1978), which uses the Wentzel, Kramer, Brillouin, and Jeffreys (WKBJ) method. The focal mechanism parameters for one tectonic earthquake source had already been determined by the National Earthquake Information Centre. Hence, the derived depths for this earthquake were verified by means of synthetic-to-recorded-waveform fits using the WKBJ synthetic seismogram software for the abovementioned regional phases.
Method
Re-location
Earthquake location is defined by the hypocentre (x0, y0, zo), with x0 the longitude, y0 the latitude, and z0 the focal depth and origin time t0 (cf. Havskov and Ottemöller, 2010b). To calculate the location, the Hypocenter software applies an iterative method where the location problem is linearized (Lienert et al., 1986). The method is optimized for the best general epicentre, depth, and origin time accuracy. First, a guess is made in respect of the hypocentre (x, y, z) and origin time, t. If this guess is close enough to the true hypocentre, the travel time residuals at the trial hypocentre are a linear function of the correction required in respect of hypocentral distance. Successive iterations converge to the local minimum provided that the problem is well conditioned. The simplest case for earthquake location is a homogeneous medium with direct waves, where the calculated travel times, titra, at the ith station (xi, yi, zi) are (e.g. Havskov and Ottemöller, 2010b):
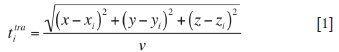
where v is the medium velocity. Partial derivatives for x, y, and z can be estimated from Equation [1] to make the corrections needed during the iterations. If the stations are at the surface (zi = 0), the derivative for depth is:
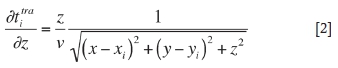
Note that for the sparse national network, z << x-xi and y-yi; hence changes in focal depth lead to a near-zero correction in the travel times.
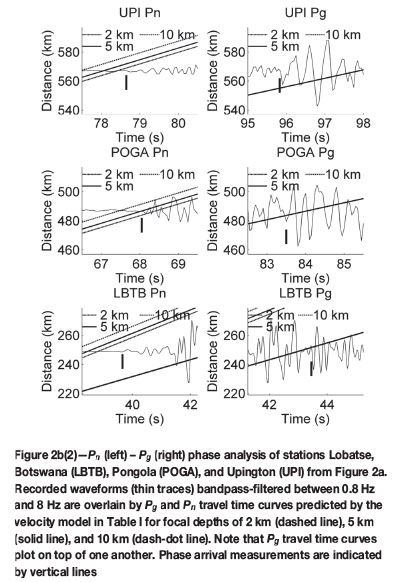
At distances of more than about 90 km, where both direct P-wave, Pg and/or the critically refracted wave, Pn arrive at a station, the location algorithm has some sensitivity to depth owing to the steeply descending Pn rays, although clear Pn phases can usually be identified only at distances of more than about 130 km (Figure 2a). The author re-measured the Pg phase arrival times, added the Pn phase arrival times, and re-located all the earthquakes and events using the Hypocenter software. The crustal velocity model (Table I) was used throughout this study. This model is a simplified version of the structure determined by Wright et al. (2002), who derived a high-quality multi-layer model using the temporary Kaapvaal Craton array. This study (and routine practice with the South African National Seismograph Network) avoids a multi-layered velocity model, specifically at the expected depths of hypocenters between 0 km and 10 km. A multi-layered model results in clustering of focal depths at layer boundaries, which is caused by the discontinuities in the travel-time curves of the direct phase, Pg, as a function of depth at layer boundaries. The Pg travel time suddenly decreases when the hypocentre crosses a boundary (for example, the discontinuity at 20 km depth in Table I) since a larger part of the ray is suddenly in a higher velocity layer, while the Pn travel time continuously decreases as the depth increases (Havskov and Ottemöller, 2010b).
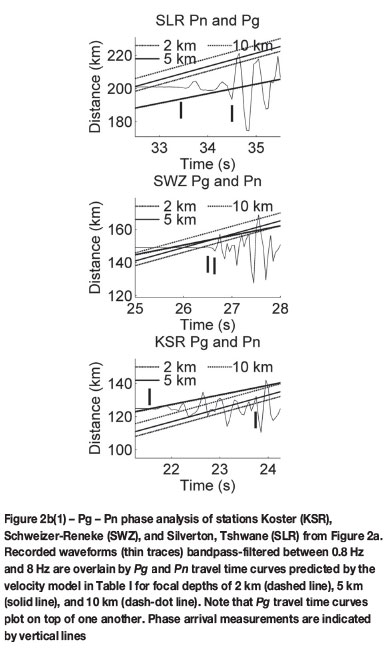
The phase analysis shown in Figure 2b is an example for the signals recorded by selected stations of the South African National Seismograph Network for the mine-related event displayed in Figure 2a. In Figures 2a and 2b(1), the Pn phase overtakes the Pg phase at a distance of approximately 150 km. It is noteworthy that, while the Pn phase arrival times (i.e. travel time curves) are sensitive to the different focal depths of 2 km, 5 km, and 10 km, Pg is insensitive to changes in focal depth at these large hypocentral distances. Focal depth determination depends on accurate Pg and Pn travel times and therefore small uncertainties in the epicentre, origin time, and crustal velocity model may result in inaccurate depth estimates. These inaccuracies show up as misalignments between the phase arrival measurements and travel time curves in Figure 2b. Misalignments are approximately 2 to 10 km and 1/2 to 1 second, which is a typical epicentre and origin time uncertainty for locations determined by means of the South African National Seismograph Network. To ensure a reliable depth estimate, several Pg and Pn phase arrival measurements must be available.
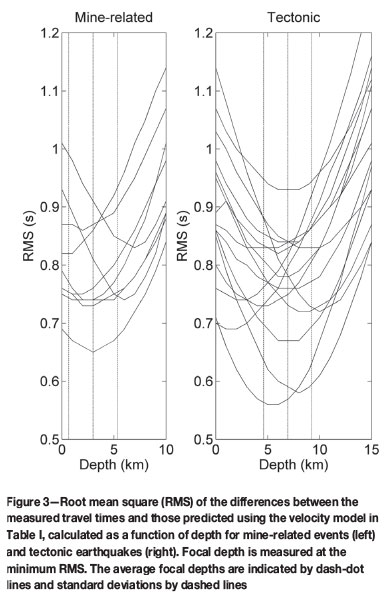
Affer the initial determination of the epicentre of amine-related event or tectonic earthquake at a fixed depth of 2 km or 5 km, respectively, the depth parameter is set free but no weighting can be applied to the depth parameter. The RMS of the differences (residuals) between the measured travel times and those predicted by means of the velocity model in Table I is calculated as a function of depth (Figure 3). Focal depth is measured at the minimum RMS. Depths, D, for tectonic earthquakes have a range of 2 km < D < 10 km and an average depth with a standard deviation of 6.9 ± 2.3 km. Depths for mine-related events range over 0 km < D < 7 km, averaging 3 ± 2.3 km. One tectonic earthquake and two mine-related events were rejected from the original data-set because their smallest values were reached at a depth of 0 km without what looked like a minimum. Also note that the WKBJ synthetic seismogram software applied below cannot accommodate a hypocentre at the surface.
Travel times with regional depth phases
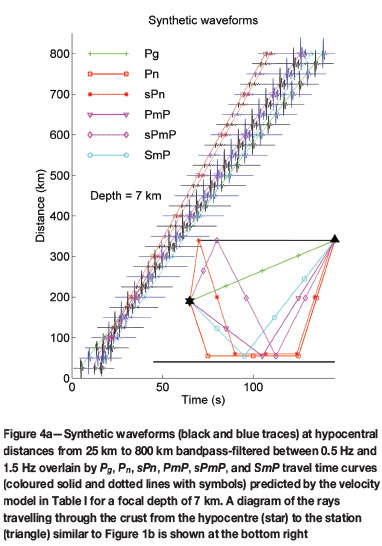
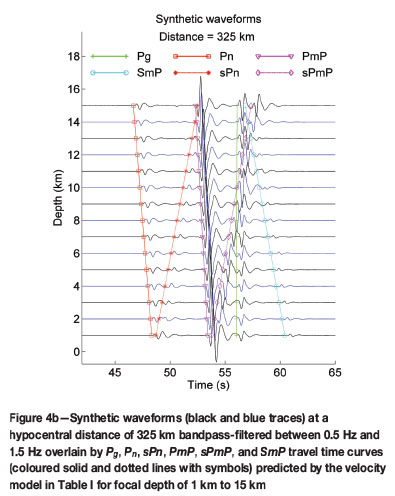
Focal depth estimation may be further improved by including so-called 'depth phases', which are sensitive to changes in the focal depth. In this study the author measured additional arrival times for the ascending S-wave converted at the surface to a critically refracted P-wave, sPn; reflected P-wave at the Moho discontinuity, PmP; ascending S-wave converted at the surface to a reflected P-wave at the Moho discontinuity, sPmP; and a descending S-wave converted to a P-wave when reflected at the Moho discontinuity, SmP (Figure 1b). Figure 4a shows synthetic waveforms and corresponding travel time curves for these regional depth phases at hypocentral distances between 25 km and 800 km for a focal depth of 7 km. The waveforms and travel time curves were generated by means of the WKBJ synthetic seismogram software (Chapman, 1978) for the velocity model in Table I. Note that the travel time differences between Pn and sPn as well as PmP and sPmP are nearly constant over the whole hypocentral distance range for which these phases can be measured. In Figure 4b, synthetic waveforms and travel time curves are shown for a hypocentral distance of 325 km and focal depths that vary from 1 km to 15 km. As before, focal depth is insensitive to Pg arrival times, but is sensitive to the arrival times of all the other phases. Note that focal depth is especially sensitive to the relative travel time differences between Pn and sPn and the PmP and sPmP phases.
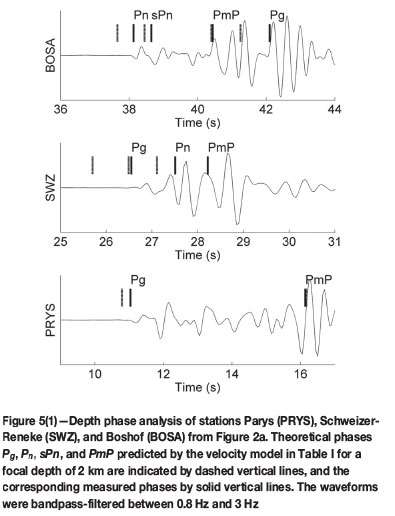
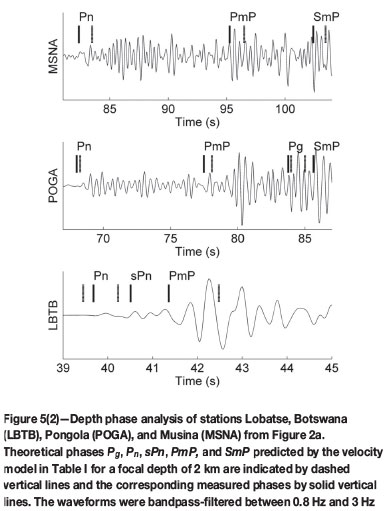
An example of a depth phase analysis is shown in Figure 5 for the signals recorded by selected stations of the South African National Seismograph Network for the mine-related event depicted in Figure 2a. The predicted arrival times were calculated using the WKBJ synthetic seismogram software. The number of available phases to analyse as well as the misalignments between the measured and predicted phases had increased. This may be ascribed to an increasing uncertainty for the crustal velocity model, e.g. depth of the Moho for the reflected PmP phase and S-waves velocity (which is assumed to be  of the P-wave velocity) for the converted SmP phase. An additional uncertainty was introduced by the phase measurements: Pg and Pn phases show up best on a signal bandpass filtered between 0.8 Hz and 8 Hz; hence this filter was used to re-locate the events and earthquakes in the previous section. Although phases sPn and PmP are usually clearer after they have been filtered between 0.8 Hz and 3 Hz, this is not always the case. For example, the 'incorrectly measured' PmP phase arrival in Figure 5(1) for station PRYS was analysed using the 0.8 Hz to 8 Hz filter, which showed a clearer onset than for the lower filter. It should be noted that the Pn phase onset for station LBTB was not clear for the lower filter (Figure 5(2)).
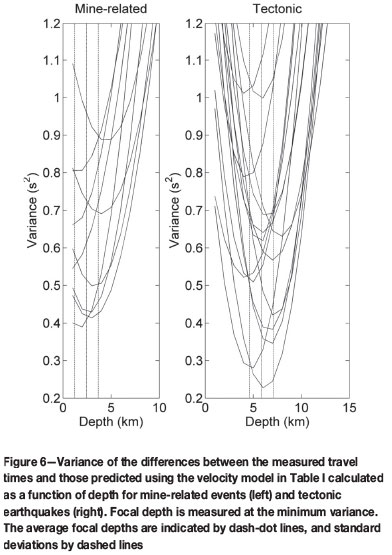
To determine the focal depth, earthquake hypocentres were first calculated (i.e. re-located) for the depth range 1 km to 15 km using the Hypocenter software. The corresponding predicted arrival times of the depth phases were then calculated using the WKBJ synthetic seismogram software. The introduction of additional measured phases, but with larger errors, required a more robust cost function than the RMS to estimate the focal depth. Hence the author applied variance as the cost function to this regional depth phase travel time investigation (e.g. Steyn et al., 1999). The variance of the travel time residuals estimates the spread of the measured and predicted travel time differences. A zero variance means that all the measured and predicted travel times are identical. A sample variance may be applied to estimate the variance of a continuous distribution from a sample of that distribution: this is an unbiased estimator of the variance of the population from which the sample variance is drawn provided that the range consists of independent, identically distributed samples. The minimum sample variance (of the sample variances calculated for different depths) of the travel time residuals of Pg and depth phases Pn, sPn, PmP, sPmP, and SmP would give an unbiased estimate of the focal depth. The requirement is that the selection of depth phases must be large and representative enough so that it is possible to discard uncertainties in respect of epicentre, origin time, and crustal properties. Figure 6 shows sample variance as a function of depth. Focal depth is measured at the minimum sample variance. Depth ranges and averages are 4 km < D < 7 km with 5.9 ± 1.2 km and 1 km < D < 4 km with 2.4 ± 1.2 km for tectonic and mine-related events, respectively.
Waveform modelling
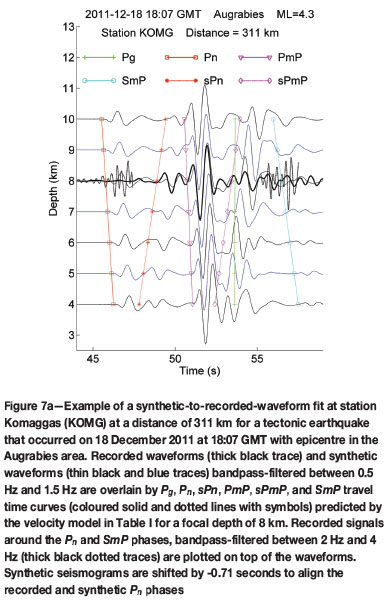
The author verified the focal depths of 8 km (re-location) and 5 km (travel times with regional depth phases) for one tectonic earthquake that occurred on 18 December 2011 at 18:07 GMT with its epicentre in the Augrabies area. Synthetic-to-recorded-waveform fits were applied using the WKBJ synthetic seismogram software for the abovementioned depth phases (c.f. Ma, 2012). The focal mechanism parameters for this earthquake source needed to generate the synthetic waveforms were obtained from the National Earthquake Information Centre. Unfortunately, no focal mechanism parameters could be calculated for any of the other earthquakes or events. Brandt and Saunders (2011) had obtained regional moment tensors in a previous study using the dense Kaapvaal Craton array, but the National Network is too sparse to obtain reliable fault plane solutions for single, large earthquakes. Before depth phase modelling can begin, each synthetic seismogram is time-shifted with respect to its recorded counterpart until the first-arrival recorded and synthetic phases (Pg or Pn) are aligned. In this way, uncertainties in the epicentre, origin time, and crustal velocity model are smoothed out.
Examples of seismograms illustrating the method of recorded-to-synthetic-waveform fits are shown in Figures 7a and b. The focal depth is obtained by visually comparing absolute and relative arrival times of the synthetic phase signals with recorded phases. (Also see Figures 4a and 4b). All the phases could be identified after some additional filtering on the seismogram recorded at station KOMG (Figure 7a). Station CVNA at Calvinia, at almost the same hypocentral distance but situated south of the epicentre (Figure 1a), recorded only clear Pn and sPn phases; the other phases could not be identified (Figure 7b). This may be attributed to the double couple source mechanism that generates directional seismic waves. Ma and Atkinson (2012) found that usually only one or two stations (among a range of stations) can be used to determine focal depth. Useful stations usually also record only either clear Pn and sPn or PmP and sPmP phases, although Ma and Atkinson (2012) did not apply different filters to their data as has been done in this study. The author was able to identify Pn and sPn phases on seismograms recorded by eight stations (e.g. for CVNA in Figure 7b) with modelled focal depths of 5 km or 6 km using relative arrival times. This study obtained a depth of 8 km for station KOMG with an overall, general best fit for the absolute arrival times of all the phases and relative times for phases Pn and sPn as well as PmP and sPmP (Figure 7a).
Conclusions
The results confirm the assumption that focal depths of South African earthquakes and mine-related events are shallow - within the upper third (0 km to 10 km) of the crust.
Mine-related events are classified by operators of local underground mine networks as fracture-dominated rupture events or development blast and friction-dominated slip events or mining-induced events. Development blast events typically occur within 100 m of active mine tunnels, whereas mining-induced events may occur up to 200 m from tunnels (e.g. Spottiswoode and Linzer, 2005). A detailed underground inspection of fault zones associated with the magnitude 4.6 Matjhabeng earthquake that occurred in 1999 near Eland shaft at Welkom, Free State gold mining area, reported that the active faults could be accessed and slip and displacement measured (Dor et al., 2001). Gold mining is now reaching depths of around 4 km and mine events are thought to be associated with active mining. This confirms the derived depth range of foci between 1 km < D < 4 km.
No evidence was found to support the hypothesis that earthquake focal depths in South Africa follow a bimodal distribution, with deeper hypocentres in the lower third of the crust (20 km to 35 km), as had been determined for other stable continental regions. However, this result should be interpreted with circumspection, because of the small tectonic data-set, and the fact that most of the earthquakes occurred in the Augrabies area.
The study justifies the routine practice used by the South African National Seismograph Network of fixing the depth of mine-related events to 2 km and tectonic earthquakes to either 5 km or 10 km when locating these events by means of first-arrival phases.
Focal depths determined when re-locating earthquakes with Pn and Pg phases are similar to the depths obtained using the more advanced techniques of travel times with regional depth phases and waveform modelling. Given the minimal effort involved in measuring additional Pn and Pg phases and re-locating an earthquake once the epicentre and fixed depth have been routinely determined (by means of the first-arrival phases), this technique may be applied regularly to major earthquakes in the future.
Acknowledgements
This research was funded as part of the operation and data analysis of the South African National Seismograph Network. Two anonymous reviewers made thoughtful suggestions to improve the article. The author wishes to thank the Council for Geoscience for permission to publish the results. Zahn Nel undertook the language editing.
References
Brandt, M.B.C. and Saunders, I. 2011. New regional moment tensors in South Africa. Seismological Research Letters, vol. 82. pp. 69-80. doi: 10.1785/gssrl.82.1.69 [ Links ]
Chapman, C.H. 1978. A new method for computing synthetic seismograms. Geophysical Journal of the Royal Astronomical Society, vol. 5. pp. 481-518. [ Links ]
Dor, O., Reches, Z., and Van Aswegen, G. 2001. Fault zones associated with Matjhabeng earthquake, 1999, Eland shaft, Welkom. Proceedings of the 5th International Symposium in Rockbursts and Seismicity in Mines, Magaliesburg, South Africa. Southern African Institute of Mining and Metallurgy, Johannesburg. pp. 109-112. [ Links ]
Havskov, J. and Ottemöller, L. 2010a. SEISAN earthquake analysis software for Windows, Solaris, Linux and Macosx. Ver. 8.3. University of Bergen, Norway. [ Links ]
Havskov, J. and Ottemöller, L. 2010b. Routine data processing in earthquake seismology. Springer Science + Business Media. 347 pp. doi: 10.1007/978-90-481-8697-6 [ Links ]
Klose, C.D. and Seeber, L. 2007. Shallow seismicity in stable continental regions. Seismological Research Letters, vol. 78. pp. 554-562 doi: 10.1785/gssrl.78.5.554 [ Links ]
Lienert, B.R.E., Berg, E., and Frazer, L.N. 1986. Hypocenter: an earthquake location method using cantered, scaled, and adaptively least squares. Bulletin of the Seismological Society of America, vol. 76. pp. 771-783. [ Links ]
Ma, S. 2012. Focal depth determination for moderate and small earthquakes by modeling regional depth phases sPg, sPmP, and sPn. Earthquake Research and Analysis - Seismology, Seismotectonic and Earthquake Geology. D'Amico, S. (ed.). InTech, USA. ISBN: 978-953-307-991-2. [ Links ]
Ma, S. and Atkinson, G.M. 2006. Focal depths for small to moderate earthquakes (mN > 2.8) in western Quebec, southern Ontario, and northern New York. Bulletin of the Seismological Society of America, vol. 96. pp. 609-623 doi: 10.1785/0120040192 [ Links ]
Maggi, A., Jackson, J.A., McKenzie, D., and Priestley, K. 2000. Earthquake focal depths, effective elastic thickness, and the strength of the continental lithosphere. Geology, vol. 28. pp. 495-498. [ Links ]
Mangongolo, A., Strasser, F.O., and Saunders, I. 2014. Depths of South African earthquakes. Seismological Research Letters (in press). [ Links ]
Nguuri, T.K., Gore, J., James, D.E., Webb, S.J., Wright, C., Zengeni, T.G., Gwavava, O., Snoke, J.A., and Kaapvaal Seismic Group. 2001. Crustal structure beneath Southern Africa and its implication for the formation and evolution of the Kaapvaal and Zimbabwe cratons. Geophysical Research Letters, vol. 28. pp. 2501-2504. [ Links ]
Saunders, I., Brandt, M.B.C., Steyn, J., Roblin, D.L., and Kijko, A. 2008. The South African National Seismograph Network. Seismological Research Letters, vol. 79. pp. 203-210. doi: 10.1785/gssrl.79.2.203 [ Links ]
Spottiswoode, S.M. and Linzer, L.M. 2005. A hybrid location methodology. Journal of the Southern African Institute of Mining Metallurgy, vol. 105. pp. 417-426. [ Links ]
Steyn, A.G.W., Smith, C.F., Du Toit, S.H.C., and Strasheim, C. 1999. Modern Statistics in Practice, 1st edn. Van Schaik, Pretoria, South Africa. 764 pp. [ Links ]
Wright, C., Kwadiba, M.T.O., Kgaswane, E.M., and Simon, R.E. 2002. The structure of the crust and upper mantle to depths of 320 km beneath the Kaapvaal craton, from P-wave arrivals generated by regional earthquakes and mining-induced tremors. Journal of African Earth Sciences, vol. 35. pp. 477-488. [ Links ]

