


Serviços Personalizados
Artigo
 Inglês (pdf)
 Artigo em XML
 Referências do artigo
Indicadores

Links relacionados
-
 Citado por Google
 -
 Similares em Google
Compartilhar

 Permalink
Journal of the Southern African Institute of Mining and Metallurgy
versão On-line ISSN 2411-9717
versão impressa ISSN 2225-6253
J. S. Afr. Inst. Min. Metall. vol.114 no.10 Johannesburg Out. 2014
6TH SOUTHERN AFRICAN ROCK ENGINEERING SYMPOSIUM
Estimation of future ground vibration levels in Malmberget town due to mining-induced seismic activity
T. Wettainen; J. Martinsson
LKAB, Sweden
SYNOPSIS
Malmberget town is located in northern Sweden, approximately 70 km north of the Arctic Circle. Parts of the town overlie more than 20 iron orebodies, consisting mainly of magnetite with smaller quantities of haematite. The mine is operated by the mining company LKAB. Mining started in the 17th century, but not until the railway to the coastal city of Luleå was completed in 1888 did large-scale production commence. Around 1920, mining proceeded underground and today sublevel caving is the only mining method used. Sublevel caving causes subsidence of the ground surface, and buildings and residential areas have been relocated due to the mining activities for more than 50 years. The number of seismic events accompanied by strong ground vibrations is now increasing. In 2008 the mine received a permit from the Environmental Court of Sweden to increase production to 20 Mt of crude ore per year. A prerequisite for the permit was that the mine conducts a number of investigations regarding the environmental impact on the residents of Malmberget. One of these investigations concerned how seismicity will change as production increases and what measures could be taken to reduce inconvenience to the town residents. Today the mine possesses an extensive seismic monitoring system with more than 180 underground and surface geophones. For this study, eleven seismically active volumes in Malmberget mine were identified, and for each of them, a yearly future maximum magnitude interval was estimated based on the current production plan. Relationships between historical seismic events and measured ground vibrations in the town of Malmberget were established, and future ground vibrations caused by expected seismic events were estimated using a probabilistic approach. The outcome was the number of intervals of expected ground vibration per year and per monitoring point. Possible measures to reduce inconvenience for the town residents include blast restrictions, sequencing, and possibly preconditioning. The ultimate long-term solution is an almost complete relocation of Malmberget town. This process has recently been formalized and LKAB is taking an active part in realizing this goal.
Keywords: sublevel caving, mining-induced seismicity, surface vibrations, future estimations, environmental impact.
Introduction
Malmberget town (Figure 1) is located in northern Sweden, approximately 70 km north of the Arctic Circle.

The Malmberget iron-ore deposits have been known for centuries. The ore was initially transported from the mine by horses and reindeer, until the railway to the coastal city of Luleå was completed in 1888 and large-scale production began. Today most of the refined iron ore products from Malmberget such as fines and pellets are transported to Luleå for use in steel mills mainly within the Baltic Sea region. The mine consists of around 20 orebodies of varying sizes and shapes (Figure 2).

Production in 2012 was 14 Mt of crude ore from 12 of the orebodies mined to a maximum depth of approximately 850 m below surface. The main mineral is magnetite, but there are also smaller quantities of haematite. The mine is operated by Luossavaara-Kiirunavaara AB (LKAB). The town of Malmberget has existed in close relationship with the mine for well over a hundred years. The first houses were built by miners who wanted to live close to their place of work. More miners followed and soon a shanty town resembling those found in Klondike during the gold rush era was established on the hill slopes of Malmberget (Figure 3).

The rich ore deposits were not depleted, and as the town grew the old shacks were eventually replaced by modern buildings. Mining started in open pits, but by the 1920s more than 90% of all mining was performed underground (Forsström, 1973). Many orebodies dip to the southwest, which gradually brings mining activities closer to the town itself. Since the 1960s sublevel caving has been the predominant mining method. This is a large-scale method, in which different activities take place on several levels simultaneously (Figure 4).

This method makes it possible to efficiently mine deposits at great depth at competitive cost. The main disadvantages are subsidence of the ground surface and, for Malmberget town, vibrations caused by seismic events due mainly to the caving of hangingwall areas (Figure 5).

Buildings, residential areas, and infrastructure have been relocated due to the presence of mining areas for more than 50 years, and the acceptance of this process is generally high among the residents of Malmberget. Inconvenience caused by seismic events is, however a relatively new problem. Vibrations from blasts have always been a part of everyday life in Malmberget, but vibrations from seismic events are perceived differently. Not only do they occur randomly rather than at specific hours, but the ground motion is also different due to the frequency and characteristics of the source. In 2008 the mine received a permit from the Environmental Court of Sweden to increase production to 20 Mt crude ore per year. A prerequisite to the permit was a number of investigations to be conducted by the mine regarding the environmental impact on the residents of Malmberget. One of these investigations concerned how seismicity will change as production increases and what measures could be taken to reduce inconvenience for the town residents.
Seismic monitoring system
The mine possesses an extensive seismic monitoring system, provided mainly by the Institute of Mine Seismology (IMS). The first sensors were installed in 2005, around the time when vibrations of unknown origin started to occur in Malmberget. The system has been expanded stepwise and by the end of 2013 there were around 180 sensors operational in the mine. The array consists of a few 1 Hz geophones but mainly 4.5 Hz (⅓) and 14 Hz (⅔) geophones. The 1 Hz geophones are installed on concrete slabs. Five are located on the surface in a ring formation surrounding the mine. An additional 1 Hz geophone is located underground in order to improve the vertical location accuracy of seismic events. Data from the 1 Hz array, which is stored in a separate database, was not used in this project, since the array had only recently been installed. The other types of geophones are all installed underground, from around 100 m below surface to the deepest level of the mine. Approximately 500 actual seismic events are currently processed daily. The classification of seismic events is done manually. LKAB uses the same local magnitude scale (ML), which is based on seismic energy (E) and moment (M), as many South African mines

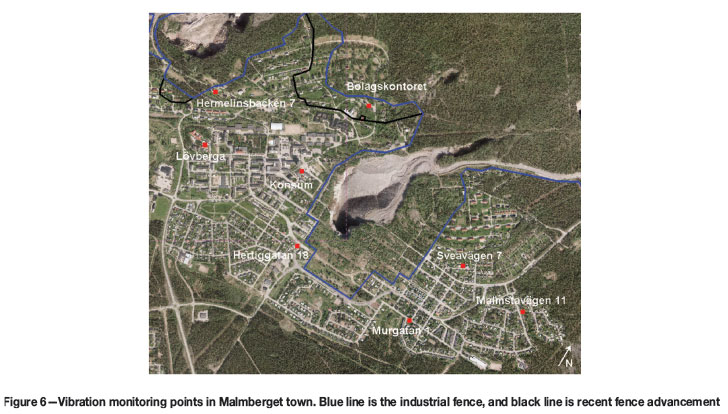
In addition to the geophones installed in the mine, there are also eight 8 geophones bolted to foundations of residential buildings around town to serve as vibration monitoring points. The incoming vibration is measured according to Swedish Standard SS 460 48 66. Figure 6 shows these monitoring points on surface, for which future vibration levels have been estimated. The amplification effects on the upper floors of buildings have not been considered, since each building responds differently.
Estimation of future ground vibrations
Seismic sources
The first step is to define seismically active volumes or sources in the mine. As new seismic events occur, they are automatically placed in spatial clusters by the analysis software mXrap (formerly MS-RAP), developed by the Australian Centre for Geomechanics. Clusters are then sorted into larger groups by mine personnel on a daily basis. Seismically active volumes were identified by combining groups together. The criteria for creating a volume were (i) to include most events with a local magnitude of 1 or higher and (ii) to obtain a good visual fit to the Gutenberg-Richter curve. This curve represents a frequency-magnitude distribution and is commonly used for seismic analysis (Gutenberg and Richter, 1944; 1954). It shows the activity rate (number of events) and the relation between small and large events for a given timespan and population. The observed magnitudes are assumed to be exponentially distributed within the sensitivity of the array. Eleven seismically active volumes were identified in the mine (Figure 7).

Only seismic events associated with the seven major orebodies were considered in the current analysis. The other orebodies are smaller and mined at shallower depths. They have not yet caused significant seismic events and are not expected to do so within the foreseeable future.
Production and activity rate
Using a well-defined population of seismic events, it is possible to statistically model the distribution of the magnitude of events using the Gutenberg-Richter relationship, and from that, estimate the distribution of the maximum event for a given period of time. However, predictions are valid only under the condition that, given the known covariates, the estimated parameters in the distribution will have the same characteristics in the future. The Environmental Court asked LKAB how seismicity will change when production increases. For this reason, the historical relationship between activity and monthly production was modelled for each of the seven major orebodies. All seismic events, regardless of size, recorded by the seismic system and spatially associated with the individual orebodies were considered. A linear regression model was used to describe the relationship between mining-induced activity as a function of production and mining depth during the same time period. For a given production rate and mining depth, the activity (number of events per month), is assumed to be lognormally distributed, and the maximum likelihood estimation (MLE) of the parameters is considered under the condition that the parameters are positive.
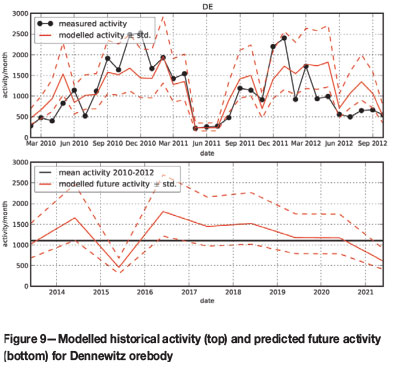
Mining depth was included as a parameter but proved to be insignificant for the data considered in this study. Data from 2010 until late 2012 was used, and the number of new mining levels established during this time is limited. The activity-production relationships were then used to predict future activity based on the current production plan (see examples in Figure 8-10). In this study we restrict ourselves to considering the orebodies individually, given their monthly production and their monthly average mining depth. This means that possible interactions between the orebodies are neglected in order to reduce the dimensionality of the estimation problem. On a mine-wide level they are dependent, but to capture this dependency we need to resort to multilevel or hierarchical models (Gelman et al., 2004; Gelman and Hill 2007) and treat the estimation problem jointly. However, this will increase the dimensionality by a factor equal to the number of orebodies; often together with additional hyper-parameters describing the mine-wide prior distributions for the model parameters.


Future magnitudes
The probability density function (PDF), p(m), of the magnitude m is modelled as a sum of exponential distributions in order to account for the possible presence of several different seismic sources within one single volume. The sum of exponential distributions is also multiplied by a sensitivity function for the seismic measurement system. The entire PDF is given by

where

is the exponential tail and

describes the sensitivity function where h(.)denotes the Heavyside function. The term

depends only on the model parameters and makes the entire distribution in Equation [2] integrate to unity. The parameter vector for the entire PDF is θ = [µ, τ, wT, βT]T, where w = [w0,...,wk-1]T is the weights under the condition that ||w||1=1 and the elements in β = [β0,...,βK-1]T are the parameters for the exponentials in Equation [3]. Figure 11 shows an example of the density in Equation [2] and its components in Equations [3] and [4] for K=1 and θ = [-1, 1/2, 1, 2]T.

The number of mixtures to use is determined by the Bayesian information criterion (BIC) to avoid over-parameterization (Stoica and Selen, 2004; Pintelon and Schoukens, 2001). Examples of estimation results using Equation [2] from the different orebodies can be seen in Figure 12-14. Note the model's ability to capture complex features, such as the data shown in Figure 13 exhibiting an additional activity at m=-1 and the distinct mode in Figure 14.


The advantages of introducing a sensitivity function (Equation [4]) is to avoid a hard truncation of the data at a specific sensitivity threshold using the more common magnitude distributions such as the Gutenberg-Richter relation for magnitudes or the open-ended power law (Gutenberg and Richter, 1944; Ishimoto and Iida, 1939), the upper-truncated power law (Page, 1968) or gamma type distributions (Saito et al., 1973).
Truncating data in general means that our statistical model is valid only in a specific region of the data. Truncation also means that we need to estimate the region for which our model is valid, and there is a risk of either throwing away valuable data if we truncate too much or jeopardizing the validity of our model if we expand this region too much. This choice will affect the uncertainty of our parameter estimates and may also contribute to bias estimates using improper models (see e.g. Pintelon and Schoukens, 2001; Kay, 1993; Scharf, 1990). For example, the lower truncation limit for using a translated exponential distribution (i.e. the open-ended power law) would be in the region containing most of our data and the estimation effects will be even more severe. The difficulties of applying some of the common magnitude distributions mentioned above can be seen e.g. in Mendecki (2008). Lasocki and Orlecka-Sikora (2008) also argue that the use of these common distribution models brings about an unacceptable and systematic over- or underestimation of the seismic hazard parameters.
Introducing a sensitivity function in Equation [4] means that the statistical model is valid for the entire data-set at the cost of two additional parameters (µ,τ) describing the sensitivity of the system. Considering a mixture of exponentials means that we can also model more complex behaviour discussed above and allow the collected data, together with an information criterion, to determine the shape of the distribution in the volume of interest.
The other alternative for modelling a complex size distribution is to consider a non-parametric kernel estimator of the density (see e.g. Lasocki and Orlecka-Sikora, 2008; Kijko et al., 2001). This method has the ability to capture complex shapes and behaviour, but comes at the cost of choosing an appropriate kernel function and corresponding kernel bandwidth (or scale). The main reason for not taking this route in this study is that the number of kernel parameters is proportional to the number of events, resulting in an unmanageable density in the sequential Monte Carlo analysis. Also, the largest magnitudes observed here still have an exponential (or power law) behaviour that we like to preserve.
Instead, we have focused on using only a few kernels in our mixture model. The kernel includes the sensitivity of the measurement system in order to avoid the truncation problems discussed above. It can handle complex shapes caused by multiple sources (Figure 12-14) and we have preserved the exponential tail (i.e. the power law behaviour). The cost of a parametric mixture model is that we have to estimate the appropriate number of mixtures (or kernels) to use by applying some cross-validation techniques (Ljung, 1987) or some well-established information measure (Stoica and Selen, 2004).
Gutenberg-Richter curves for each volume were plotted and modelled using measured data from 2010 until late 2012. Since the sensitivity of the system is limited, small events are more difficult to detect and the number of events below the sensitivity limit is less, as shown in Figures 12-14 and the top plot of Figure 15. The vertical axis in latter plot represents probability of occurrence but could also show number of events. Probability 100% (10° or 1) corresponds to the total number of events in the data-set. We expect all detectable events to be larger than approximately magnitude -2, which is roughly the detection limit of the seismic system in this particular area of the mine. The curves were normalized to one year and annual activity rates were used to obtain future magnitudes. In this way, maximum expected magnitude intervals were estimated for each volume and year.

The model of the survival function, representing the blue curve in the top plot in Figure 15, is given by

where P(m) is the cumulative distribution function (CDF) of the magnitude describing the measured data represented by the black dots. The survival function simply gives the probability that the magnitude of an event is larger than m. The complementary cumulative histogram of the magnitude data, represented by the black dots, is shown with relative frequencies as opposed to the number of events in each histogram bin to obtain an estimated probability. Using relative frequencies means that we can plot the complementary cumulative histogram of the magnitudes against the probability given by the survival function.
For a specific activity (number of events per year), denoted by A, we can estimate the magnitude distribution of the largest event that year. If the cumulative probability distribution P(m) of the magnitude m is given, then for a given specific activity A the probability that m is the maximum value is (P(m))A, assuming independent identically distributed magnitudes (see e.g. Gumbel (1967), and consequently 1-(P(m))A is the probability that m may be exceeded. To simplify the sequential Monte Carlo analysis described below, this distribution is approximated by a translated exponential distribution describing the dominated terms in the tail of the distribution (P(m))A. Let SF(m)=1-P(m) denote the probability that the magnitude of an event is larger than m. The intersection of the horizontal red line at m=mlow (Figure 15) gives us probability A-1 of occurring. The magnitude density of the largest event occurring is approximated by

where mh is the magnitude of the largest expected event that year and p(m) denotes the PDF of the magnitude of an event. The shape is given by a translated exponential distribution starting from mlow where the term A makes it integrate to unity. A comparison between the approximation and true distribution (P(m))A for a specific activity A can be seen in Figure 16.

However, as the estimated activity and the model SF(m) are associated with uncertainties, shown by the dashed red and blue lines in the top of Figure 8, the intersection is also uncertain. Monte Carlo integration is applied to obtain an average distribution p (mh) for K possible intersections mlow(k), k = 1,...,K, taking these uncertainties into account. This part of the analysis is where the approximation of (P(m))A in Equation [7] is useful. The effect of the approximation errors using Equation [7] (Figure 16) is small in comparison to the uncertainties from the possible intersections shown in Figure 15. Note also that the assumption of independent identically distributed magnitudes leading to (P(m))A is often violated in mining conditions. The resulting average distribution of K possible intersections is represented by the blue curve in the bottom plot in Figure 15 together with the histogram of the possible intersections mlow(k) in red. The green histogram mmedian(k) shows the distribution of the median magnitude of each p(mh|mlow(k)). To summarize, we approximate the largest event per year to have a magnitude density according to the blue curve.
One of the 11 identified seismic volumes includes a caving void. The Printzsköld orebody was not initially mined from surface, but mining started underground. This created an empty room that eventually will cave up to the ground surface. It seems that the Gutenberg-Richter approach overestimates the magnitudes in this case. The measured data has a poor fit to the Gutenberg-Richter model (Figure 17).

One possible explanation could be that there is a different ratio between small and large magnitudes in this particular case. Caving rooms in Malmberget have been monitored before and experience shows that the magnitudes associated with this process are not significant. Instead, the following equation, presented in Mendecki (2008), was used to estimate future maximum magnitudes for the caving volume.

where logPmax is equal to the largest observed seismic potency plus the largest jump between two record potencies in the observed series. logP was replaced with local magnitude ML in this analysis.
Table I shows Mmax for each seismic volume and year. The median magnitude of each Mmax interval is considered as Mmax here for illustrative purposes, except in column Printzsköld 1 alt. where Equation [8] was used and the actual Mmax is obtained. Printzsköld 1 is the volume with the caving room and the magnitude difference between the two methods vary between ML 1.1 and ML 1.4. Even though Equation [8] does not take production increase into account, the magnitude it provides is considered reasonable in this context.
Surface vibrations
Relationships between magnitudes, spatial locations, and measured surface vibrations were established for each surface monitoring point. A regression model is used to estimate the vibration as a function of the magnitude of the event, the hypocentre location of the event, and the sensor coordinate on the surface. The vibration is assumed lognormally distributed and MLE of the parameter is considered under the condition that the parameters are positive. A calibration function which is retrieved through estimation errors from previous events is used to describe the attenuation caused by wave propagation from specific locations to each sensor. The calibration reduces the estimation errors by 50% when it is evaluated using cross-validation. 275 historical seismic events with a total of 1027 corresponding surface vibration values were used for calibration. Only vertical vibration components were considered since this data is more abundant. Cross-validation was performed and the root mean square deviation (lgPGV) is 0.22. Figure 18 shows measured and predicted peak vibrations from 90 seismic events at a specific monitoring point.

Using the surface vibration relations and expected magnitude distributions, future vibrations at the monitoring points were estimated probabilistically. Monte Carlo simulation was used to sample hypocentre, magnitude, and corresponding surface vibrations for each seismic volume. Figure 19 shows maximum expected peak vibrations for each year at a specific monitoring point.

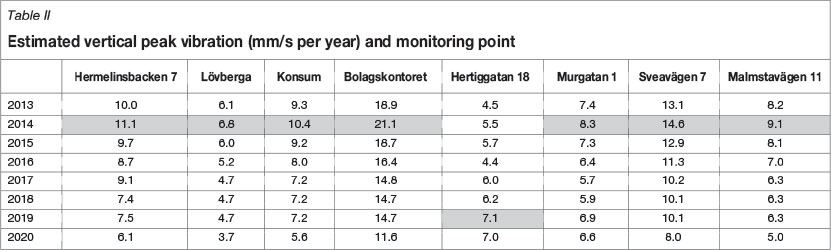
Table II summarizes the median of the maximum expected peak vibration values for each monitoring point. The critical year for each point is highlighted. No predictions have been made beyond 2020 because of large uncertainties in the production plan. Every change in production input will result in different vibration levels. The maximum measured vertical vibration ever within populated areas has been 19.5 mm/s, although the absolute majority is below 5 mm/s.
Measures to reduce inconvenience
LKAB has identified a number of measures that could be taken in order to reduce vibrations from seismic events in populated areas.
► Blast restrictions are already applied in the mine and can be used in specific areas based on previous experience. A numerical stress model can also be used to identify potentially critical areas or orebodies. The number of orebodies is decreasing with depth as some of the smaller orebodies will become narrower with depth while the larger ones will increase in size. Blast restrictions will have an increasingly negative effect on production
► Sequencing can be used to avoid stress concentrations in known structures or weak zones. Currently, sequencing is used primarily to ensure underground safety. Using it also with the intention to reduce surface vibrations will most likely adversely affect production
► Pre-conditioning methods such as hydraulic fracturing have been used in other mines to reduce large seismic events in production areas (Quinteiro, 2012). LKAB will investigate this option further, but the events that cause disturbances on the surface are usually located some distance into the hangingwalls. It may be difficult to access these areas with pre-conditioning equipment
► Relocation of Malmberget town is the ultimate solution. This is also the measure that will provide the desired results with high confidence. Malmberget has continuously been affected by the mine piece by piece for over 50 years. Buildings have been demolished or moved and roads have been closed. Since it became clear to LKAB that the largest orebodies expand with depth, a long-term action plan for community relocation became necessary. In 2012 an agreement was reached with the municipal council stipulating LKAB's responsibilities as well as obligations by local authorities. The agreement contains a time plan for relocation of residential areas in Malmberget (Figure 20). This is dependent on successful completion of corresponding expansion plans by the municipality in Malmberget's twin town Gällivare, some 5 km to the south. The relocation plan does not include one area in eastern Malmberget or housing areas owned by LKAB, where efforts will be made to maintain good living conditions.

Conclusions
LKAB was asked by the authorities to assess the probable levels of strong ground motion from future seismic events and their impact on residents of Malmberget. LKAB used a well-known method based on Gutenberg-Richter curves and observed historical data to estimate the largest expected seismic magnitudes. To estimate the impact of an increase in production, the curves were adjusted for different activity rates. This modification has to our knowledge not been done or published before, but is a way to try to answer the question from the Environmental Court. The final outcome was intervals of expected future vibrations under given conditions and probabilities. One advantage in a mining environment is that the driving force of seismic events, mining itself, can be controlled to some degree. Measures can be taken in order reduce seismic activity, but how fast and to what extent results will be achieved is impossible to say. Many measures could also lead to production losses and LKAB depends on large-scale production in order to remain competitive. The only way to completely avoid complaints from residents near a seismically active mine is not to have any neighbours at all. It has long been a principle of LKAB not to mine directly under residential areas, even though ground subsidence caused by mining of shallow-dipping orebodies would not occur in many years, if ever. The relocation of Malmberget is partly to ensure the comfort of residents rather than being a safety issue.
References
Forsström, G. 1973. Malmberget. Department of Human Geography, University of Stockholm. ISBN 91-85336-54-8 (in Swedish). [ Links ]
Gelman, A. Carlin, J.B., Stern, H.S., and Rubin, D.B. 2004. Bayesian Data Analysis, 2nd edn. Chapman & Hall/CRC. [ Links ]
Gelman, A. and Hill, J. 2007. Data Analysis using Regression and Multilevel/Hierarchical Models. Cambridge University Press, New York. [ Links ]
Gumbel, E.J. 1967. Statistics of Extremes. Colombia University Press, New York. [ Links ]
Gutenberg, B. and Richter, C.F. 1944. Frequency of earthquakes in California. Bulletin of the Seismological Society of America, vol. 34. pp. 185-188. [ Links ]
Gutenberg, B. and Richter, C.F. 1954. Seismicity of the Earth and Associate Phenomena, 2nd edn. Princeton University Press, Princeton, NJ. [ Links ]
Ishimoto, M. and Iida, K. 1939. Observations of earthquakes registered with the microseismograph constructed recently. Bulletin of the Earthquake Institute of Tokyo University, vol. 17. pp. 443-478 (in Japanese). [ Links ]
Kay, S.M. 1993. Fundamentals of Statistical Signal Processing: Estimation Theory, vol. 1, Prentice-Hall. New Jersey. [ Links ]
Kijko, A., Lasocki, S., and Graham, G. 2001. Non-parametric seismic hazard in mines. Pure and Applied Geophysics, vol. 158. pp. 1655-1675. [ Links ]
Lasocki, S. and Orlecka-Sikora, B. 2008. Seismic hazard assessment under complex source size distribution of mining-induces seismicity. Tectonophysics, vol. 456. pp. 28-37. [ Links ]
Ljung, L. 1987. System Identification: Theory for the User. Prentice-Hall, New Jersey. [ Links ]
Mendecki, A. 2008. Forecasting seismic hazard in mines. Keynote address: First Southern Hemisphere International Rock Mechanics Symposium, Perth, Western Australia, September 2008. [ Links ]
Page, R. 1968. Aftershocks and microaftershocks of the great Alaska earthquake of 1964. Bulletin of the Seismological Society of America, vol. 58, no. 3. pp. 1131-1168. [ Links ]
Pintelon, R. and Schoukens, J. 2001. System Identification: a Frequency Domain Approach. IEEE Press, New York. [ Links ]
Quinteiro, C. 2012. Report from mine visit at El Teniente, Chile. Internal LKAB document. [ Links ]
Scharf, L.L. 1990. Statistical Signal Processing: Detection, Estimation and Time Series Analysis, Vol. 1. Addison-Wesley, New York. [ Links ]
Stoica, P. and Selen, Y. 2004. Model-order selection: a review of information criterion rules. IEEE Signal Processing Magazine, vol. 21, no. 4. pp. 36-47. [ Links ]
Wettainen, T., Martinsson, J., and Perman, F. 2014. Investigation U6, Seismic activity Malmberget. LKAB report 14-806 (in Swedish). [ Links ]
This paper was first presented at the, 6th Southern African Rock Engineering Symposium SARES 2014, 12–14 May 2014, Misty Hills Country Hotel and Conference Centre, Cradle of Humankind, Muldersdrift.

