


Serviços Personalizados
Artigo
 Inglês (pdf)
 Artigo em XML
 Referências do artigo
Indicadores

Links relacionados
-
 Citado por Google
 -
 Similares em Google
Compartilhar

 Permalink
Journal of the Southern African Institute of Mining and Metallurgy
versão On-line ISSN 2411-9717
versão impressa ISSN 2225-6253
J. S. Afr. Inst. Min. Metall. vol.114 no.10 Johannesburg Out. 2014
6TH SOUTHERN AFRICAN ROCK ENGINEERING SYMPOSIUM
Pillar behaviour and seismicity in platinum mines
S.M. Spottiswoode; M. DrummondI
IDrummond Technical Services
SYNOPSIS
Crush pillars are widely used in mine workings on the Merensky Reef in the Bushveld Complex to prevent panel collapses. Crush pillars are expected to fail as or soon after they emerge from the face and failure should occur non-violently. Unfortunately, violent failure occurs frequently and is said to be the main cause of seismicity associated with mining of the Merensky Reef.
Recent work by Napier, Malan, and du Plessis has shown that limit-equilibrium quasi-static models are able to simulate pillar failure using three states of strength of rock in pillars, namely intact, residual after failure, and decayed strength after later time-dependent (viscous) weakening. We have previously introduced an additional state of strength to account for the dynamic failure that results in seismic events, and found that this approach could be used to generate synthetic seismic catalogues similar to observed seismicity for deep-level gold mines, where seismicity takes place mostly on advancing faces. The less brittle seam material of the Merensky Reef, compared to the brittle quartzites and lavas of the Witwatersrand reefs, results in little or no face bursting and is modelled with an assumed plastic strain of some 0.005 over an effective stope width of 2 m before failure. When this plastic yield is surpassed, we allow the reef to fail 'seismically'.
We show that synthetic seismic catalogues modelled in this way have some of the features of observed seismicity. Analysis is greatly facilitated using our custom-built software that reads the mine's survey data into a database and presents results in an interactive graphical form.
Keywords: seismicity, dynamic failure, crush pillars, pillar behaviour, pillar failure, simulation, numerical modelling.
Introduction
One of the hazards of deep-level Witwatersrand gold mines is rockbursting associated with mine seismic events. This hazard is addressed principally through the designs for stoping layouts and support (e.g. Jager and Ryder, 1999). Three broad factors are considered for layout design, namely regional support in the form of rock pillars, local stability through correct sequencing and face shapes, and the presence of geological discontinuities and intrusions. Backfill is widely used to provide a dual function of regional and local support. Spottiswoode et al. (2008) studied dip pillar mining at two mines and found that seismicity was proportional to elastic strain energy release and the dip pillars were performing stably as required.
While rockbursts are much less common in the mines of the Bushveld Complex, they are considered to be an increasing hazard (Ledwaba et al., 2012). Essrich et al. (2011) recommended that similar hazard control measures to those applied for deep gold mines be applied for mining of the platinum reefs, in particular the Merensky Reef. These measures include avoidance of highly-stressed remnants, 'improved sequencing', prevention of long abutments, adherence to stopping lines between raise lines, limiting and controlling leads and lags, and 'cutting pillars to the correct width and length dimensions'. These 'suggested changes' are arguably too vague to be readily implemented without more studies of the relationship between mining geometry and sequencing and associated seismicity. We hope to show in this initial study that the modelling and back-analysis methodologies that we present for the first time can be applied to answer some of the questions implicit in the broad recommendations of Essrich et al. (2011).
In this paper we simulate possible pillar failure and further deformation using a limit equilibrium model for pillar strength. Limit equilibrium modelling was suggested by Brummer (1987) using a high 'effective' stope width (mining height) as a way to explain the vertical extent of fracturing around deep-level Witwatersrand stopes. Napier and Malan (2007) applied limit equilibrium modelling to simulate deformations of in-stope pillars using two measures of reef strength, namely 'intact' and 'residual' (post-failure). The same authors (Malan and Napier, 2011) referred to uncertainties in pillar strength and loading stiffness as reasons for moving beyond the sole use of empirical formulae for pillar design towards combining monitoring and numerical modelling to obtain the best insights into design problems.
They extended the work further (Napier and Malan, 2012) by considering a third measure of strength to account for time-dependency in the fractured rock mass, and introducing a 'decayed strength' that is reached exponentially and is described in terms of a half-time (for example 20 days) in a manner similar to radioactive decay. Du Plessis et al. (2011) presented modelled stope closure data and concluded that Napier and Malan's (2012) time-dependent model was not adequate to explain observed stope closures. They plan further fieldwork to guide changes to their model.
The work by Napier, Malan, and du Plessis mentioned above followed a considerable amount of fieldwork and detailed numerical modelling by Watson and others (e.g Watson et al., 2008; 2010) to provide some measures of intact and post-failure strength.
The modelling work presented here uses the limit equilibrium approach of Napier, Malan, and du Plessis with a fourth value of strength, namely 'dynamic strength', the stress held by an element of reef when it initially loses its intact strength or when its short-term post-failure strength is exceeded. These four measures of strength were introduced by Spottiswoode (2001) for studies of seismicity associated with the Witwatersrand deep gold mines. We assess the extended model by comparing catalogues of synthetic seismicity with observed seismicity.
Source mechanisms of Bushveld Complex mine seismicity
Impala Platinum mines the Merensky and UG2 reefs in the western limb of the Bushveld Complex. Seismicity has been increasing (Ledwaba et al., 2012) and is considered to be an increasing hazard. Most of the seismicity, as indicated by rockburst damage, is associated with the in-stope pillars, which are nominally 6 m by 3 m in size but may differ substantially for various reasons.
Whereas seismic source mechanisms on deep-level gold mines are generally compatible with shear failure (e.g Hoffmann et al., 2013), source mechanisms of events at Impala (Spottiswoode et al., 2006) and other mines in the area are compatible with pillar failure and accompanying stope closure (Malovichko et al., 2012).
A limit equilibrium model for pillar failure
Following the lead of Malan and Napier (2011), we model pillar strength in terms of a limit equilibrium model. Figure 1 is a discretized approximation of reef strength in terms of normal and normal stresses ahead of a face or into an abutment or pillar.


where
m is the strengthening factor with confining stress s
U is the UCS, as experienced at the face
c is the cohesive strength against shear
µ is the coefficient of friction
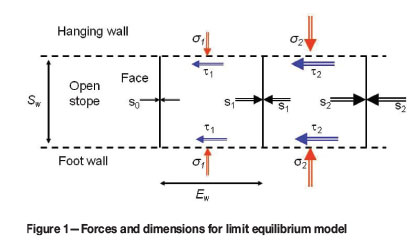
 is a measure of the slenderness of each small (T<<1) limit equilibrium element, with Sw being the stope width (or height in layman's terms) and Ew the element width.
Eliminating τi and σi from Equations [1], [2], and [3] we have an equation for the increase of horizontal stress ahead of the face:

where constants e and f are given by

and

and then the vertical limit equilibrium stress is given by Equation [1].
Note that Equation [4] does not guarantee that the confining stress increases with increasing distance from the face, as a value of element width Ew > µmSw causes the horizontal confining stress, and hence the limit equilibrium strength, to become infinite (when T = µm) or negative. This is clearly incorrect, as Napier and Malan (2011) and others have shown that the limit equilibrium strength increases exponentially with distance from the face. This mathematical problem disappears in the limit as the element width tends to infinity (T → ∞ or Ew → 0). We therefore take care to choose values of element size  within practical limits.
Identifying and measuring synthetic seismic events
Constructing a synthetic seismic event
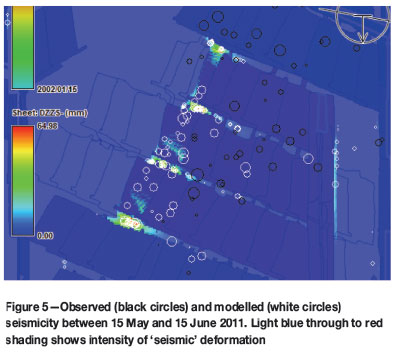
As seismicity on the Bushveld Complex platinum mines appears to be predominantly associated with in-stope pillars, we cumulated convergence associated with seismic stress drop within unmined areas to form synthetic seismic events. The 'location' of a synthetic event is given as the centre of gravity of the convergence on the elements. Most events locate on in-stope pillars and, for most pillar shapes, plot within the pillar. Plots of seismicity and mining within a finite time window of may incorrectly appear to have occurred in mined ground, as will be seen in Figure 5.
Calculating the size (moment-magnitude) of synthetic events
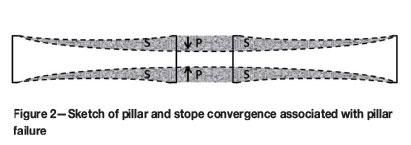
Sudden loss of reef strength and accompanying convergence of the roof and floor of the stope and across the failed reef constitutes a seismic event in this paper. The 'size' of the event is given by the volume of convergence multiplied by an elastic constant. In general, the volume change attributed to a pillar cannot be calculated by direct summation as associated stope convergence might be affected by deformations in other areas of reef. We take an energy approach to calculate the volume of convergence.
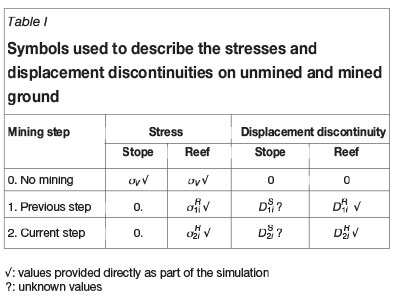
Consider three states of a pillar-stope configuration at each on-reef element, namely before any mining, and the states immediately before and after a seismic failure, as in Figure 2.
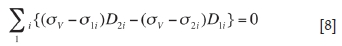
The work done to move from the previous to the current configuration can be written either directly from step 1 to 2 or from the difference in work done from virgin (pre-mining) conditions to steps 1 and 2 (see Table I):
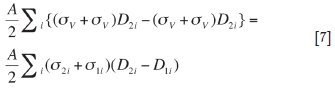
This simplifies to
Separating the reef (R) and stope (S) components and setting the zero values from Table I gives
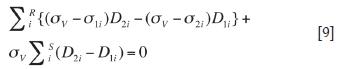
The change in volume around the failed reef and associated stoping is then
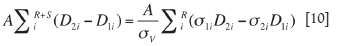
and is called ΔV here.
We compare observed seismicity to mining in any area and time period using

where χ is an elastic modulus taken as (λ+2G)/2.
Computer program development
MinX
MinX is a software environment for creating, running, and visualizing MinFT solutions. MinX employs an MS AccessTM database to store both mine plans and solutions. The main reason for employing a database was encapsulation (i.e. avoidance of an otherwise messy file system) but other database features were attractive with respect to efficient data retrieval (e.g indexing).
MinX essentially employs a pipeline architecture, as pipelines accommodate later modifications and extensions with a low amount of disruption (Garlan and Shaw, 1993). It is hoped that as the software reaches maturity, the pipeline aspects may be exposed via the user interface to allow users to reproduce or create new workflows as well as modify existing processes.
MinX process
An advantage of MinX is that surveyed digital mining geometries are employed. Monthly mining polygons are imported in ESRI Shapefile format (an open format) - .dgn (Bentley Microstation format) and other proprietary formats are easily converted to Shapefile format via the mine survey department's software. The authors attempt to employ only open, published formats to allow for easy sharing and access of data - e.g the ESRI Shapefile format, which has become a de-facto standard for spatial data (ESRI, 1997)
Mining outlines are stored within the MS Access database in Shape binary format, though it is intended to employ the WKB format (Well Known Binary format of the Open Geospatial Consortium) in future versions (Open GIS Consortium, 1999). Queries are executed based on both mining date ranges and geometric intersections between the area of interest and bounding boxes of mined polygons.
Optional on-screen digitizing allows users to make corrections to mining layouts. This has proved to be particularly useful in the elimination of 'slivers' (thin unmined areas between adjacent polygons due to poor digitizing) that may, during rasterization, be interpreted incorrectly as pillars. The digitizing facility also allows users to reconcile the boundaries of early unsurveyed layouts with later surveyed polygons. Polygons representing mined areas can be created for any particular mining step. Users can also elect to overwrite mined polygons with their own unmined polygons. User-created polygons reside in a layer of their own and do not affect the imported surveyed polygons - they are only combined in the raster created during the scan process.
Sheets are created and positioned interactively by the user on the mine-plan. Dip and dip direction are calculated automatically on placement, based on local geometry, but can be over-ridden if desired. All sheet-related parameters and MinFT run-flags are easily set through dialogs (brief descriptions, default values, and ranges of allowed values are also provided for run-flags).
Mine plan polygons are scanned (per mining step) into sheet images (comprising a raster of percentage-mined blocks). The creation of MinFT input files, launching of the MinFT solver, and subsequent loading of the solution back into the database are automated.
MinX issues
Not long after the first release, it became apparent that MinX and MinFT were too tightly 'coupled' - most obviously when problems were encountered updating both the database and the MinX software to accommodate changes and extensions made to MinFT. Given the advantages of decoupling (upgrades and extensions could be made to MinFT without corresponding changes to MinX or the database), it was decided to expend considerable effort on the problem. Currently an xml file is employed to communicate to MinX all relevant metadata with respect to both MinFT variables (e.g name description, units) and MinFT run-flags (e.g name, description, valid values/range, default values). This has proved highly effective in allowing autonomous and asynchronous development of the MinFT solution engine.
Further problems arose as solutions for larger and larger sheets caused the 2 GB size limit of MS Access to be exceeded. At first it was thought that with automated maintenance of the database (i.e. scripted compress and repair operations) this could be avoided, but it is now evident that to accommodate very large sheets it will be necessary to provide a database per sheet anyway. This move will actually provide more decoupling as there will now be one database providing mining geometry and several sheet databases. Maintenance of the sheet databases will in future become irrelevant as a new database will be created programmatically every time a solution is run and loaded. Whether it will be beneficial to provide the databases to MinX through links in an essentially empty master database will have to be determined through experiment. It remains to be seen, now that the initial desired single database model is no longer feasible, whether multiple linked databases would prove to have any advantage over multiple files (the situation the developers were trying to avoid). Certainly, the single database model would work well with a shared 'industrial-strength' database (e.g MS SQL Server) and the additional spatial functionality would be welcome, but this would impact severely on portability.
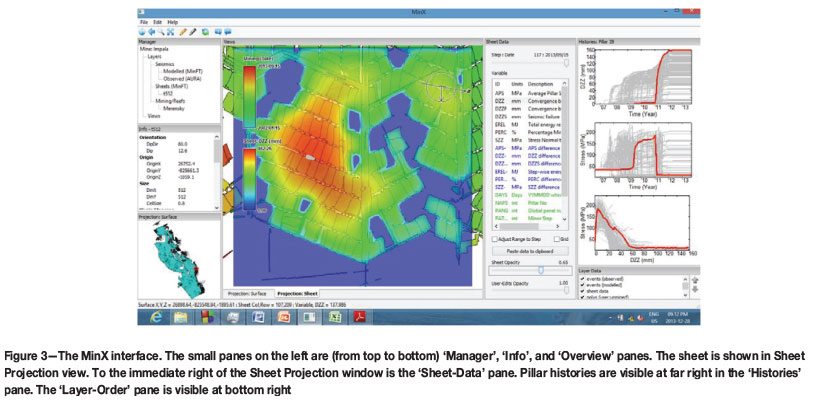
MinX interface
In line with modern interface design, interface panes are configurable by the user and can be re-sized and either docked or floated. This allows users to configure the interface to best suit the format and resolution of the monitor(s) in use.
An overview pane ensures that there is always a view of the entire mine plan. The actual area being worked in is highlighted on this overview. It is envisaged that this pane could be made interactive to allow for fast repositioning to different areas of the mine plan.
A manager pane shows all sheets available and allows the user to select or create a new sheet to work with. As mentioned previously, when new sheets are created a dialog prompts users and assists to complete the sheet definition process. Selection of a sheet causes the surface projection window to zoom to the extents of the selected sheet. Further activation triggers the opening of an on-sheet projection window for the creation and/or viewing of a sheet solution.
Solutions are viewed in an on-sheet projection window. The on-sheet projection window is layer-based and, as well as sheet variables, allows for visual comparison of observed vs. modelled seismic events. A glyph provides sheet orientation information (dip and dip direction), while legends provide information about the mining step and active-variable ranges.
A Layer-Order pane provides a means of determining the rendering order of layers, also providing the ability to switch layer visibility on or off as desired.
The Sheet-Data pane allows selection of mining step and variable. Variables are currently refined into three groups, namely 'Dependent', 'Difference', and 'Independent'. 'Dependent' variables represent the default type - values exist for every mining step - they are listed in the variables window in black font. 'Difference' variables are calculated from 'Dependent' variables and show the difference in values between the current step and the previous step - listed in blue font. 'Independent' variables do not change with mining step (i.e. they occur only once and are stored with a mining step value of -1) - they are listed in green font.
Pillar history plots (stress, convergence, and stress vs. convergence) are linked to pillar selection in the on-sheet projection window. Conversely, selection of an individual history in any of the plot windows will highlight the respective pillar in the on-sheet projection window.
In order to retain a sense of how the model is defined, it was decided to visualize the sheet elements as discrete grid cells devoid of interpolation (as opposed to e.g. contours or methods employing values interpolated from cell centres to cell vertexes). The value of each cell is mapped to a colour value through a lookup table. Image manipulation methods (provided by the application framework) allowed for relatively fast rendering times. Seismic events are visualized as circles (centred on event origins and scaled to magnitude) - modelled events appear with white outlines, whereas recorded events appear with black outlines. Again, there has been no problem with rendering times - although should this at some stage prove to be a bottleneck, the circle geometries will be reduced to far simpler primitives (e.g. squares, diamonds).
MINFT
MINFT calculates stresses and displacement around tabular mining excavations using the displacement discontinuity method (DDM). The most calculation-intensive part of the DDM is calculating stresses from displacement discontinuities (elastic stope convergences). In MINFT this is done with the aid of Fourier transforms (Peirce et al., 1992).
Extensive changes to the code used by Spottiswoode (2001) were made for the platinum version of the MINFT program. Changes were necessary for introduction of the limit equilibrium model described above; to integrate MINFT with the MinX environment; to exploit the MinX graphical interface; and to accommodate the particular mining geometry used in the platinum mines.
As shown above, the limit equilibrium model requires small element sizes. The strength values are built up element by element from open stopes into the solid using the strength parameters and values in Table II. The values were based partly on those used by Malan and Napier (2012) with the 'dynamic' strength equal to the ultimate strength. We have not 'tuned' the values through back-analysis for this paper.
Mining outlines are made available on a monthly basis. A face advance of 20 m or a typical month's mining could result in actual stress increase and decrease of over 100 MPa. It was necessary therefore to interpolate the month's advance (called major steps) in small increments (minor steps) to track stress changes on pillars. A typical day's face advance is about 1 m and we used an element size of 0.8 m in this study. Solutions consisted of 117 major steps (close to 10 years) extending up to September 2013 and typically over 1000 minor steps, with each step allocated to a date to allow comparison between observed and modelled seismicity.
Platinum mine seismicity and mining geometry are strongly influenced by pillars, and in-stope pillars in particular. Pillars are left either for regional support or for local hangingwall support (grid pillars). Surveying around small pillars is difficult, especially if they have started to fracture and a substantial amount of failed rock has been (correctly) left in place. The hand-digitizing mentioned above may still leave small mistakes, and some of these can be (and are) rectified automatically, such as isolated mined or unmined elements.
In MINFT, pillars are defined as areas of reef that consist of adjacent (contiguous) elements that are unmined during the last step. In most cases, there are many more in-stope (or grid) pillars than regional support pillars.
Integration with the MinX environment has required some customization of reading input and writing output files. However, the MinX graphical interface gives many opportunities for the display of values for an assortment of parameters that describe the mining geometry and program solutions. Parameters are either fixed over the duration of the solution or change from month to month. Some time-varying parameters can be displayed in terms of the difference from month to month. The parameters were chosen during code development to assist in visualizing and debugging. We hope that users of the MinX suite will use these displays to gain understanding of the how the model and data analysis works. Some of the available parameters are listed in Table III.
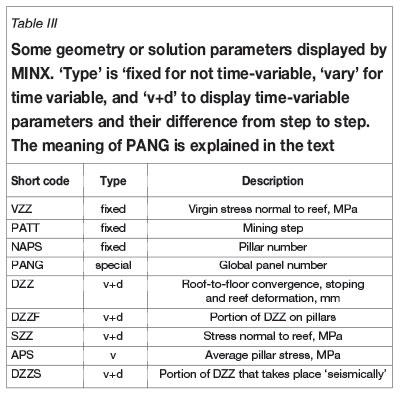
The PANG parameter shows groups of panels that were mined 'close' to one another in space and time. We chose 'close' to be 60 m, as it seemed to be approximately the seismic location error as judged by the scatter of locations around active faces and their adjacent pillars.
As the entire stress-deformation history of each individual pillar is of interest, average stress and average displacements for every minor mining step and every pillar are written to a file for plotting by MinX.
The stress field in the platinum mines appears to be approximately hydrostatic, with k-ratios (horizontal / vertical stress) of around 1.0 (Handley, 2013). For the current study we assumed k = 1.0 and hydrostatic stress. This has the advantage of eliminating the need to solve for on-reef shear stresses and ride components, thereby minimizing solution times.
Platinum mine seismicity is considered to occur on pillars (e.g. Essrich et al., 2011). Identification of modelled seismic events is therefore generally straightforward once pillars have been identified, as is the case with MINFT. Seismic moment is calculated for sudden failure of pillars using Equation [11].
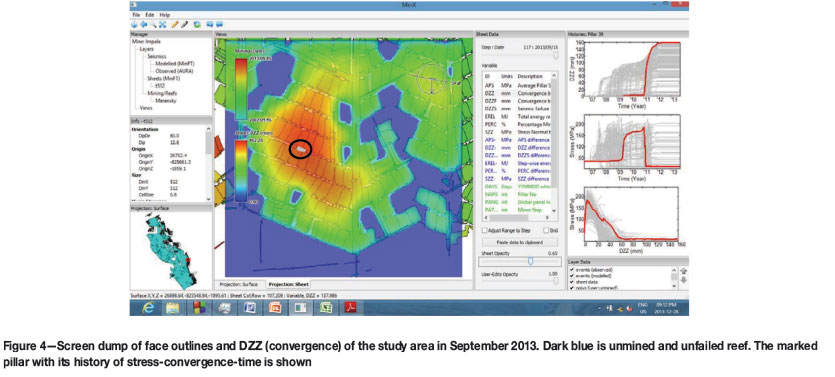
Analysis
Superficial analysis of a 410 m by 410 m area of Impala mine is shown here mostly in terms of screen dumps and X-Y plots. Figure 4 is a screen dump of stope convergence with pillar deformations for the study area. One in-stope pillar has been selected and its stress-convergence-time plots are highlighted in red.
Figure 5 illustrates observed and modelled seismicity. Most modelled seismicity takes place on the pillars - some seismicity takes place ahead of the advancing faces. There would be considerably more face seismicity if we did not allow some (10 mm in this case) reef deformation at the intact strength before allowing the reef to fail. The in-stope seismicity results from failure of the face, associated in part with the lagging configuration of panels. As expected, the observed seismicity shows considerably more scatter than the modelled seismicity.
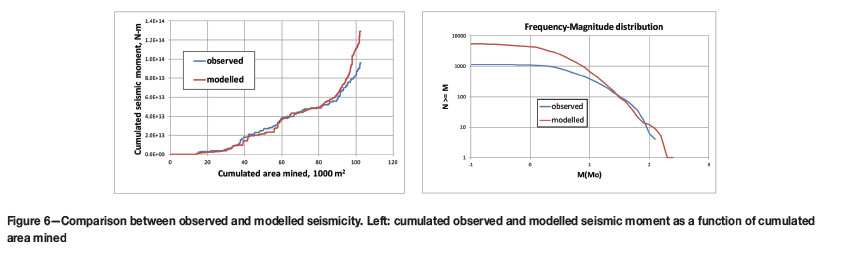
The total amount of modelled seismicity mimics the observed seismicity quite well (Figure 6) considering all the assumptions and uncertainties and the fact that we have made very few attempts at 'tuning' strength values to match the modelled results to the observed seismicity. The lower number of small observed events compared to the number of modelled events is a result, in part, of network sensitivity.
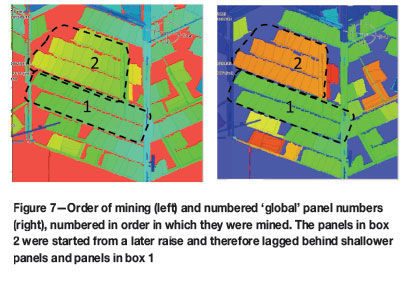
We now compare modelled to observed seismicity associated with two identified areas of mining (Figure 7), based on the global panel numbers (PANG, above). This was facilitated by using a purpose-built CSV file written by MINFT. This file lists the total amount of observed and modelled seismic moment associated with each panel grouping for each month. Two well-grouped large areas are labelled 1 and 2 in Figure 7. Global panels were not always as clearly grouped, as can be seen by the wide range of colours on the right of Figure 7. Poor grouping occurred for complicated mining situations, such as when re-raising was needed to re-establish panels that had become difficult to mine.
For each area, we plot the cumulated modelled and observed seismicity expressed as inferred volume of coseismic convergence (Equation [10]) as a function of the area of influence for capturing the events (Figure 8).
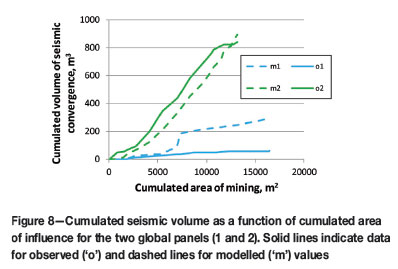
As expected, the lagging panels of group 2 were more active, both for the modelled and the observed seismicity, than the previous group 1 panels. The modelled seismicity matched the observed seismicity well for the lagging faces (group 2), but over-estimated the seismicity in group 1.
Data for other global panels has not been presented here, as interpretation would arguably be best served by comparison with similar situations elsewhere on the mine within a wider study than this initial work.
The slope of the graphs in Figure 8 is analogous to γE (normalized seismic deformation) presented by Spottiswoode et al. (2008) for two much larger case studies in deep gold mines. The observed values for two global panels in Figure 8 are 0.018 and 0.068 for panels 1 and 2 respectively. This is substantially less than the values of 0.25 and 0.19 reported by Spottiswoode et al. (2008) for gold mines.
One of the features of both the observed and modelled seismicity is that there are more events than pillars: each pillar might fail seismically many times. This is illustrated by the multiple stages of stress drop in the highlighted stress-convergence plot on the bottom right of Figure 4.
One might intuitively expect that the rate of stress drop is a factor that controls the burst potential of a pillar. To study this, we show the loading stiffness that drove each event on each pillar with a size of less than 50 m2 as a function of pillar size in Figure 9. Note the large range of stiffness values. For comparison of the estimates from the individual event loading stiffness values, we created two special simulations:
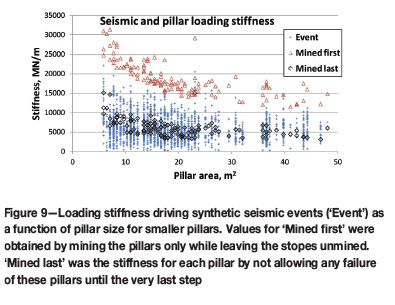
1. The stiffest loading is expected to be for the case of failure of each pillar when surrounded by unmined ground stabilized only by large pillars, as shown by the 'Mined first' symbols in Figure 9
2. The softest loading might intuitively be expected to occur for the pillars to be intact until they are allowed to fail completely only after all mining has place. This is shown by 'Mined last' symbols based on a two-stage simulation: namely, all final mining followed by complete failure (evaporation) of the smaller (< 50 m2) pillars. This was not the case, as much of the softest loading takes place with some elements holding some of the stress drop of failing elements. This could be important for understanding the damage potential of pillar events.
Discussion
Most work to date on numerical modelling and seismic studies in South African mines has focussed on the deep gold mines (e.g. Jager and Ryder, 1999). Much of the research has focused on shear slip on geological discontinuities (e.g. Hoffmann et al., 2013), as large seismic events are commonly attributed to previously mapped faults or dykes. On the other hand, seismicity is not always dominated by the mapped discontinuities, and has been found to be broadly proportional to elastic strain energy released in two mines in the Carletonville gold field (Spottiswoode et al, 2009). Elastic strain energy release for flat-dipping reefs is a weak function of the horizontal stress. Handley (2013) has pointed out that the apparently greater success with pillars aligned with the dip direction compared to pillars along strike could be due to the horizontal stress component along strike generally being greater than the dip-aligned horizontal stress. Narrow deep-level stopes are surrounded by fractures that extend many metres from the reef. A limit equilibrium approach for Witwatersrand gold mines would perhaps need to consider several layers extending into the hangingwall and footwall. Horizontal stress would play an important role, as would backfill in limiting the bulking of the face area.
The work presented here is mostly a description of processes for modelling deformations around a typical platinum mining geometry and sequence. The aim has been more as an introduction to what MINX / MINFT can do than how it should be used for mine planning. Application on a mine is briefly summarized in Figure 10.
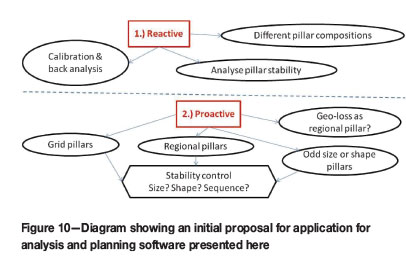
Reactive
The work in this paper is of a reactive nature based on back-analysis of a single area. The general term 'pillar stability' can be divided into two components, namely well-behaved yield of grid (in-stope) pillars and large pillars maintaining a core of unfailed ground that provides regional stability by being capable of maintaining a stress an order of magnitude larger than the virgin stress. It is of utmost importance that a nominally stable pillar does not fail unexpectedly. We suggest that extensive back-analysis work be done to study situations that might have been considered to have been stable, but which did generate large events.
Proactive
Under ideal geological conditions, a regular grid of in-stope pillars and regional pillars might be designed. However, the geometry of the mining in the study area contains sufficient evidence to indicate that odd-shaped pillars are likely to be used. It is essential that regional pillars, of whatever origin, do not fail entirely, nor that pillars that are meant to fail do so at a later stage. On the other hand, in-stope pillars do need to fail in or close to the face and then provide enough support resistance.
Conclusions
This paper reports the first results from a new suite of programs to model pillars in platinum mines. The ultimate aim of this modelling is to provide a tool for on-mine rock engineers to interpret current and planned mining geometry by extrapolating comparison of historical modelled and observed seismicity into the future for better and safer mining. Further work is planned in collaboration with mine staff, and it is hoped to expand the work to other mining operations on the Merensky Reef.
Acknowledgements
We thank Michael du Plessis, John Napier, Francois Malan, and Jan Kuijpers for useful discussions. The work would not have been possible without many discussions with, and assistance, from Rock Engineering staff of Impala Platinum. Les Gardner drove the discussion that led to Figure 10. The work has been supported in part by Impala Platinum, who have also given permission to publish this paper.
References
Brummer, R.K. 1987. Modelling the non-linear behaviour of fractured seams in deep gold mines. APCOM 87. Proceedings of the Twentieth International Symposium on the Applications of Computers and Mathematics in the Mineral Industries, Johannesburg, South Africa, 19-23 October 1987. South African Institute of Mining and Metallurgy, Johannesburg. vol. 1, pp.21-32. [ Links ]
Du Plessis, M., Malan, D.F., and Napier, J.A.L. 2011. Evaluation of a limit equilibrium model to simulate crush pillar behaviour, Journal of the Southern African Institute of Mining and Metallurgy. vol. 111, no. 12. pp. 875-885. [ Links ]
Environmental Sciences Research Institute Inc. 1997. ESRI Shapefile Technical Description. ESRI White Paper. Environmental Sciences Research Institute, Redlands CA. [ Links ]
Essrich, F., Hanekom, J.W.L., Stankiewicz, T.B.A., and Rangasamy, T. 2011. Minimising the increasing seismic risk in the platinum sector. Safety in Draft Final Project Report. Project number: SIM100301. Safety in Mines Research Advisory Committee, Johannesburg. 368 pp. [ Links ]
Garlan, D. and Shaw, M. 1993. An introduction to software architecture. Advances in Software Engineering and Knowledge Engineering, vol. I. World Scientific Publishing, New Jersey. pp. 6-8 [ Links ]
Handley, M.F. 2013. Pre-mining stress model for subsurface excavations in southern Africa. Journal of the Southern African Institute of Mining and Metallurgy, vol. 113, no.6. pp. 449-471. [ Links ]
Hoffmann, G., Murphy, S., Scheepers, L., and van Aswegen, G. 2013. Surface stress modelling of some shear slip seismic events that occurred in Anglogold Ashanti's tabular mines. 8th International Symposium on Rockbursts and Seismicity in Mines, St Petersburg and Moscow, 1-7 September 2013. Geophysical Survey of Russian Academy of Sciences, pp. 219-231. [ Links ]
Jager, A.J. and Ryder, J.A. 1999. A Handbook on Rock Engineering Practice for Tabular Hardrock Mines. SIMRAC, Johannesburg. [ Links ]
Ledwaba, L.S., Scheepers, J., Durrheim, R.J., and Spottiswoode, S.M. 2012. Seismic damage Mechanism at Impala Platinum Mine. SHIRMS 2012, Second Southern Hemisphere International Rock Mechanics Symposium, Sun City, South Africa, 14-17 May 2012. Southern African Institute of Mining and Metallurgy, Johannesburg. pp. 367-386. [ Links ]
Malovichko, D., van Aswegen, G., and Clark, R. 2012. Mechanisms of large seismic events in platinum mines of the Bushveld Complex (South Africa). Journal of the Southern African Institute of Mining and Metallurgy, vol. 112, no. 6. pp. 419-429. [ Links ]
Napier, J.A.L. and Malan, D.F. 2007. The computational analysis of shallow depth tabular mining problems. Journal of the Southern African Institute of Mining and Metallurgy, vol. 107, no. 11. pp. 725-742. [ Links ]
Napier, J.A.L AND Malan, D.F. 2011. The design of stable pillars in the Bushveld Complex mines: a problem solved? Journal of the Southern African Institute of Mining and Metallurgy, vol. 111, no. 12. pp. 821-836. [ Links ]
Napier, J.A.L and Malan, D.F. 2012. Simulation of time-dependent crush pillar behaviour in tabular platinum mines. Journal of the Southern African Institute of Mining and Metallurgy, vol. 112, no. 8. pp. 711-719 [ Links ]
Open GIS Consortium. 1999. Open GIS Simple Features Specification for SQL. [ Links ]
Peirce, A.P., Spottiswoode, S.M., and Napier, J.A.L. 1992. The spectral boundary element method: a new window on boundary elements in rock mechanics. International Journal of Rock Mechanics and Mining Sciences and Geomechanical Abstracts, vol 29, no. 4. pp. 379-400. [ Links ]
Spottiswoode, S.M. 2001. Synthetic seismicity mimics observed seismicity in deep tabular mines. Keynote address: 5th International Symposium on Rockbursts and Seismicity in Mines. South African Institute of Mining and Metallurgy, Johannesburg. pp. 371-378. [ Links ]
Spottiswoode, S.M, Scheepers, J., and Ledwaba, L. 2006. Pillar seismicity in the Bushveld Complex. Proceedings of SANIRE 2006: Facing the Challenges. South African National Institute of Rock Engineering. pp. 140-158. [ Links ]
Spottiswoode, S.M., Linzer, L.M., and Majiet, S. 2008. Energy and stiffness of mine models and seismicity. 1st Southern Hemisphere International Rock Mechanics Symposium, Perth, Western Australia, 16-19 September 2008. Australian Centre for Geomechanics. pp 693-707. [ Links ]
Spottiswoode, S.M., Milev, A.M., Linzer, L.M., and Majiet, S. 2009. Evaluation of the design criteria of regularly spaced dip pillars (RSDP) based on their in-situ performance. Draft Final Project Report SIM 04 03 01. Safety in Mines Research Advisory Committee, Johannesburg. http://stevespot.yolasite.com/resources/RSDP.pdf [ Links ]
Watson, B.P., Ryder, J.A., Kataka, M.O., Kuijpers, J.S., and Leteane, F.P. 2008. Merensky pillar strength formulae based on back-analysis of pillar failures at Impala Platinum. Journal of the Southern African Institute of Mining and Metallurgy, vol. 108, pp. 449-461. [ Links ]
Watson, B.P., Kuijpers, J.S., and Stacey, T.R. 2010. Design of Merensky Reef crush pillars. Journal of the Southern African Institute of Mining and Metallurgy, vol. 110, no. 10. pp. 581-591. [ Links ]
This paper was first presented at the, 6th Southern African Rock Engineering Symposium SARES 2014, 12–14 May 2014, Misty Hills Country Hotel and Conference Centre, Cradle of Humankind, Muldersdrift.

