


Servicios Personalizados
Articulo
 Inglés (pdf)
 Articulo en XML
 Referencias del artículo
Indicadores

Links relacionados
-
 Citado por Google
 -
 Similares en Google
Compartir

 Permalink
Journal of the Southern African Institute of Mining and Metallurgy
versión On-line ISSN 2411-9717
versión impresa ISSN 2225-6253
J. S. Afr. Inst. Min. Metall. vol.114 no.8 Johannesburg ago. 2014
Application of a localized direct conditioning mineral resource modelling technique for medium- and long-term planning of underground mining operations
W. Assibey-BonsuI; C. MullerII; H. PretoriusIII
IGold Fields Ltd, Perth, Australia
IIMinesoft Group, Johannesburg, South Africa
IIISouth Deep Mine, Gold Fields Ltd, Johannesburg, South Africa
SYNOPSIS
At the exploration stage for new mining projects or for medium- and long-term areas of existing mines (typical of South African gold mines), drilling data is on a relatively large grid. This grid is normally larger than the selective mining units (SMUs). Direct estimates for the SMUs and also of much larger block units will then be smoothed due to the information effect and the high error variance. Any capital-intensive project decisions made on the basis of any of the smoothed estimates will tend to misrepresent the economic value of the project or operation, i.e. the average grade of blocks above cut-off will be underestimated and the tonnage overestimated for cut-off grades below the mean grade of the orebody.
This paper presents a direct approach technique for deriving recoverable resources, referred to as localized direct conditioning (LDC), designed to correct smoothing effects and also to provide support corrections.
Keywords: direct conditioning, localized direct conditioning, smoothing effect, conditional biases, information effect, mine call factor, post-processing.
Introduction
For new mining projects or for medium- to long-term areas of existing mines, drilling data is on a relatively large grid. This grid is normally larger than the block size of a selective mining interest, i.e. the selective mining units (SMUs). Direct estimates for SMUs and also of much larger block units will then be smoothed due to the information effect and the high error variance of the estimate.
During actual mining, selection will be based on the estimated grades of SMUs utilizing the final close-spaced data grid, which will be available at that time. However, this ultimate position is unknown at the project feasibility stage or for medium- to long-term planning purposes, and therefore has to be estimated. Any capital-intensive project decisions made on the basis of any of the smoothed estimates will tend to misrepresent the economic value of the project or operation, i.e. the average grade of blocks above cut-off will be underestimated and the tonnage overestimated for cut-off grades below the average grade of the orebody.
Various post-processing techniques have been proposed to correct for this smoothing feature in estimates, such as spectral postprocessor (Journel et al., 2000), conditional simulations, as well as indirect post-processing techniques (Assibey-Bonsu and Krige, 1999; Marcotte and David, 1985). The general indirect approach to the problem above entails deriving the unknown SMU distribution from the observed distribution of relative large kriged blocks. Alternatives for the indirect approach are uniform conditioning (UC) and the assumed lognormal distribution of SMUs within large planning blocks.
This paper presents a direct approach correction technique developed within the Gold Fields Group. It uses the recoverable functions on direct estimates of individual selective mining units within the orebody (instead of indirect SMU distribution within large kriged blocks as used for UC). In essence, the direct conditioning approach is based on the principle of replacing these direct smoothed SMU kriged estimates with probability distributions representing the expected follow-up 'actual' grades. The probability distribution uses each smoothed SMU kriged estimate as the mean of the distribution at an uncertainty variance level that is equal to that expected for the 'actual' SMU grades (after correcting for the expected final production information effect). The direct approach and its equivalent, referred to as localized direct conditioning (LDC) estimates in this paper, provides a solution to certain practical difficulties of using indirect probability recoverable estimates for underground mine planning and design, before more data become available.
Description of methodology
The direct approach based on direct estimates of SMUs within the population area (Assibey-Bonsu and Krige, 1999) as used in the paper is summarized as follows.
Definitions:
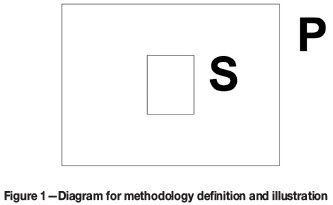
S = Selective mining unit (SMU) of interest
P = Entire population or global area being estimated
BVS = Variance of 'actual' SMUs in P (the theoretical dispersion variance of S in P)
σ2se1, σ2se2 = Error variances of conditionally unbiased estimates at exploration (or for long-term estimates) and final production stages for SMUs respectively.
Dispersion variances of conditionally unbiased estimates for direct SMUs
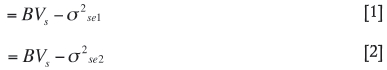
Dispersion variance at exploration stage from Equation [1] has to be adjusted up to that of the final production stage, i.e. Equation [2] by:

Thus, the LDC estimates are derived from the initial direct smoothed kriged estimates of the SMUs. The initial direct conditioning (DC) is derived by superimposing on the kriged estimate for each SMU block, a simulated lognormal distribution of expected 'actual* values with a variance equal to the difference in variability between the smoothed and 'actual' grades (Equation [3]). The simulated probability distributions have been derived using lognormal distribution of SMUs based on observed lognormal distribution of the point data (see Krige, 2003). The end result is an estimated unsmoothed grade-tonnage curve to replace the smoothed kriged equivalent.
Localization of estimates
The LDC methodology referred to in this paper extends the localized UC technique as proposed by Abzalov (2006). Abzalov uses the grade-tonnage functions from the large panel indirect estimates (derived from UC) and then decomposes the panel-specific grade-tonnage data into a suite of individual SMU grades within their respective panels. Abzalov suggested that the individual parcel grades of the SMUs derived from the decomposed UC approach be assigned to the SMU- size blocks within the respective panels based on a ranking of direct SMU grade estimates.
The DC post-processed grade-tonnage curves (Abzalov proposed use of the indirect equivalent) were summed within 120 m × 120 m areas to derive DC estimation results that are representative of the larger panels. These panel results were then decomposed as discussed above and used to assign non-smoothed individual SMU grade values to the respective SMU- size blocks. In essence, the LDC is derived by ranking of the original smoothed SMU simple kriging (SK) block estimates within the 120 m × 120 m areas in increasing order, and these are subsequently assigned the mean grade of a parcel (or a grade class) from the post-processed DC to the SMU blocks that matches the grade class in terms of rank. The LDC approach provides some advantages (including spatially located SMUs) particularly for underground mine design, where stope designs using indirect probability recoverable estimates have practical limitations.
Summary description of the LDC technique used in this paper
The basic process for LDC consists of the following steps:
>Derive simple kriging (SK) estimates of SMUs
>Estimate the local conditional probability distribution (lcpd) of non-smoothed grade estimates for each SMU (direct conditioning). The lcpd uses each smoothed SMU kriged estimate as the mean of the distribution and an associated variance parameter that is equal to that expected for the 'actual* SMU grades, (after correcting for the expected final production information effect). The lcpd process provides probability distributions of exceeding cut-off and grade above cut-off values for the respective SMUs (essentially a grade-tonnage curve per SMU)
> Agglomerate individual SMU grade-tonnage results into a 'panel* (in this case study a 120 m × 120 m panel is used). The aggregated probabilities of exceeding cutoff are then re-interpreted as 'proportions' of the panel that exceed the cut-off
> Decompose the resultant 'panel* grade-tonnage function to yield unsmoothed SMU grades; the linkage of these grades to SMU is obtained through ranking of the original smoothed SMU estimates within respective 'panels'.
The direct post-processing techniques effectively provide (for a set of blocks) the average proportion of ore and the corresponding grade that can be expected to be selected for mining when grade control data becomes available. The direct post-processing technique also provides for each SMU a probability that the SMU will exceed cut-off and the corresponding conditional grade estimate for that SMU. Note that such techniques can be applied only to block estimates that are conditionally unbiased. As demonstrated by Krige (1996), conditionally biased block/SMU estimates could display negative block efficiencies, leading to unreliable SMU estimates and inefficient inputs into the lcpds. These unsmoothed post-processed estimates (DC and LDC) can then be used in the medium term, as well as life-of-mine plan or for feasibility studies. However, the method does not provide (and no technique can ever fully provide, at an early stage) a practical detailed definition of the grades of the in situ individual SMU, which will eventually be selected or discarded. This is due to the limited drilling data and wide data spacing characteristic of the exploration stage for new mining projects or for medium- and long-term areas of existing mines.
Geology
The LDC methodology has been developed for Gold Fields' South Deep underground mine, where stope designs using probability recoverable estimates on indirect bases have practical limitations. South Deep is situated in the geologically unique and renowned Witwatersrand Basin, which is the world's premier gold region.
The reefs are widely considered to represent extensive fluvial deposits into a yoked basin, some 350 km long in an east-northeasterly direction and 200 km wide in a north-northwesterly direction. The gold is mainly of detrital origin, deposited syngenetically with the conglomerates and associated with sedimentary features such as unconformities and fluvial channels (Pretorius, 1991).
Locally, the reef horizons that are currently mined at South Deep include the Ventersdorp Contact Reef (VCR) and the Upper Elsburg reefs of the Mondeor Formation. In the western half of the mining lease area the VCR occurs as a single reef horizon that overlies footwall lithologies of the Turffontein Subgroup.
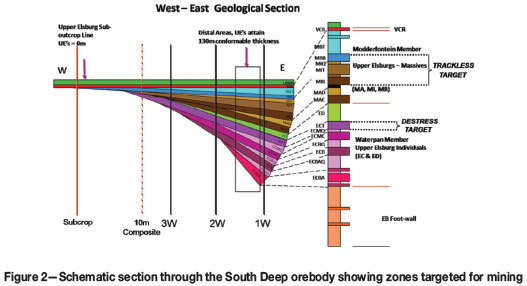
The Upper Elsburgs, which suboutcrop beneath the VCR in a north-northeast trend, comprise multiple stacked reef horizons that form part of an easterly-divergent clastic wedge as illustrated in Figure 2. The wedge attains a thickness of about 120 m to 130 m in the vicinity of the eastern boundary of the mining right area. The Upper Elsburg Reefs constitute 99% of the South Deep mineral reserve ounces, while the VCR makes up the remaining 1% (Osburn et al., 2014).
Database and summary of mineral resource assessment process used on the mine
The database consists of surface and underground grade-control diamond drilling originating from exploration, and resource and grade-control drilling data. For sample support requirement, the gold data-set is composited on one-metre intervals.
Sampling of the surface diamond core is done on half-core basis, while underground grade-control holes are sampled on a full-core basis. Every tenth sample is a control sample and alternates between a blank sample or a certified dual standard (both gold and uranium). For thinner intersections, which contain less than ten samples, a blank sample is inserted at the start of the sampling sequence and a certified reference material at the end.
Surface diamond core QA/QC control is based on two standard deviations from the mean expected value of the certified reference material, while that of the in-stope grade-control core samples is based on three standard deviations. Blank material QA/QC control is based on three times the detection limit.
Batches of 20 samples are dispatched to the laboratory containing one blank and one certified standard reference sample. It is also required that at least 90% of the pulverized material should pass 75 µm.
If either of the two control samples in a batch fails the control criteria, a new reference material is placed in the batch and the whole batch is then re-assayed. If a batch fails the second round, a further new reference material is included in the batch. The batch will then be submitted to a third-party laboratory (umpire) for re-assay. Batches that further fail at an umpire laboratory level are not authorized for any resource estimation work. Blind repeat pulp samples are re-submitted under new sample identifiers for precision analyses. These blind samples constitute a total of 5% of the total samples submitted in a quarterly period.
Geological modelling
Geological models are based on all available structural, grade, and sedimentological data. The structural data is used to generate 3D models, while the sedimentological, gold accumulation, gold grade, and channel width data is used to delineate geologically homogeneous local facies zones or geozones. These geozones or domains are used to constrain the statistical and geostatistical analyses on a soft domain basis, taking into account the drilling density in respective domains. The geology and the resource estimation models are updated on an ongoing basis as new data becomes available.
Various geology modelling software packages are used to develop the geological models and generate resource envelopes, taking cognisance of the geological models and geozones. Cross-referencing of the relevant plans and detailed checks ensure integrity of the defined envelopes. The resource estimation, including the development of LDC recoverable estimates, was derived using Gold Fields' in-house software (Resource Evaluation System - RES).
Statistical and variogram analyses
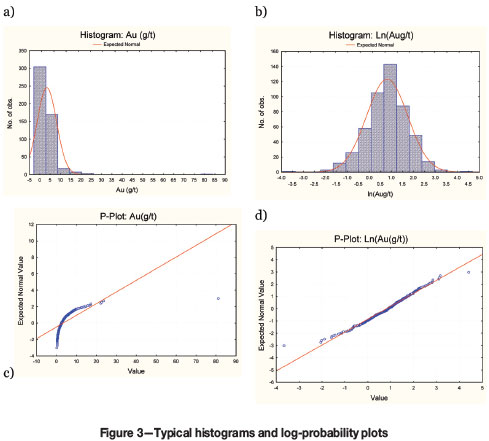
Descriptive statistics are applied to develop an understanding of the statistical characteristics and sample population distribution relationships. Descriptive statistics in the form of histograms and probability plots (Figure 3) are analysed to evaluate the lognormality of the respective domain distributions, since the post-processing phase of the analysis assumes lognormality of the distribution. All other relevant analyses, including variograms and kriged grades, are derived in the untransformed space.
The statistical analysis also facilitates the application of top-cut values for the variography and kriging processes. Some of the project areas and domains require top-cutting at the variography stage. These top-cuts are applied to minimize excessive variance of the experimental variogram caused by grade outliers. The top-cut values are derived from review and calculation from the normal and log probability plots. High nugget effects are common and are usually in the order of 40% to 50% of the total sill. High nugget effects contribute to poor initial SMU grade estimates and also impact negatively on the LDC recoverable estimates when limited data is available (especially for long-term areas of existing mines).
Selective mining units
All SMU sizes are defined according to possible equipment, mining method, and mining selectivity, together with the geology of the orebody. At South Deep, different SMU sizes are used taking into account different mining methods, including longhole stoping.
Block estimation methods
Both ordinary kriging (OK) and simple kriging (SK) techniques are applied in developing the pseudo SMU blocks (30 m x 30 m x 1 m) estimation grade models. However, for post-processing of the recoverable resources which are used for mine planning, the SK panel grades are used. This is as a result of the relatively efficient SK estimates as reflected by higher kriging efficiencies observed for the SK panel estimates in most relevant areas of the operation, and especially in areas of limited data. Theoretically, the slope of regression of an SK estimate is unity. In this regard, the SK panel estimates are conditionally unbiased. The SK process uses a local or global mean in the kriging process depending on availability of data. If insufficient samples exist to support the local mean then the 'global' mean of the respective geozone is used in the SK process. In providing the mean value used in the SK estimation, historical mined-out information is taken into account for the respective reef horizons, to ensure that the input SK mean values are efficient. It is critical that the SK input means are analysed for robustness as inappropriate choice of this value may propagate biases, particularly in the presence of a drift. In addition, the estimation error associated with the SK input means can be incorporated in the SK estimation process. The weight assigned to the mean can also be used as an indicator of the quality of the estimates.
Kriged block model checks
Various checks are performed on the kriged block models to ensure grades are assigned correctly to model cells. The first check entails viewing the composite data with block model cells to check that the grade values in the boreholes relate to block model cell values. Other checks performed include the number of samples used in estimation, kriging efficiency, regression slopes, block distance from samples, and search volumes. The estimation process also produces a log file to check outputs, including average raw data versus average kriged values, minimum and maximum values, and SK versus OK values.
Post-processing to derive LDC recoverable estimates
The kriged blocks (30 m × 30 m × 1 m) are subjected to LDC post-processing as discussed under methodology, and each SMU block is assigned a non-smoothed individual grade value (see Assibey-Bonsu and Krige, 1999; Krige, Assibey-Bonsu and Tolmay, 2008). These non-smoothed post-processed LDC estimates are used for mine planning. A final production grade-control grid of 30 m × 30 m has also been assumed in deriving the recoverable resources, which is based on the expected final production grade-control drilling on the mine.
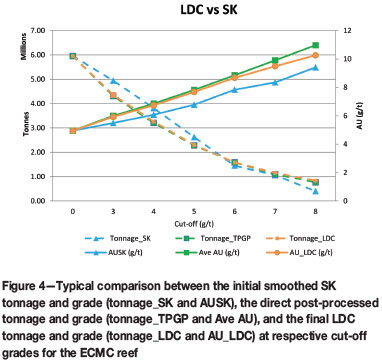
Figure 4 compares the smoothed SK panel estimates with the unsmoothed LDC estimates for the ECMC economic reef horizon (the in situ case study shown later is for the MBB reef). The grade-tonnage curves based on the non-post-processed smoothed estimates generally show that the average grade of blocks above cut-off will be underestimated and the tonnage overestimated. Thus, any capital-intensive project decisions or mine planning made on the basis of any of the smoothed estimates will tend to misrepresent the economic value of the project. In certain cases some deviations have been observed between the LDC and the original recoverable functions at very high cut-offs. This could be associated with the relatively small number of SMUs within the panels and also at these high cut-offs.
Resource classification
The Mineral Resource classification is a function of the confidence of the whole process from drilling, sampling, geological understanding, and geostatistical relationships. The following aspects or parameters are considered for Mineral Resource classification:
> Sampling - quality assurance and quality control (QA/QC)
> Geological confidence
> Slope of regression and kriging efficiency
> Deviation based on the lower 90% confidence limit estimates.
Summary of production reconciliation results following the introduction of LDC on the mine
In situ reconciliation of LDC resource estimates and grade control estimates
The LDC resource estimation technique aims at providing medium- to long-term estimates. As a result, the mine has embarked on a planned 30 m x 30 m grade-control drilling programme, aimed at improving local estimate for short-term production planning/forecasting. Some progress has been made in certain areas of the mine; however, there have been various practical problems in keeping abreast with the GC drilling campaign, including non-availability of drilling platforms.
Table I shows results from one of the areas where the LDC resource model estimates (based on an average data spacing of approximately 80 m x 80 m), have been reconciled with the follow-up grade control (GC) model post the GC drilling on 30 × 30 m grid over a 2-year period. For the purpose of this paper, the in situ reconciliation case study was done in a selected area measuring approximately 300 m × 200 m for the MBB reef, which is one of the main economic reefs at the mine. Within the case study area the total MBB tonnage is 158 kt
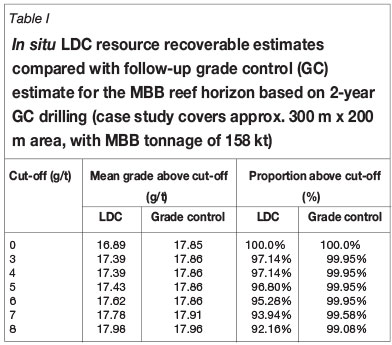
Table I shows the result of aggregating the LDC recoverable resources for individual SMUs over the 'global' GC drilled area. Although the case study represents a small area of the mine, the table shows good results for the 'global' grade and tonnage reconciliations for the respective cut-offs, but some underestimation for the LDC technique. For all practical purposes this is not serious, as at the mine's current economic cut-off of about 4 g/t, the 'global' LDC percentage errors are within 3% for tons and grade. However, conditional biases were still present on individual LDC SMU estimates, as reflected by a slope of regression of 0.62, which could present local-scale inefficient estimates due to limited data available for the initial LDC estimates.
Analysis of MCF at South Deep Following the introduction of LDC resource estimation
The mine call factor (MCF) reconciles the gold called for at the planning stage with the gold recovered at the end of a period. The International standard definition of MCF is as follows (AMIRA, 2007):
The ratio, expressed as a percentage, which the specific product accountedfor in the product recoveredfrom a plant, plus that in tailings/residues bears to the corresponding product called for [claim] by the measurement and evaluation methods used at the mine.
This section of the paper provides a summary analysis of the MCF observed at South Deep since the introduction of the LDC technique in June 2010.
Although there are several direct and indirect production and modifying factors that affect the MCF (including planned/unplanned dilution, planned/unplanned mining losses, introduction of new additional mining methods etc.), the paper presents the observed MCF changes before and after the introduction of LDC and provides indirect comments in this regard. These comments are provided taking into account the good in situ reconciliations of LDC estimates compared to that of GCs, as observed in several scattered areas of the mine where GC drilling has taken place; also as demonstrated in this paper for the case study area. The observed improved correlation of the MCF following the introduction of LDC does not necessarily provide conclusive evidence of the performance of LDC. However, as highlighted above, the good LDC and GC model in situ reconciliations observed so far tend to support this assertion.
Although the mine is systematically introducing GC drilling (on a 30 m × 30 m grid), most of the areas mined to date are planned on the basis of the LDC estimates. In this regard, any impact on the MCF cannot be attributed to increased drill data density.
The introduction of the LDC technique also coincides with the launching of the longhole mining method. Although longhole stopes are planned in specific months, mining and final cleaning of ore from these stopes takes place typically over a period of three to six months. As a result, short-term MCF numbers represent only indications of what the respective stopes will finally deliver. In this regard and in order to provide a more reliable MCF for South Deep during the period when the LDC technique was introduced, a 6-month average of MCF production results is provided in this paper.
Table II shows the 6-month MCFs over the 3 years and 6 months periods (i.e. after the introduction of the LDC technique). The table shows a MCF of 91% to 106% reflecting variances of -9%/+6%. The table further shows an overall MCF average of 101% after the introduction of the LDC technique. Table II also presents the observed MCF at the mine before the introduction of LDC and shows the MCF for the previous 2 years (i.e. before the introduction of LDC) averaged 116%, and ranging from 105% to 124%. Figure 5 demonstrates these results graphically and shows a generally better trend for the LDC period.
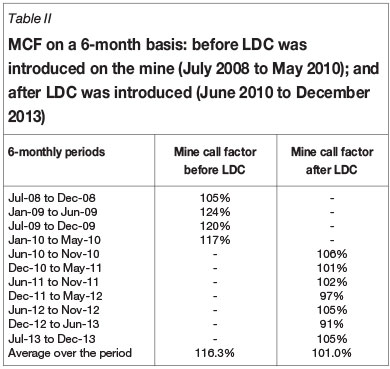
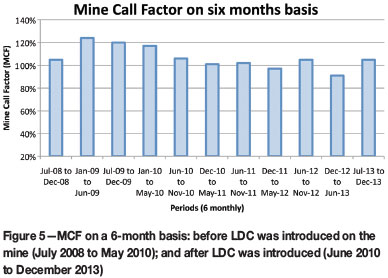
Thus, the pre-LDC and post-LDC MCFs seem to indicate an improvement of the MCF (post introduction of LDC). As emphasized previously, the observed improved correlation of the MCF following the introduction of LDC does not necessarily provide conclusive evidence of the performance of LDC (due to other production and modifying factors that affect MCFs). However, the good LDC and GC model in situ reconciliations observed so far, and as discussed in this paper, tend to support this assertion.
Conclusions
Reconciliations to date at South Deep show encouraging results following the introduction of a simple kriging-based localized direct conditioning (LDC) methodology to the resource estimation procedure at the mine. However, conditional biases have been observed at a small-scale level for the LDC estimates, indicating that caution is required when using LDC for short-term mine planning. It is important that the mine strives to maintain and keep abreast of the necessary grade-control drilling programmes, which will improve local-scale estimation, as the LDC technique aims to improve medium- to long-term recoverable resource estimates.
Although there are other indirect production and modifying factors affecting the MCF, the general observed improvement in the MCF over a period of more than three years since the introduction of LDC could be attributed partly to the improved LDC estimates.
References
Abzalov, M.Z. 2006. Localised uniform conditioning (LUC): a new approach to direct modelling of small blocks. Mathematical Geology, vol. 38, no. 4. pp. 393-411. [ Links ]
Assibey-Bonsu, W., Krige, D.G., and Tolmay, L. 2008. Uncertainty grade assessment for short and medium-term mine planning of underground mining operations. Proceedings of Geostats2008, Eighth International Geostatistics Congress, Santiago, Chile, 1-5 December 2008. Ortiz, J.M. and Emery, X. (eds.). Gecamin Ltd. pp. 739-748. [ Links ]
Assibey-Bonsu, W. and Krige, D.G. 1999. Use of direct and indirect distributions of selective mining units for estimation of recoverable resource/reserves for new mining projects. APCOM '99, Proceedings of the 28th International Symposium on Computer Applications in the Mineral Industries, Colorado School of Mines, Golden, CO., 20-22 October 1999. Dagdelen, J. (ed.). Colorado School of Mines. [ Links ]
Journel, A.G., Kyriadkidis, P.C., and Mao, S. 2000. Correcting the smoothing effect of estimators: a spectral postprocessor. Mathematical Geology, vol. 32, no. 7. pp. 787-813. [ Links ]
Krige, D.G. 2003. Some practical aspects of the use of lognormal models for confidence limits and block distributions in south African gold mines. APCOM 2003. Proceedings of the 31st International Symposium on Computer Applications in the Mineral Industries, Cape Town, 14-16 May 2003. Camisani-Calzolari, F.A. (ed.). South African Institute of Mining and Metallurgy, Johannesburg. pp. 409-414. [ Links ]
Marcotte, D. and David, M. 1985. The bigaussian approach: a simple method for recovery estimation. Mathematical Geology, vol. 17, no 6, pp. 625-644. [ Links ]
Morrison, R.D. (ed.). 2008. An introduction to metal balancing and reconciliation. JKMRCMonograph Series in Mining and Mineral Processing 4. p. 618. [ Links ]
Osburn, J., Pretorius, H., Kock, D., King, N., Pillaye, R., and Hlangwane, M. 2014. Enhanced geological modelling of the Upper Elsburg reef and VCR to optimize mechanized mine planning at South Deep Gold Mine. Journal of the Southern African Institute of Mining and Metallurgy, vol 114, no. 3. pp. 275-284. [ Links ]
Pretorius, D.A. 1991. The sources of the Witwatersrand gold and uranium; a continued difference of opinion. Historical Perspectives of Genetic Concepts and Case Histories of Famous Discoveries. Economic Geology Monograph, vol 8. pp 139-163. [ Links ]

